
This paper presents a fully-corrected measurement of the energy-energy correlator (EEC) within jets in pp collisions. The EEC traces the energy flow as a highly energetic parton undergoes a QCD shower followed by the confinement of partons into hadrons, probing the correlation function of the energy flow inside jets. The EEC observable is measured as a function of the charged particle pair angular distance, $R_{\rm L}$, for $20 <~ p_{\rm T}^{\rm ch \, jet} <~ 80$ GeV/$c$. In the perturbative region (large $R_{\rm L}$), a good agreement between the data and a next-to-leading-log perturbative QCD calculation is observed. In the non-perturbative region (small $R_{\rm L}$), the data exhibits a linear $R_{\rm L}$ dependence. There is a transition region in between, characterized by a turnover in the EEC distribution, indicating where hadronization effects begin to dominate. The peak of this transition region is located at $2.43 \pm 0.14$ GeV/$c/\langle p_{\rm T}^{\rm ch \, jet}\rangle$ for jets of various energies, indicating a common energy scale for the hadronization process. State-of-the-art Monte Carlo event generators are compared with the measurements, and can be used to constrain the parton shower and hadronization mechanisms.
Phys. Rev. D 114 (2026) 3, 032002
HEP Data
e-Print: arXiv:2409.12687 | PDF | inSPIRE
CERN-EP-2024-245
Figure group


Figure 3
Normalized $\Sigma_{\text{EEC}}$ as a function of $\langle p_{\mathrm{T}}^{\text{ch jet}} \rangle$. $\ln\langle p_{\mathrm{T}}^{\text{ch jet}} \rangle$ in the y-axis represents $\ln(\langle p_{\mathrm{T}}^{\text{ch jet}} \rangle/(\mathrm{GeV}/c))$, a unit-less number, used throughout this paper for simplicity in notation. The gray line corresponds to the maximum location of the distribution and the gray band corresponds to a $\pm 0.14\ \mathrm{GeV}/c$ uncertainty along the x-axis. The orange curves show pQCD calculations, which are normalized to data such that the integral inside $R_{\mathrm{L}}$ range of $12\ \mathrm{GeV}/c/\langle p_{\mathrm{T}}^{\text{ch jet}} \rangle$, marked by the vertical dashed orange line, to 0.4 are the same. The purple curve represents a linear functional form that is fit to data ($\chi^2 = 1.65$) in the $R_{\mathrm{L}}$ range of 0.01 to $0.7\ \mathrm{GeV}/c/\langle p_{\mathrm{T}}^{\text{ch jet}} \rangle$, marked by the vertical dashed purple line. As the fitting range for the linear curve is mostly accessible by the data in $20\text{--}40\ \mathrm{GeV}/c$, the comparison of linear fit to data is only shown for $20\text{--}40\ \mathrm{GeV}/c$. As the normalization range for the orange pQCD curve is mostly accessible by the data in $60\text{--}80\ \mathrm{GeV}/c$, the comparison of pQCD to data is only shown for $60\text{--}80\ \mathrm{GeV}/c$. | 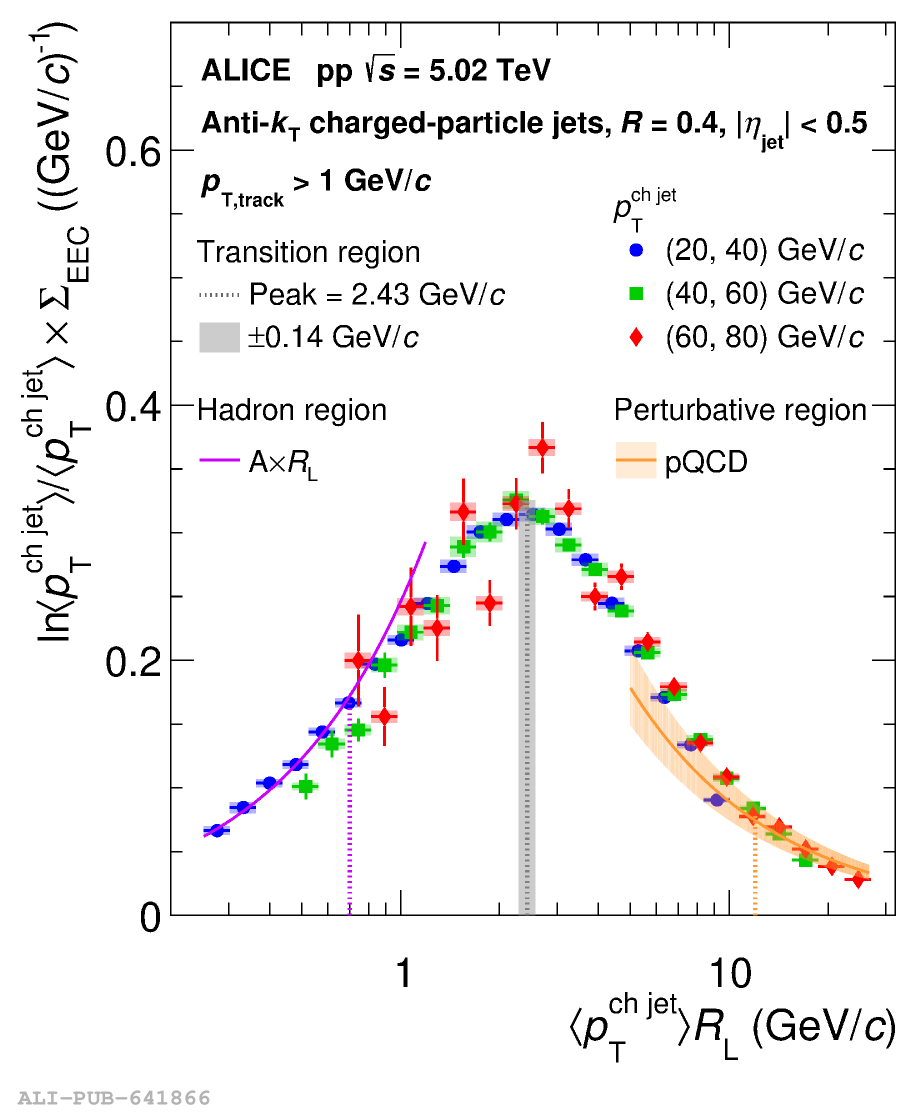 |



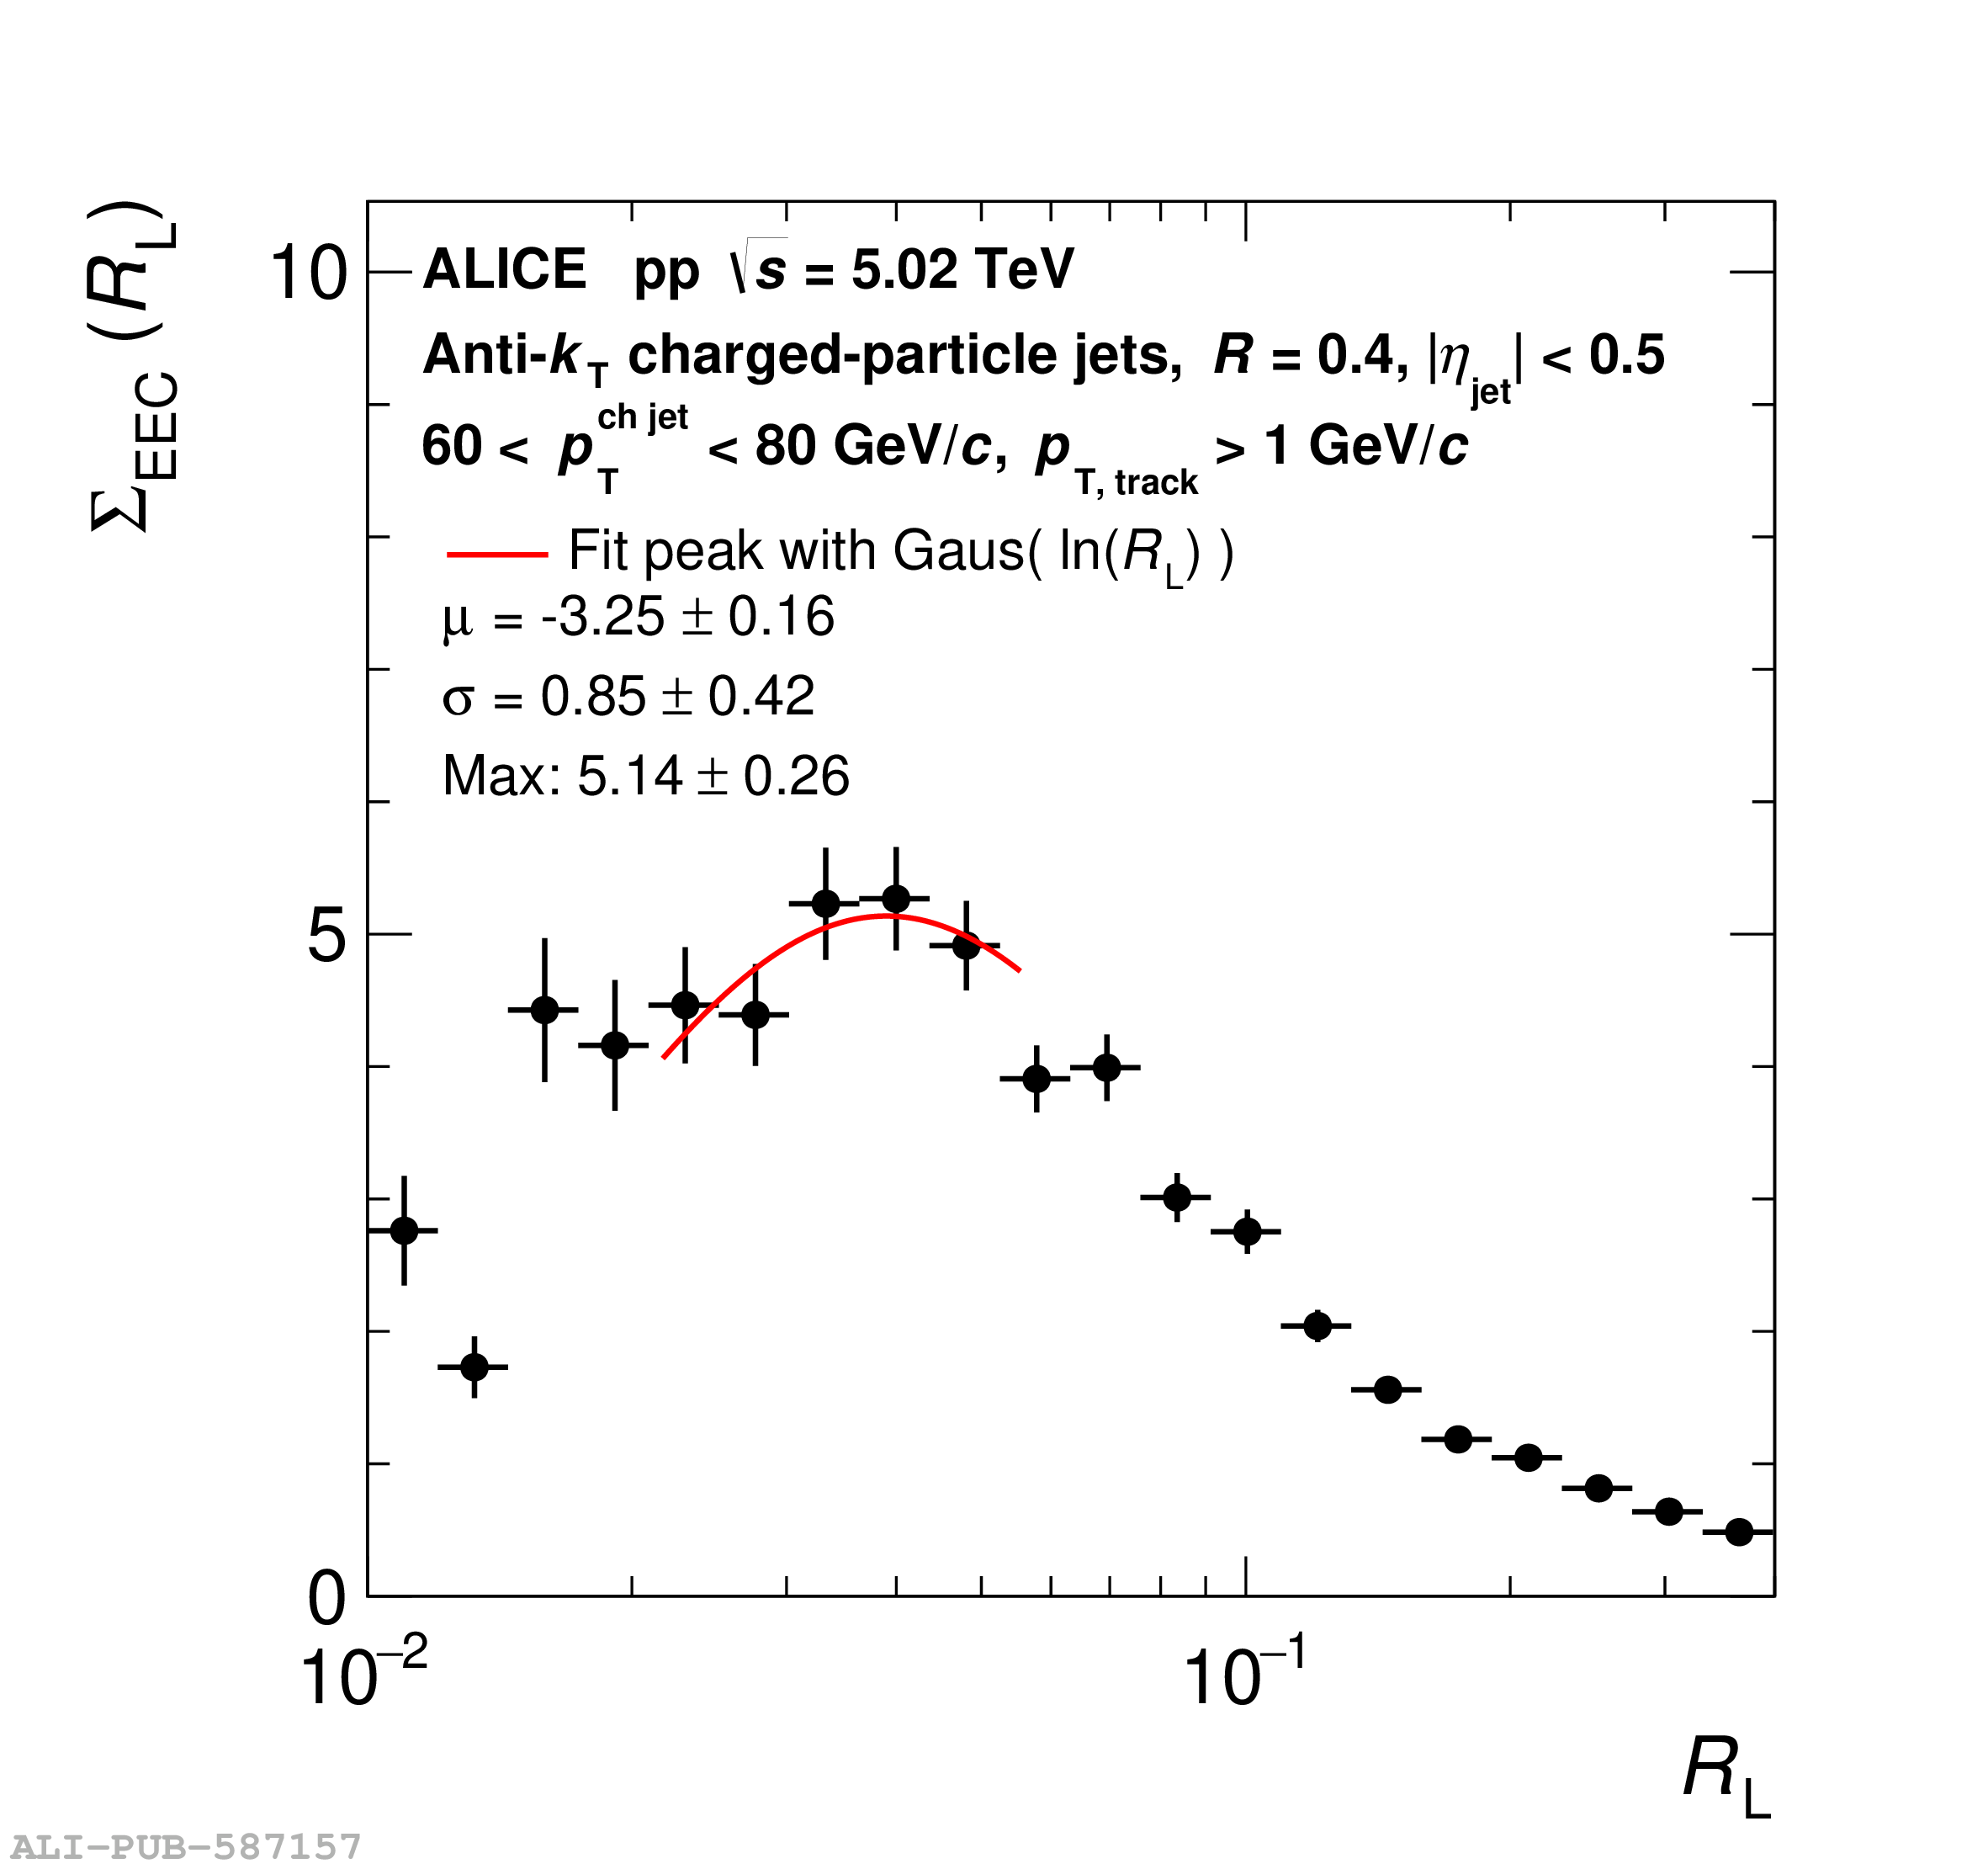
Figure B.2
Left: jet $p_{\mathrm{T}}$ dependence of the transition peak position $R_{\mathrm{L}}^{\text{peak}}$. Right: jet $p_{\mathrm{T}}$ dependence of the transition peak height $\Sigma_{\mathrm{EEC}}^{\text{peak}}$. The notation $\ln\langle p_{\mathrm{T}}^{\text{ch jet}} \rangle$ in the y-axis represents $\ln(\langle p_{\mathrm{T}}^{\text{ch jet}} \rangle/(\mathrm{GeV}/c))$, a unit-less number, used throughout this paper for simplicity in notation. |  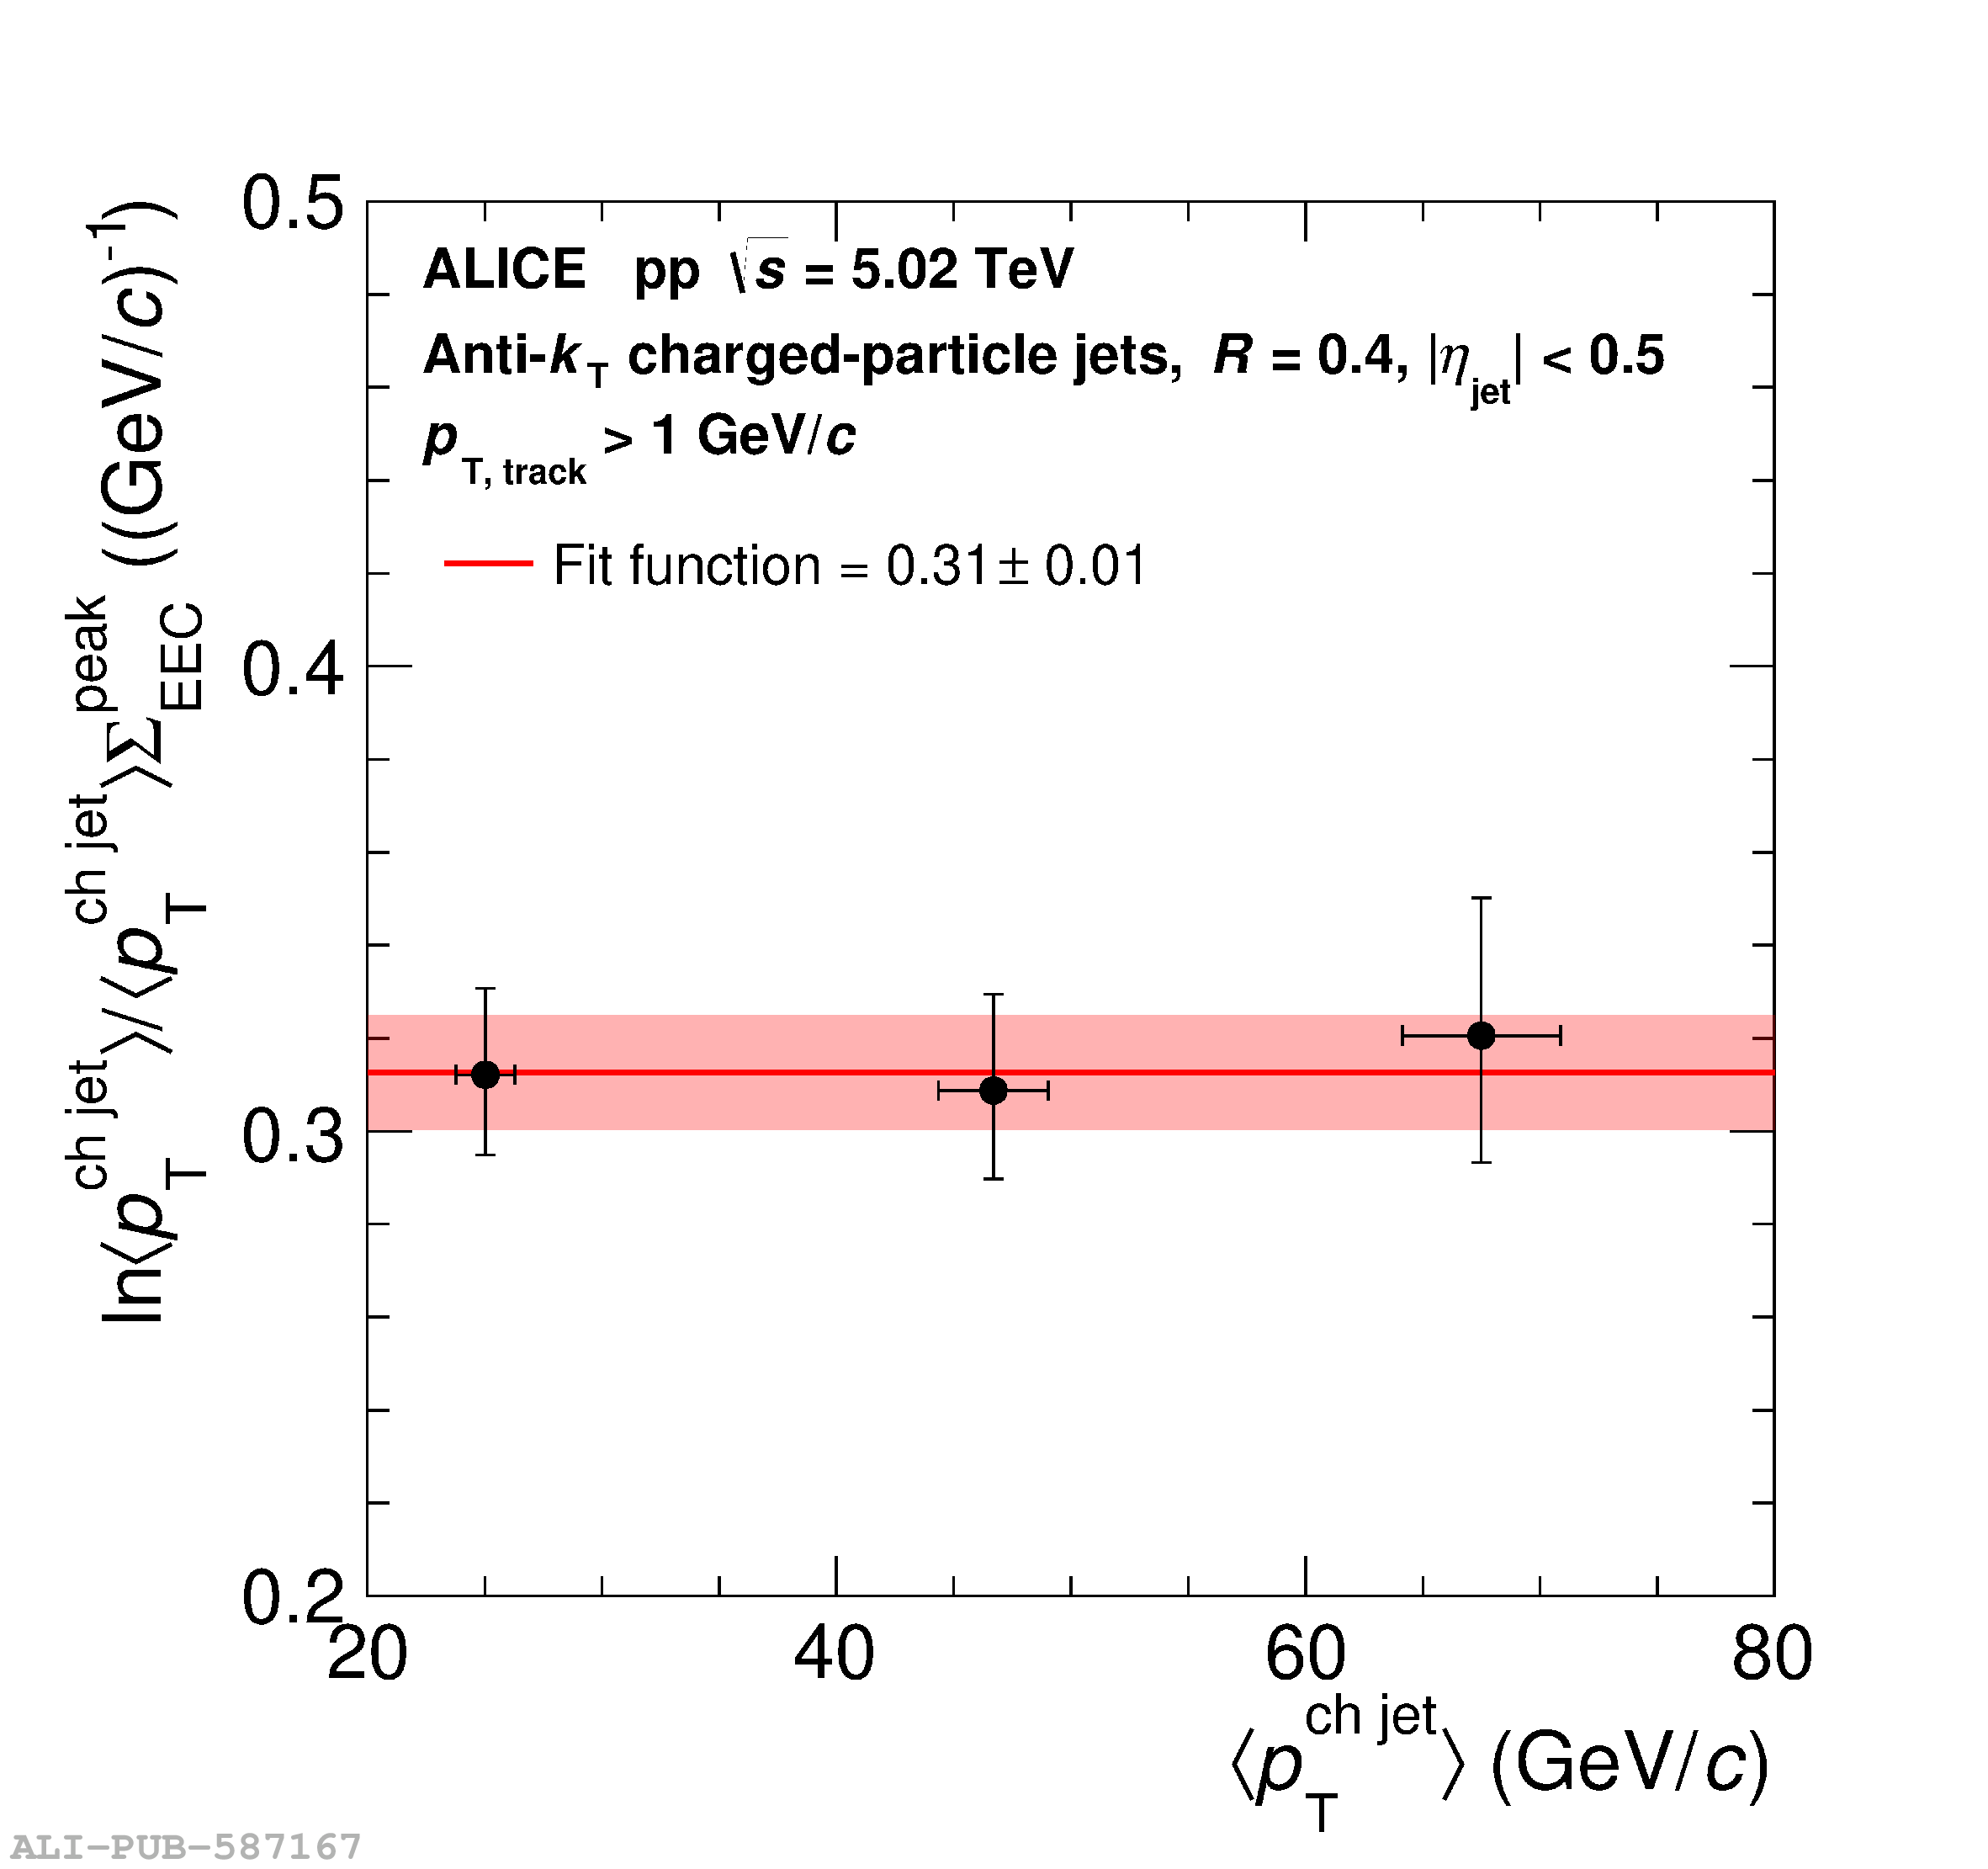 |
Figure B.3
Normalized $\Sigma_{\text{EEC}}$ as a function of $\langle p_{\mathrm{T}}^{\text{ch jet}} \rangle R_{\mathrm{L}}$ for $p_{\mathrm{T}}^{\text{ch jet}}$ in 20–40, 40–60, and 60–80 $\mathrm{GeV}/c$. Statistical and systematic uncertainties are combined in quadrature. The fit function is shown by the red curve, with the solid portion indicating the fitting range. | 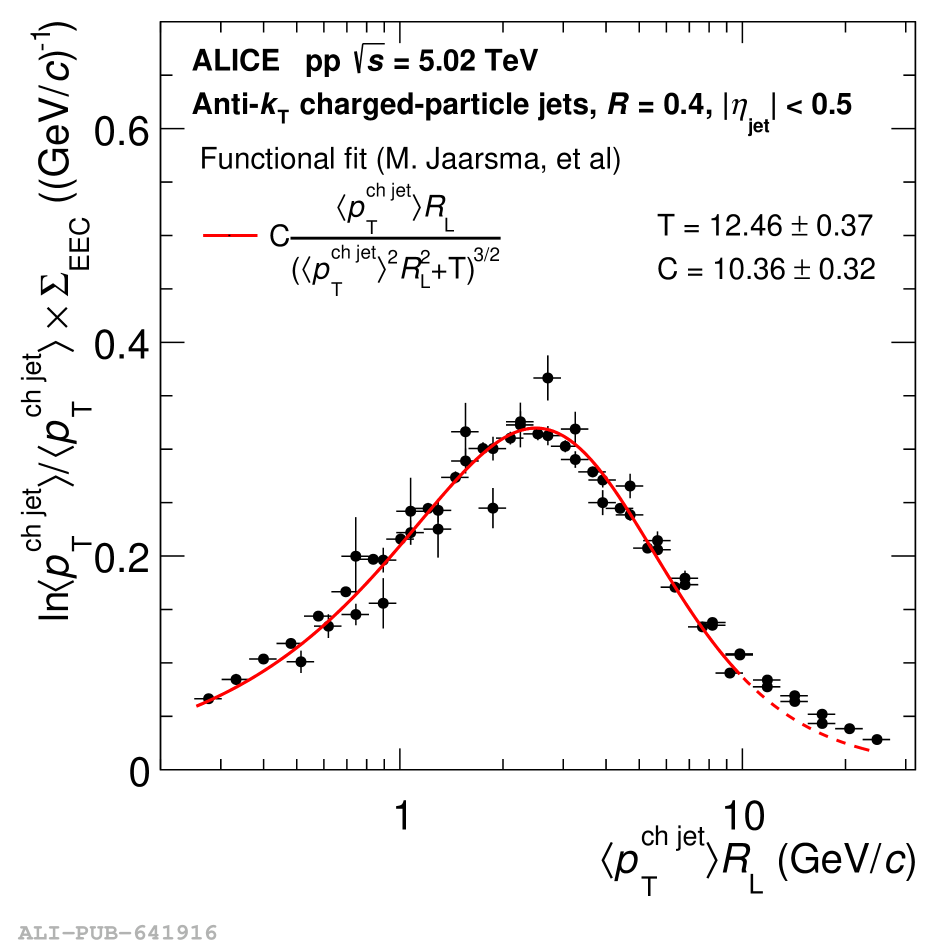 |
Figure C.1
Comparison $\Sigma_{\mathrm{EEC}}$ as a function of $R_{\mathrm{L}}$ with 0.15 $\mathrm{GeV}/c$, 0.5 $\mathrm{GeV}/c$, and 1 $\mathrm{GeV}/c$ track $p_{\mathrm{T}}$ threshold cut in the $p_{\mathrm{T}}^{\text{ch jet}}$ intervals 20–40, 40–60, and 60–80 $\mathrm{GeV}/c$. Systematic uncertainties are not shown here. | 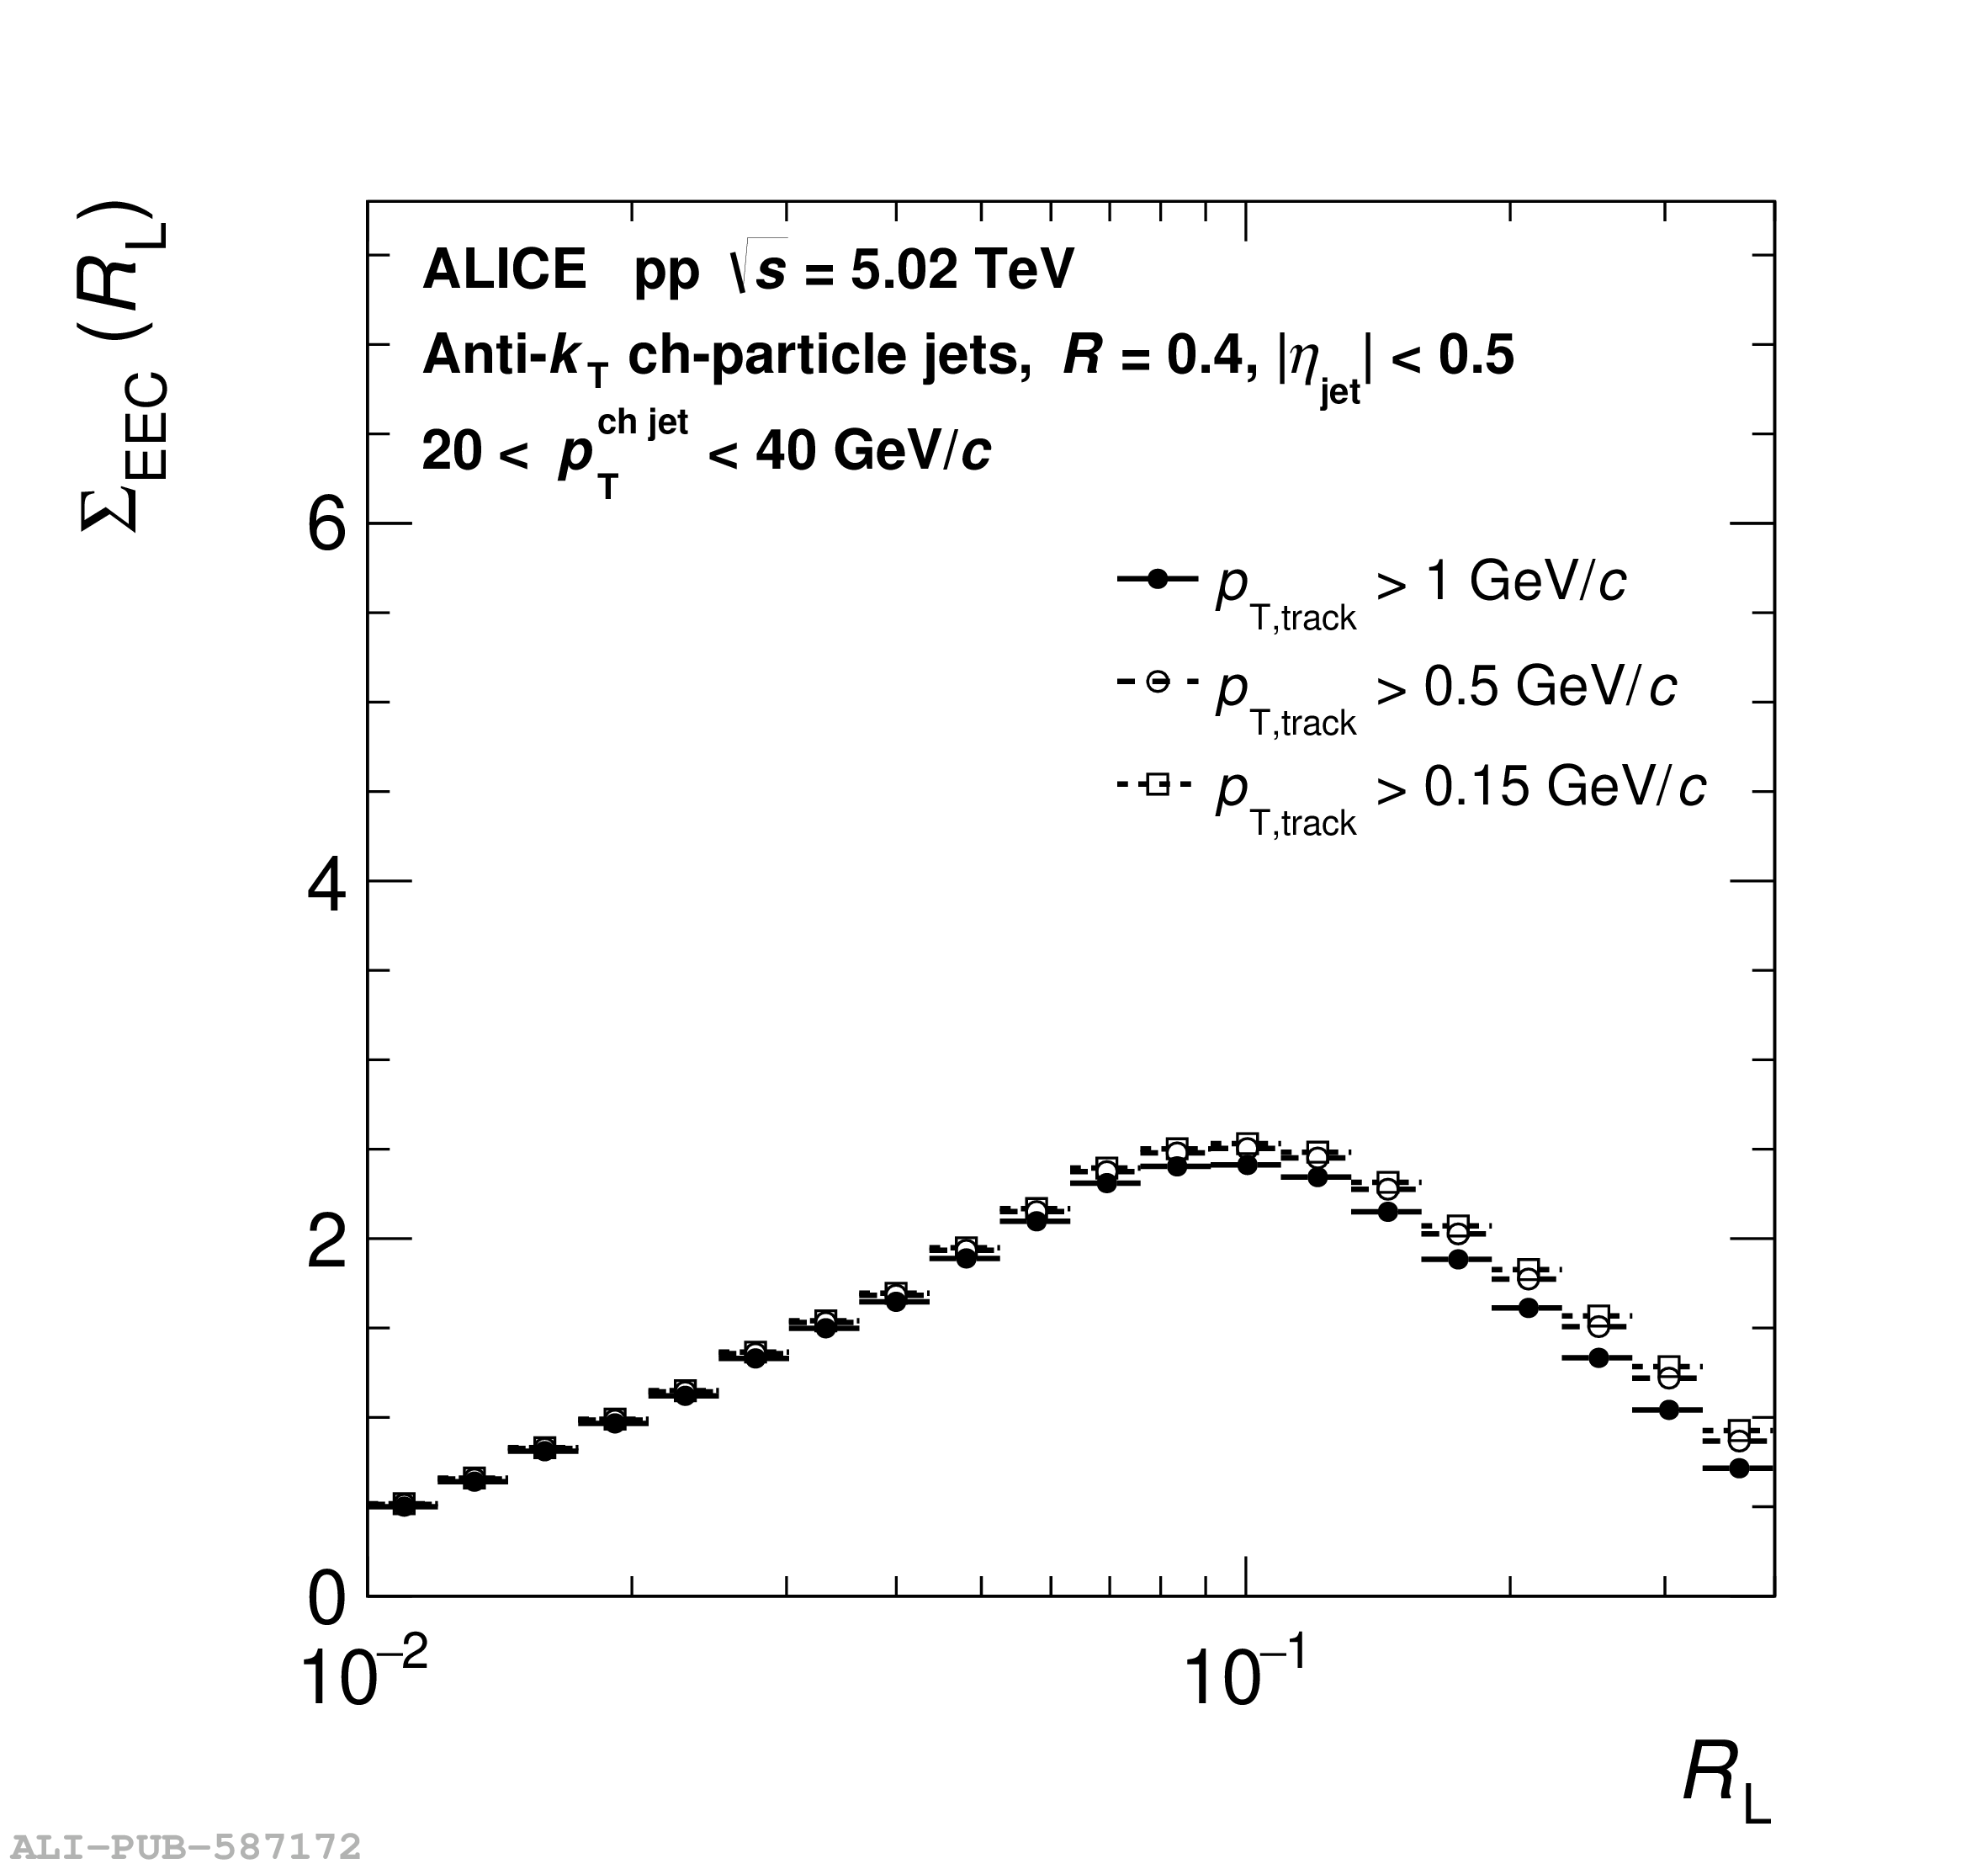   |
Figure D.1
Comparison of $\Sigma_{\mathrm{EEC}}$ as a function of $R_{\mathrm{L}}$ with different values for TimeShower:pTmin using generated Pythia events. The default setting is 0.5 (blue markers). The parton level distributions are made from parton jets that are matched to the charged jets with $p_{\mathrm{T}}$ range indicated in each figure. |  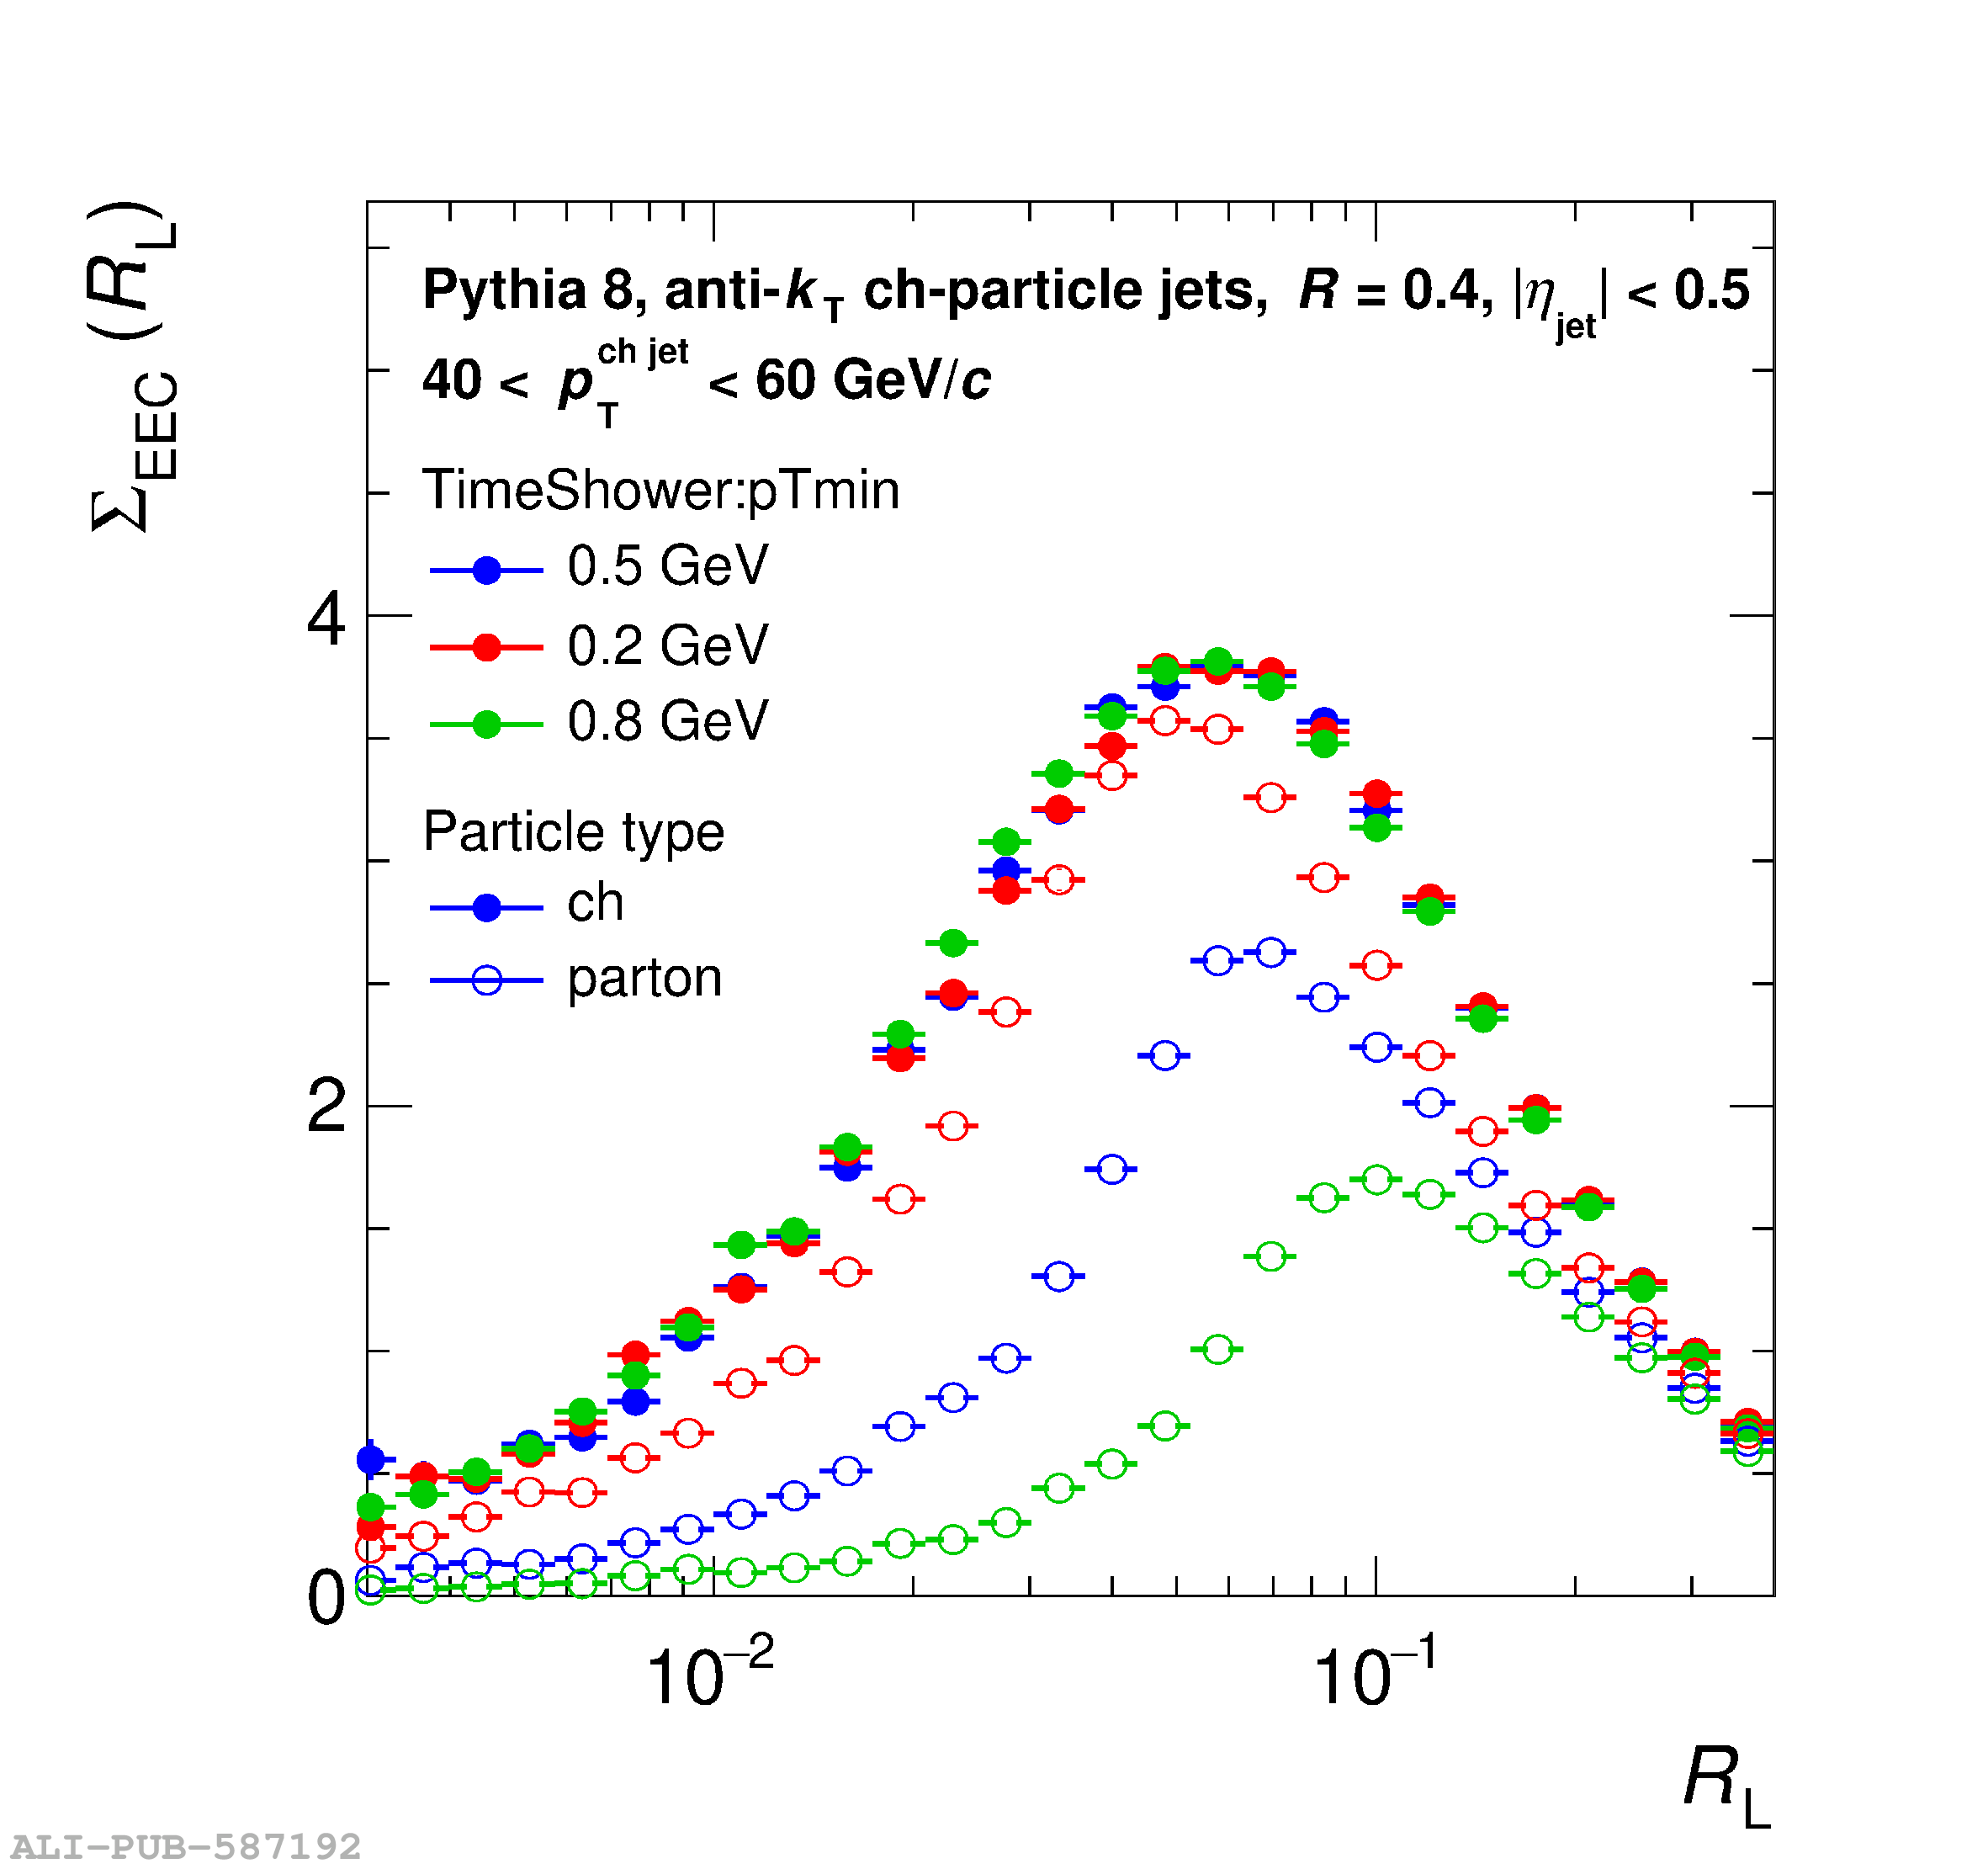  |
Figure D.2
Comparison of $\Sigma_{\mathrm{EEC}}$ section as a function of $R_{\mathrm{L}}$ with different values for StringPT:sigma using generated PYTHIA 8 events. The default setting is 0.335 (blue markers). The parton level distributions are made from parton jets that are matched to the charged jets with $p_{\mathrm{T}}$ range indicated in each figure. | 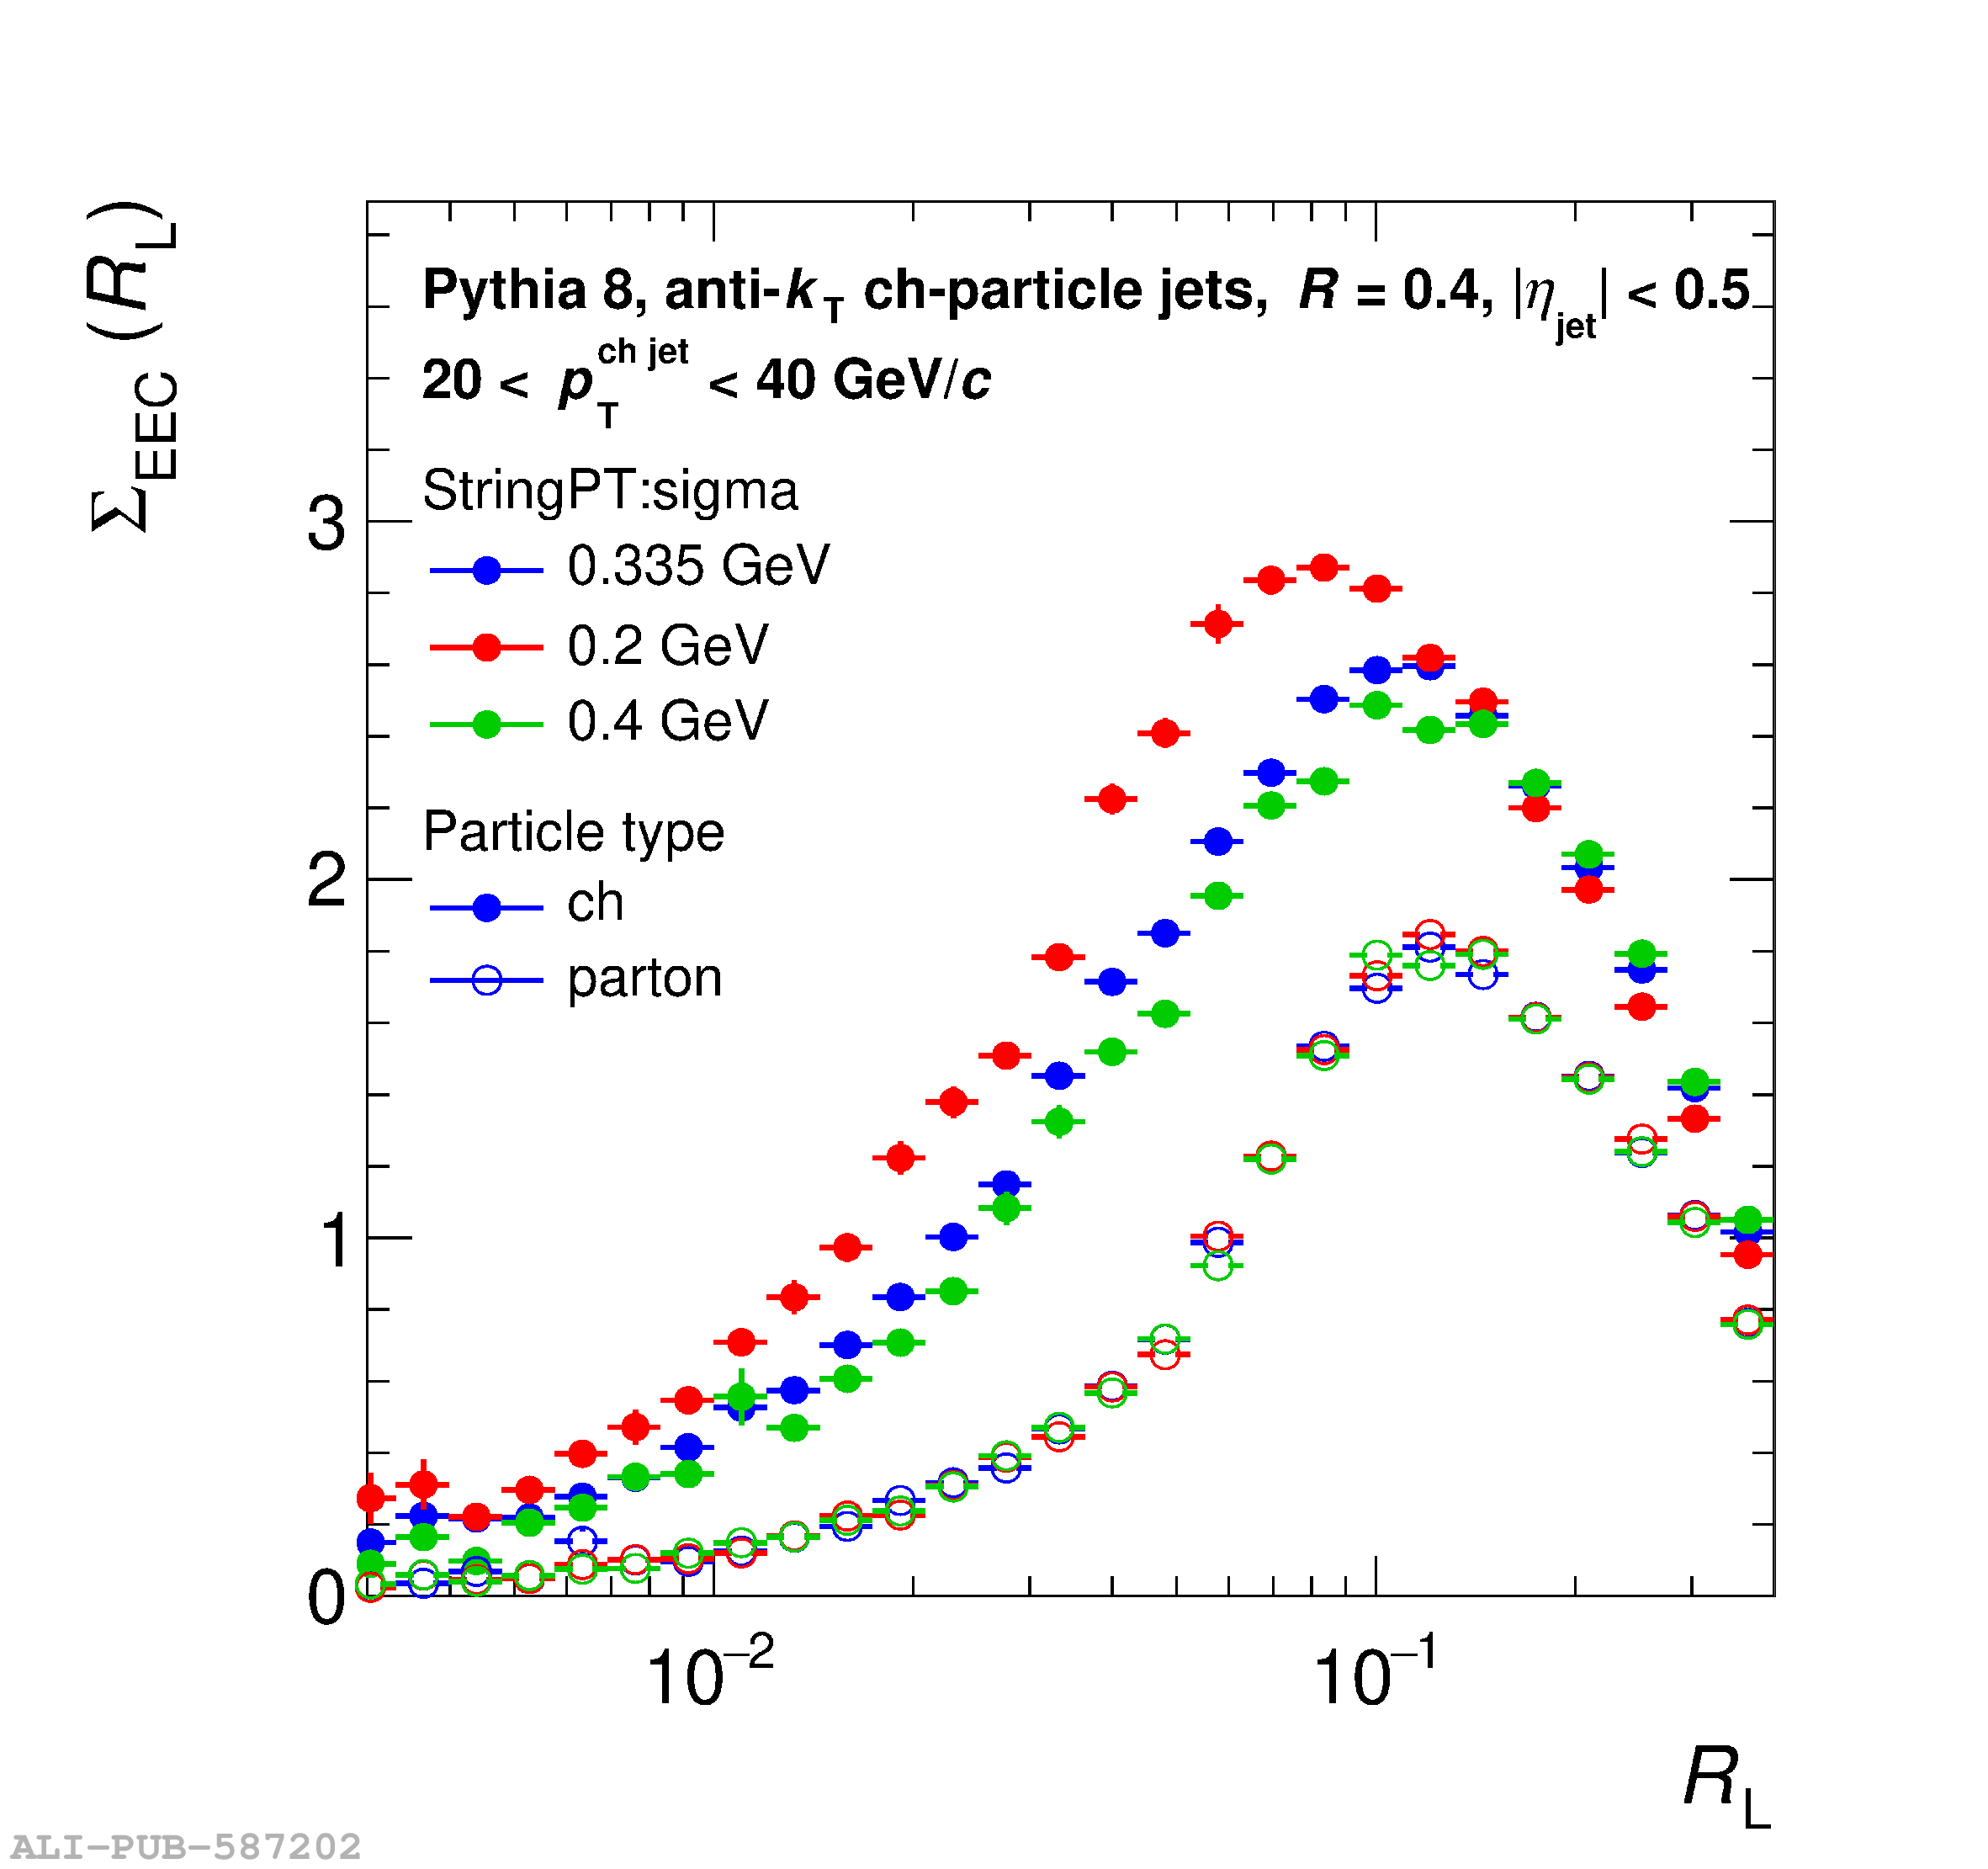   |