
Normalized $\Sigma_{\text{EEC}}$ as a function of $\langle p_{\mathrm{T}}^{\text{ch jet}} \rangle$. $\ln\langle p_{\mathrm{T}}^{\text{ch jet}} \rangle$ in the y-axis represents $\ln(\langle p_{\mathrm{T}}^{\text{ch jet}} \rangle/(\mathrm{GeV}/c))$, a unit-less number, used throughout this paper for simplicity in notation. The gray line corresponds to the maximum location of the distribution and the gray band corresponds to a $\pm 0.14\ \mathrm{GeV}/c$ uncertainty along the x-axis. The orange curves show pQCD calculations, which are normalized to data such that the integral inside $R_{\mathrm{L}}$ range of $12\ \mathrm{GeV}/c/\langle p_{\mathrm{T}}^{\text{ch jet}} \rangle$, marked by the vertical dashed orange line, to 0.4 are the same. The purple curve represents a linear functional form that is fit to data ($\chi^2 = 1.65$) in the $R_{\mathrm{L}}$ range of 0.01 to $0.7\ \mathrm{GeV}/c/\langle p_{\mathrm{T}}^{\text{ch jet}} \rangle$, marked by the vertical dashed purple line. As the fitting range for the linear curve is mostly accessible by the data in $20\text{--}40\ \mathrm{GeV}/c$, the comparison of linear fit to data is only shown for $20\text{--}40\ \mathrm{GeV}/c$. As the normalization range for the orange pQCD curve is mostly accessible by the data in $60\text{--}80\ \mathrm{GeV}/c$, the comparison of pQCD to data is only shown for $60\text{--}80\ \mathrm{GeV}/c$. | 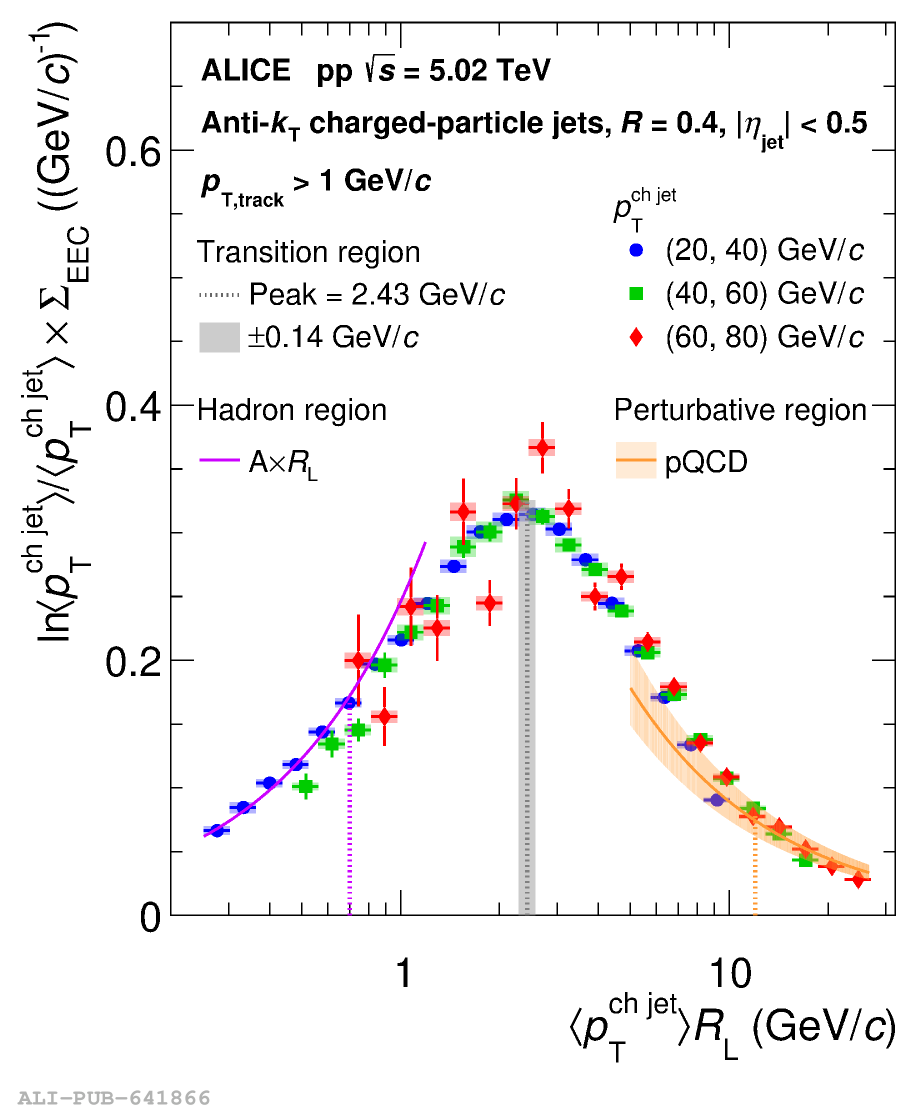 |