Inclusive $\Upsilon$ $\raa$ as a function of the average number of participant nucleons. ALICE data refer to the rapidity range $2.5< y< 4$ and are shown together with CMS data which are reported in $|y|< 2.4$. The vertical bars represent the statistical uncertainties and the boxes the point-to-point uncorrelated systematic uncertainties. The relative correlated uncertainties (12% for ALICE and 14% for CMS) are shown as a box at unity. The point-to-point horizontal error bars correspond to the RMS of the $N_{\rm part}$ distribution. | 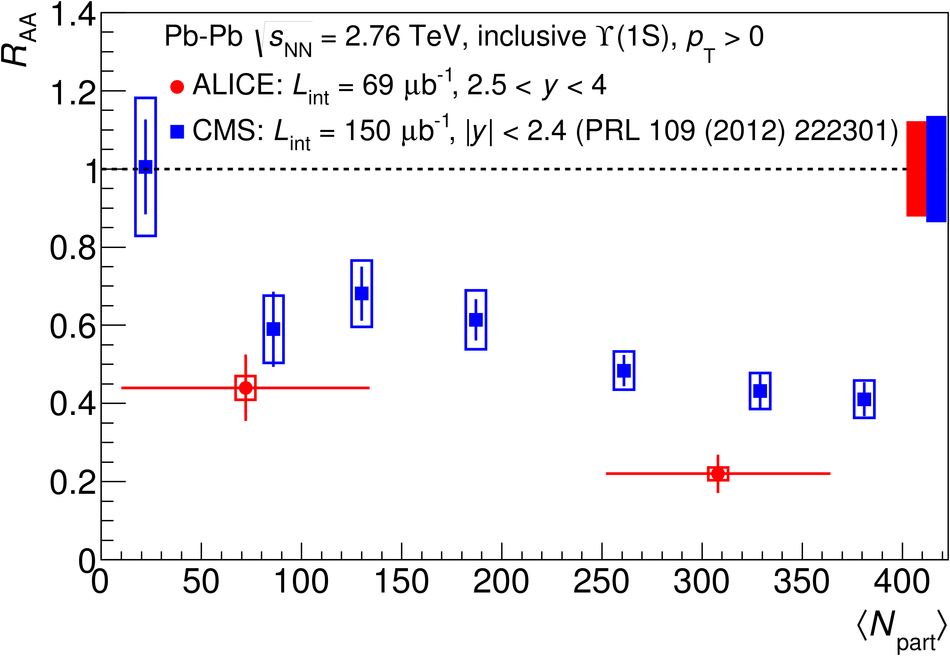 |