The inclusive production cross sections at forward rapidity of J/$\psi$, $\psi$(2S), $\Upsilon$(1S) and $\Upsilon$(2S) are measured in pp collisions at $\sqrt{s} = 7$ TeV with the ALICE detector at the LHC. The analysis is based in a data sample corresponding to an integrated luminosity of 1.35 pb$^{-1}$. Quarkonia are reconstructed in the dimuon-decay channel and the signal yields are evaluated by fitting the $\mu^+\mu^-$ invariant mass distributions. The differential production cross sections are measured as a function of the transverse momentum $p_{\rm T}$ and rapidity $y$, over the ranges $0 < p_{\rm T} < 20$ GeV/$c$ for J/$\psi$, $0 < p_{\rm T} < 12$ GeV/$c$ for all other resonances and for $2.5 < y < 4$. The measured cross sections integrated over $p_{\rm T}$ and $y$, and assuming unpolarized quarkonia, are: $\sigma_{J/\psi} = 6.69 \pm 0.04 \pm 0.63$ $\mu$b, $\sigma_{\psi^{\prime}} = 1.13 \pm 0.07 \pm 0.14$ $\mu$b, $\sigma_{\Upsilon{\rm(1S)}} = 54.2 \pm 5.0 \pm 6.7$ nb and $\sigma_{\Upsilon{\rm (2S)}} = 18.4 \pm 3.7 \pm 2.2$ nb, where the first uncertainty is statistical and the second one is systematic. The results are compared to measurements performed by other LHC experiments and to theoretical models.
Phys. Lett. B 738 (2014) 361-372
HEP Data
e-Print: arXiv:1405.4493 | PDF | inSPIRE
CERN-PH-EP-2014-103
Figure 1
Invariant mass distribution of opposite-sign dimuons with $p_{\rm T}>0$ for the different centrality and rapidity intervals considered in the analysis (see text for details). The solid blue line represents the total fit function (sum of two exponential and three extended Crystal Ball functions) and the dashed red line is the $\Upsilon$ signal component only. The green dotted line and the magenta dashed-dotted line represent the $\Upsilon$(1S) and the $\Upsilon$(2S) peaks, respectively. | 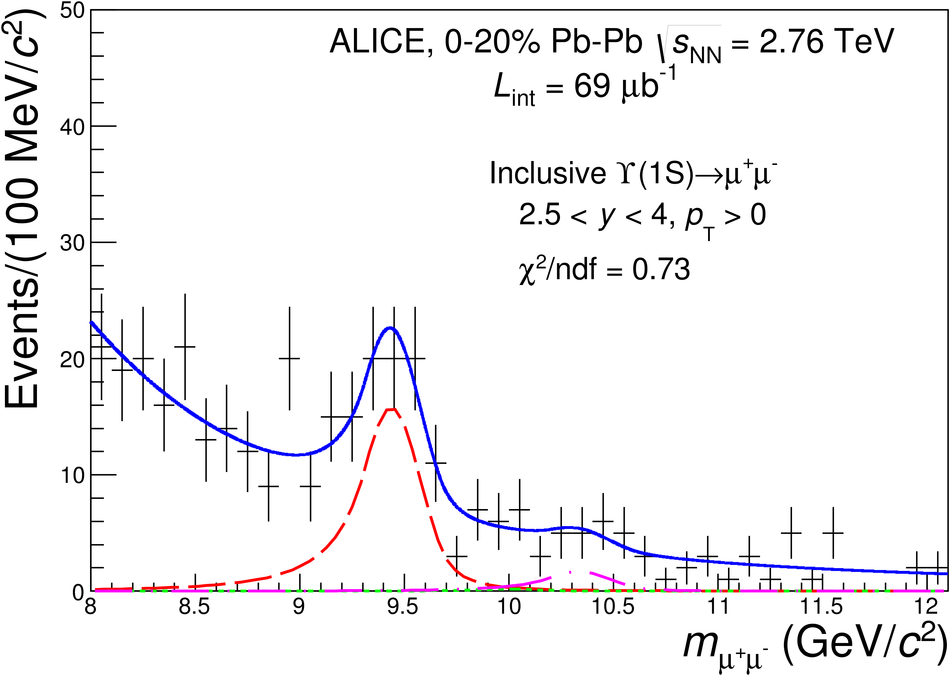 |


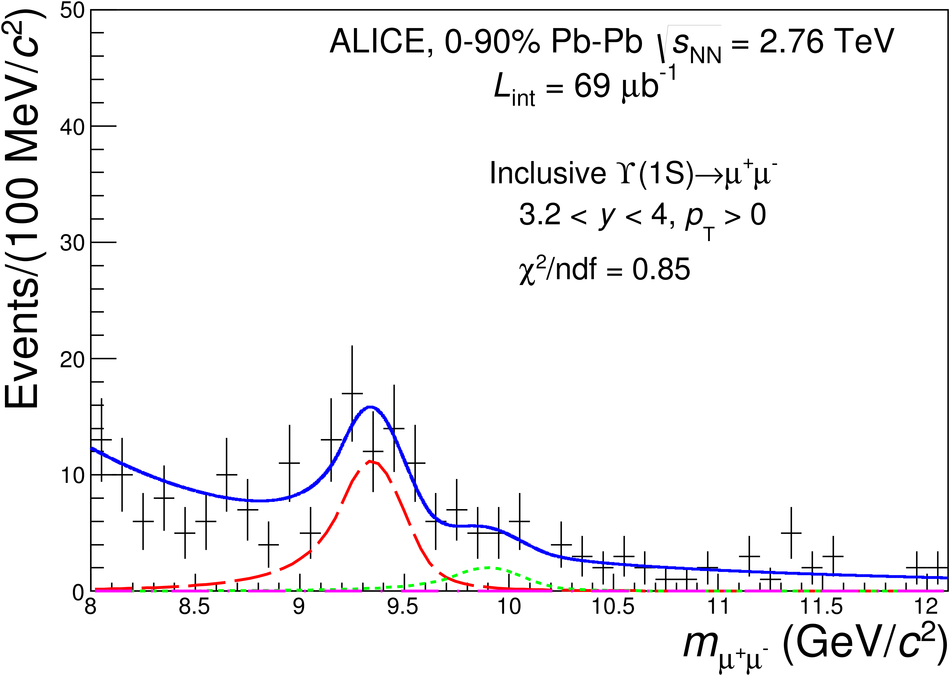
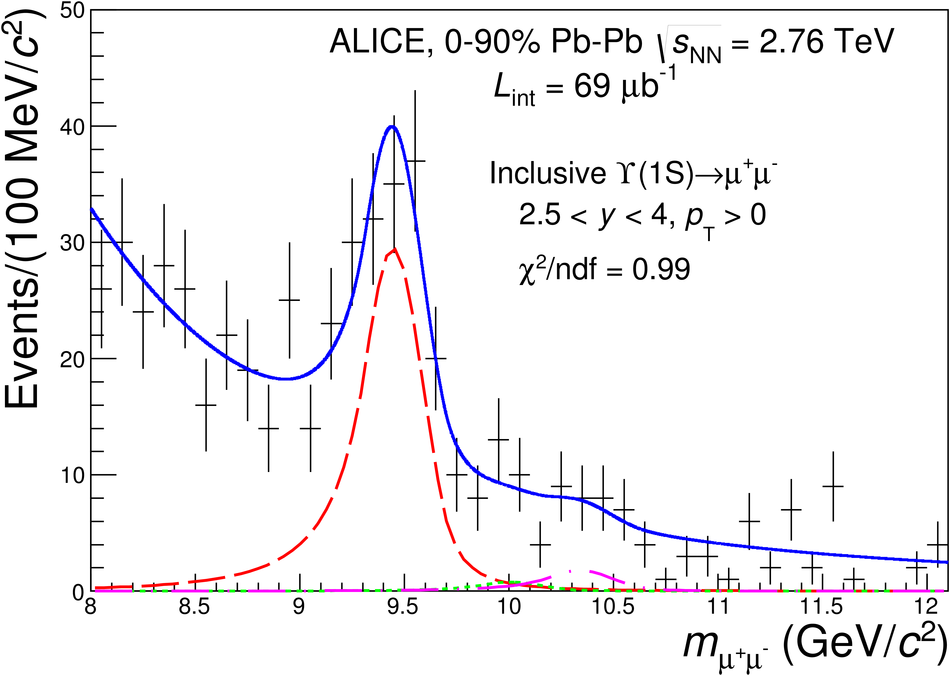
Figure 2
Inclusive $\Upsilon$ $\raa$ as a function of the average number of participant nucleons. ALICE data refer to the rapidity range $2.5< y< 4$ and are shown together with CMS data which are reported in $|y|< 2.4$. The vertical bars represent the statistical uncertainties and the boxes the point-to-point uncorrelated systematic uncertainties. The relative correlated uncertainties (12% for ALICE and 14% for CMS) are shown as a box at unity. The point-to-point horizontal error bars correspond to the RMS of the $N_{\rm part}$ distribution. | 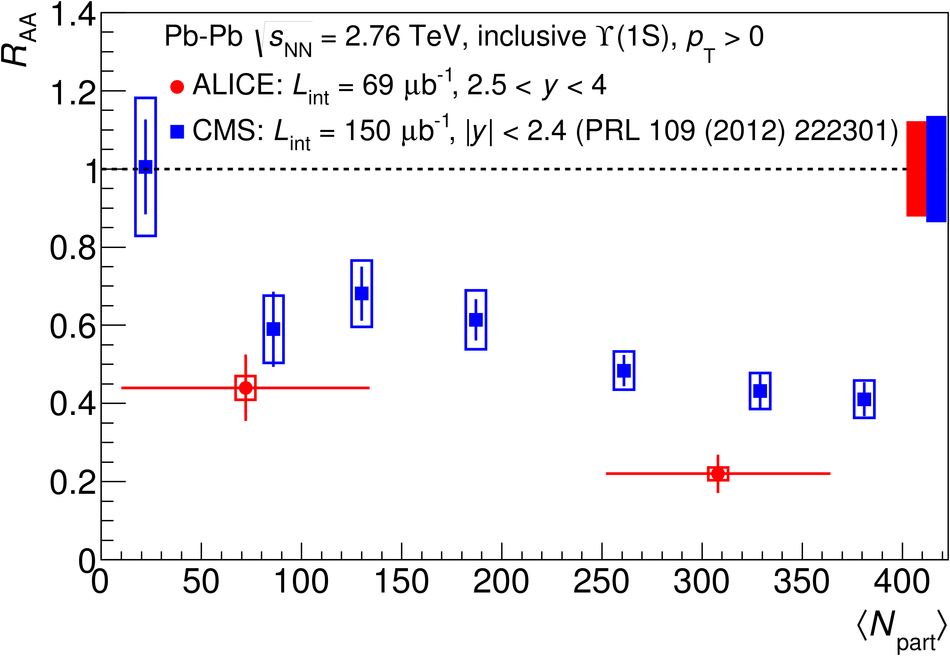 |
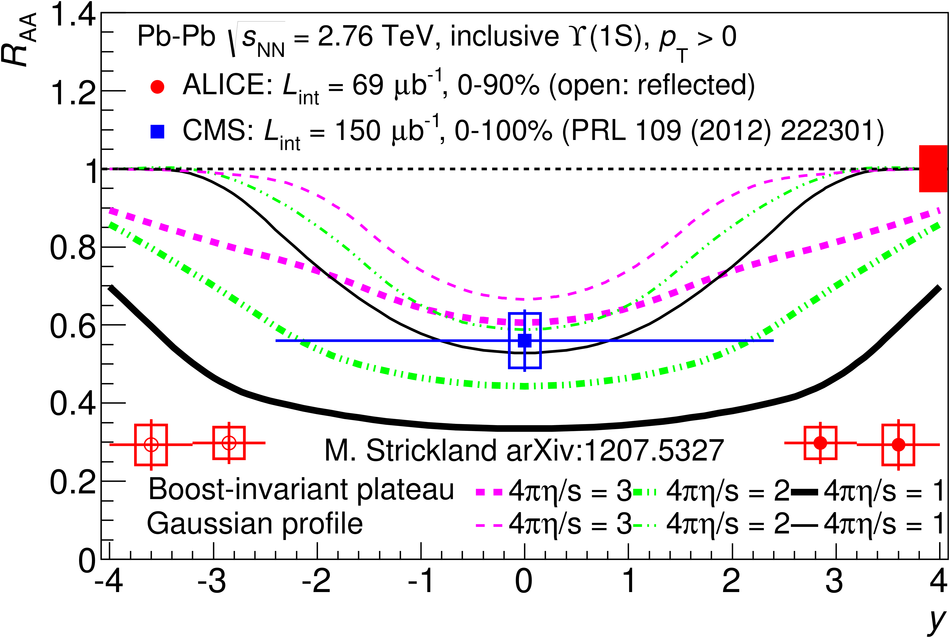
Figure 4
Inclusive $\Upsilon$ $\raa$ as a function of rapidity measured in Pb-Pb collisions at $\snn=2.76$ GeV by ALICE in $2.5< y< 4$ and CMS in $|y|< 2.4$, compared with the calculations from a transport (top) and a dynamical (bottom) model (see text for details). Open points are reflected with respect to the measured ones and the same conventions as in Fig. 2 are used to show the uncertainties. The relative correlated uncertainty on the ALICE measurement is $7\%$ (and is shown as a box at unity). | 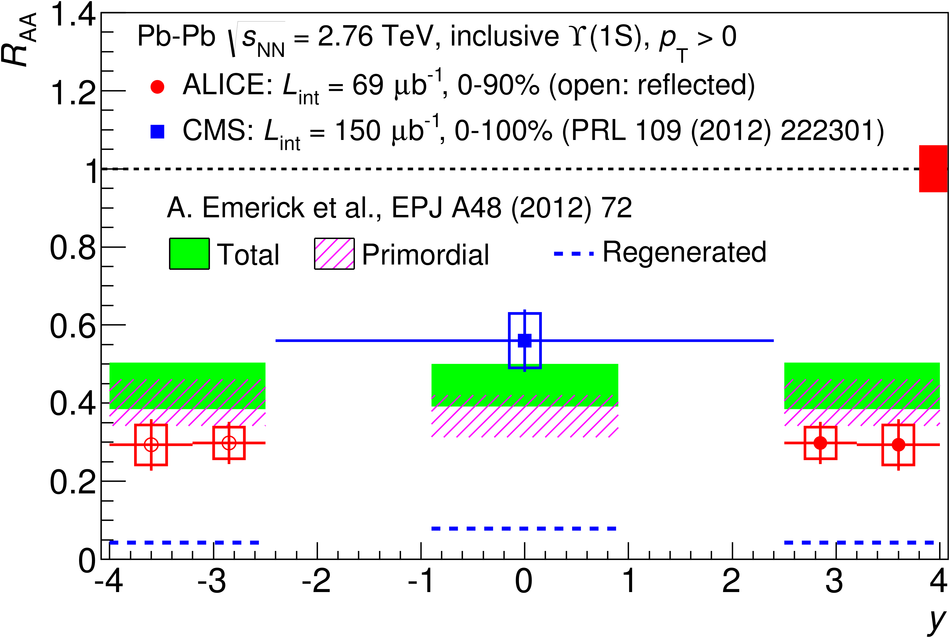 |