The experimental \pphi correlation function $C_{\mathrm{exp}}(\kstar)$ and various contributions as described in Eq. \ref{eq:tot}. Statistical (bars) and systematic uncertainties (boxes) are shown separately. The width of the dark (light) shaded bands depicts the statistical (total) uncertainty. | 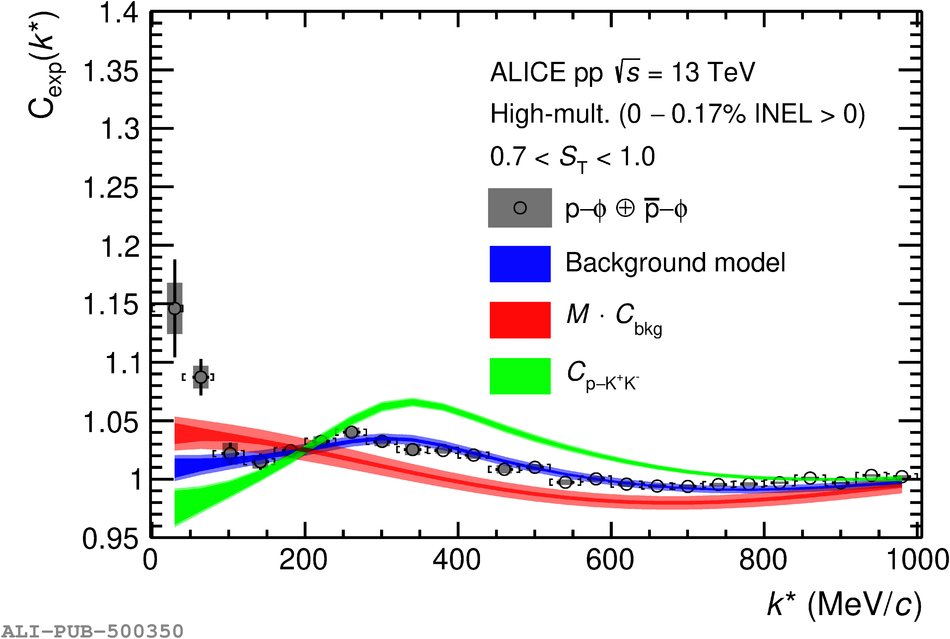 |