Measured dielectron nuclear modification factor as a function of \ptee in the low-mass region (left) and intermediate-mass region (right) at \fivenn. The data are shown in blue, with their statistical and systematic uncertainties depicted as vertical bars and boxes. The baseline expectation, calculated from the \pp and \pPb cocktails outlined in Sec. \ref{cocktail}, is shown as a black line with a gray band indicating its uncertainties. Two additional cocktails, one incorporating a modified charm production due to CNM effects and another one including thermal radiation from the hadronic and partonic phases, are shown as red and orange dashed lines, respectively. | 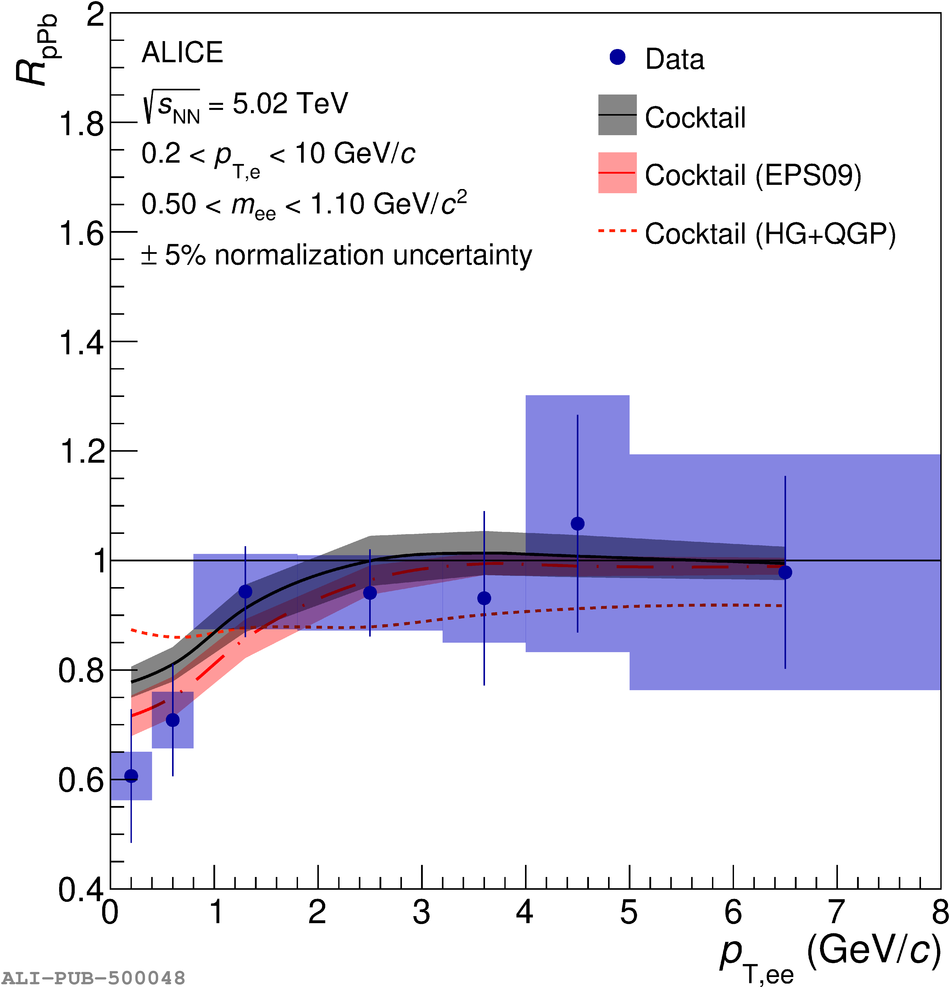 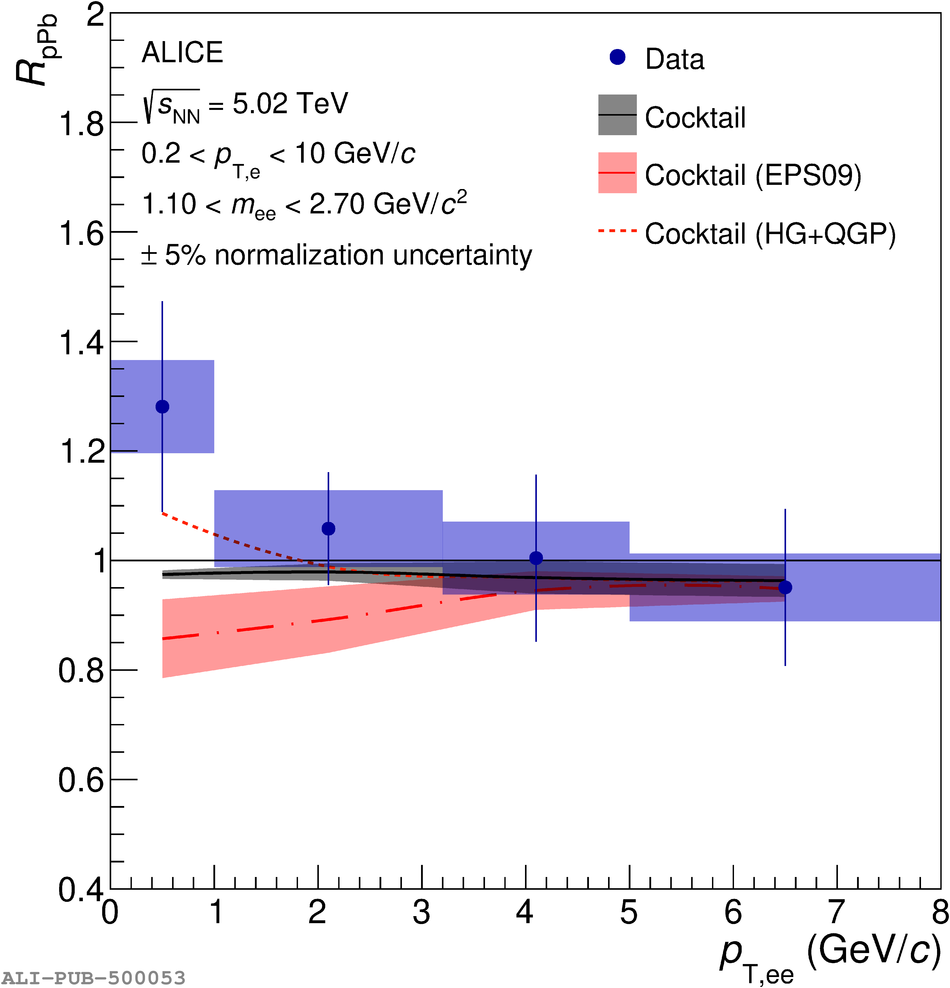 |