The first measurements of dielectron production at midrapidity ($|η_{\rm e}|<~0.8$) in proton-proton and proton-lead collisions at $\sqrt{s_{\rm{NN}}}$ = 5.02 TeV at the LHC are presented. The dielectron cross section is measured with the ALICE detector as a function of the invariant mass $m_{\rm{ee}}$ and the pair transverse momentum $p_{\rm{T,ee}}$ in the ranges $m_{\rm{ee}}$ <~ 3.5 GeV/$c^{2}$ and $p_{\rm{T,ee}}$ <~ 8.0 GeV/$c^{2}$, in both collision systems. In proton-proton collisions, the charm and beauty cross sections are determined at midrapidity from a fit to the data with two different event generators. This complements the existing dielectron measurements performed at $\sqrt{s}$ = 7 and 13 TeV. The slope of the $\sqrt{s}$ dependence of the three measurements is described by FONLL calculations. The dielectron cross section measured in proton-lead collisions is in agreement, within the current precision, with the expected dielectron production without any nuclear matter effects for $\rm{e}^{+}\rm{e}^{-}$ pairs from open heavy-flavor hadron decays. For the first time at LHC energies, the dielectron production in proton-lead and proton-proton collisions are directly compared at the same $\sqrt{s_{\rm{NN}}}$ via the dielectron nuclear modification factor $R_{\rm{pPb}}$. The measurements are compared to model calculations including cold nuclear matter effects, or additional sources of dielectrons from thermal radiation.
Phys. Rev. C102 (2020) 055204; Phys. Rev. C 111 (2025) 024905
HEP Data
e-Print: arXiv:2005.11995 | PDF | inSPIRE
CERN-EP-2020-081
Figure group
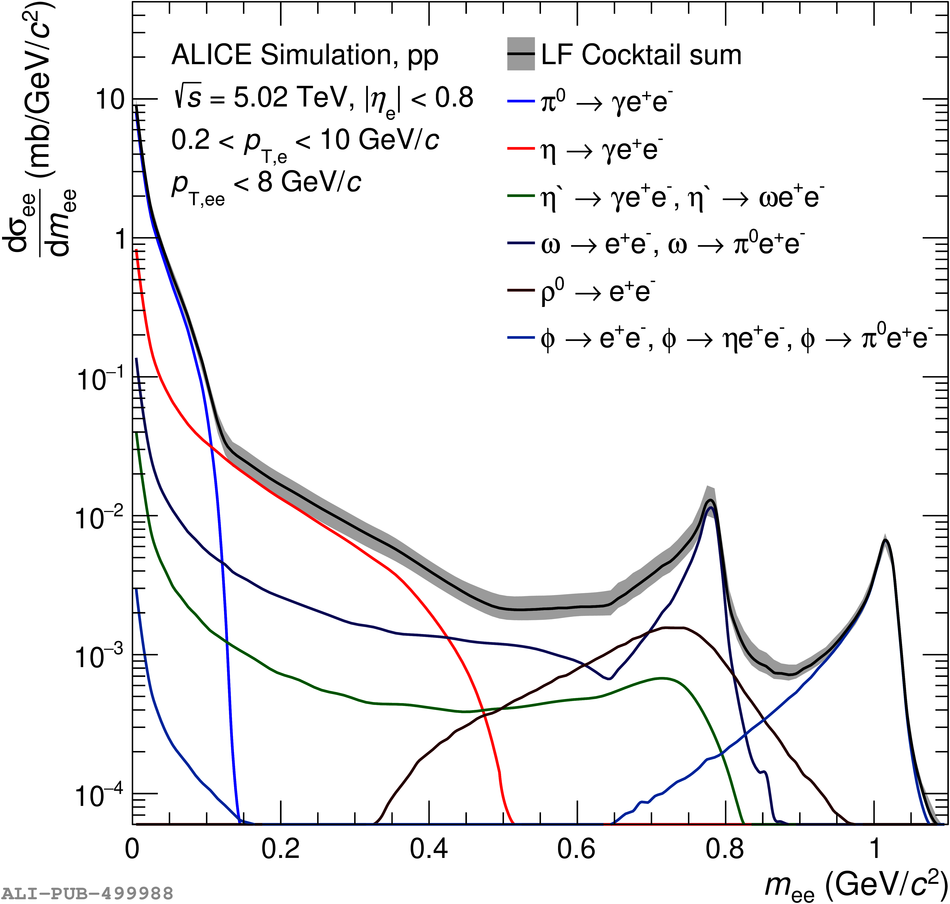
Figure 3
Projections of the heavy-flavor dielectron fits as a function of $m_{\rm ee}$ (left) and $p_{\rm T,ee}$ (right) using POWHEG (solid black line) and PYTHIA 6 (dashed gray line) as event generators. The colored lines show the charm (red) and beauty (magenta) contributions for both event generators after the fit. |  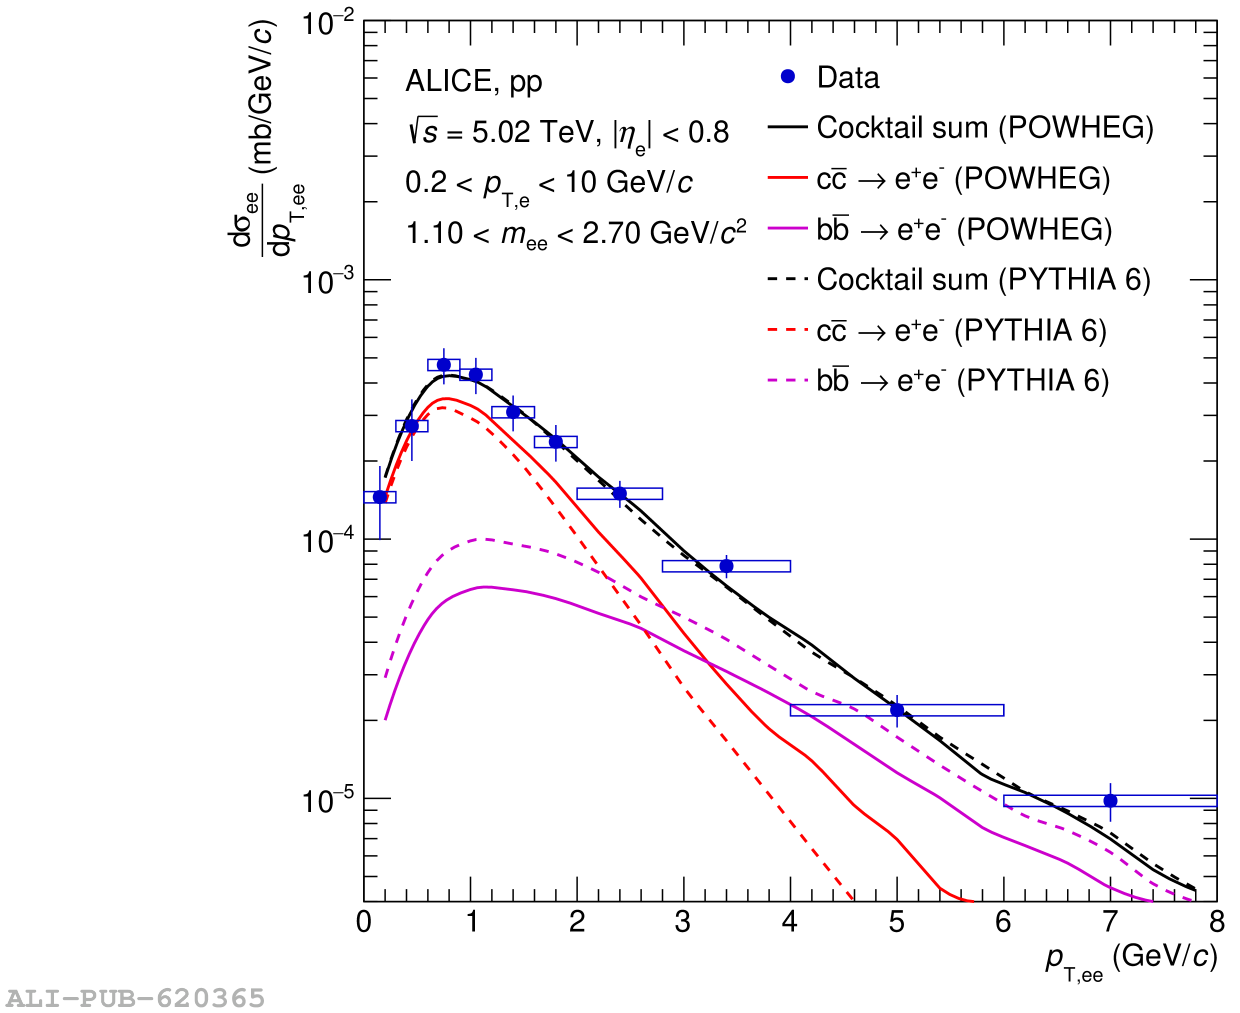 |
Figure 4
Cross sections at midrapidity for c$\overline{\textrm{c}}$ (left) and b$\overline{\textrm{b}}$ (right) as a function of $\sqrt{s}$ in pp collisions. The colored markers represent the measured midrapidity cross sections at $\sqrt{s} =$ 5.02, 7, and 13 TeV which are derived using either PYTHIA 6 (blue circles) or POWHEG (red squares) simulations. The systematic and statistical uncertainty of the data points are summed in quadrature and represented by vertical bars. The measurements are compared with FONLL calculations (black solid line), with model uncertainties (dashed lines), and to single heavy-flavor hadron measurements (open markers). The charm cross sections and corresponding uncertainties were updated in the recent submission. For details see Appendix. A. In addition to updating the \ccbar cross sections, recent measurements based on fully-reconstructed charm hadrons were included in the figure as well as calculations at next-to-next-to-leading-order (NNLO) calculations (magenta). | 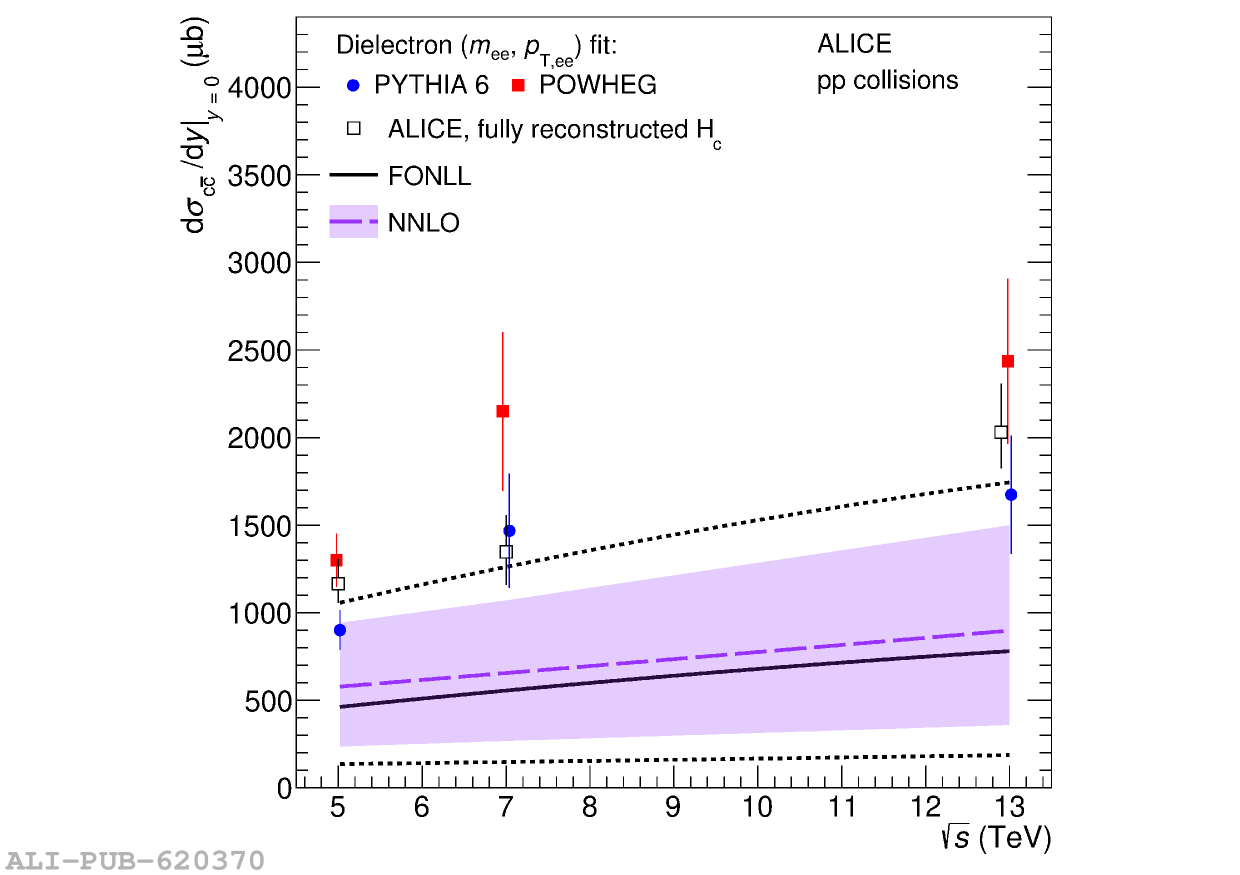 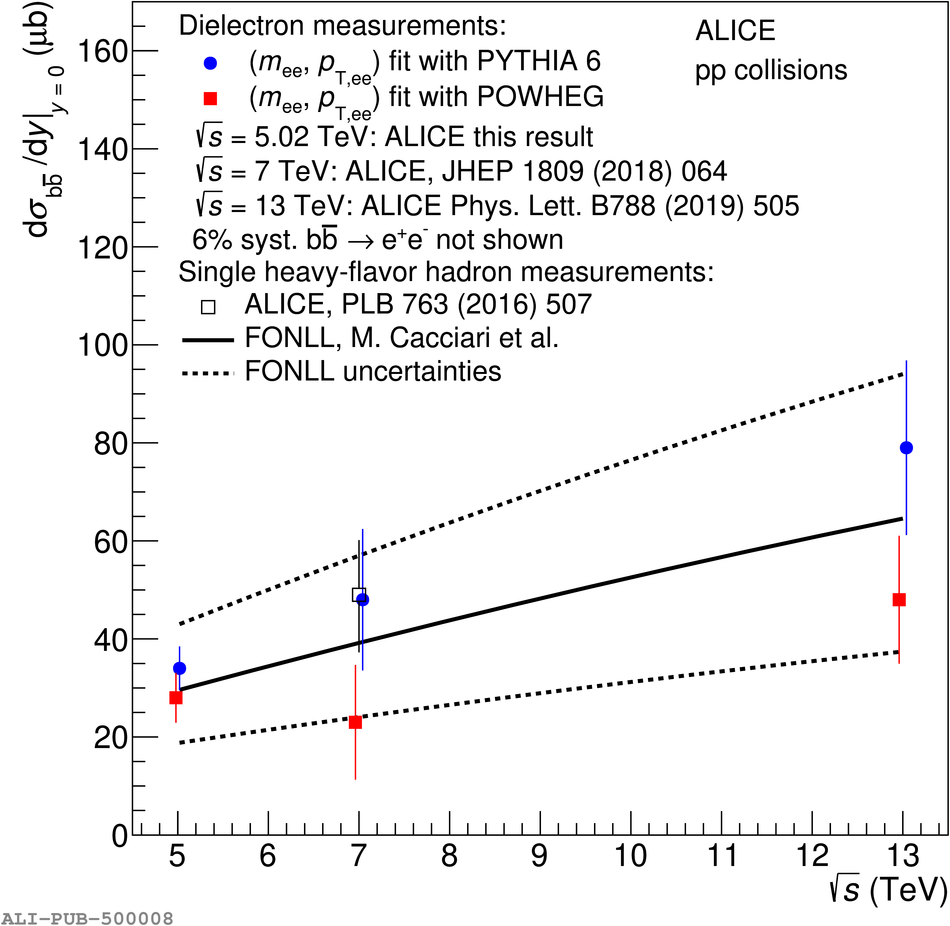 |
Figure 5
Differential ee cross section as a function of $m_{\rm ee}$ measured in pp (left) and p$-$Pb (right) collisions at $\sqrt{s_{\rm{NN}}}$ = 5.02 TeV The data are compared to the hadronic cocktail, where the heavy-flavor contributions are fitted to the pp spectrum in the intermediate-mass region, and for p$-$Pb collisions scaled with the atomic mass number of the Pb nucleus $A$ = 208. The gray band represents the total uncertainty on the hadronic cocktail. |  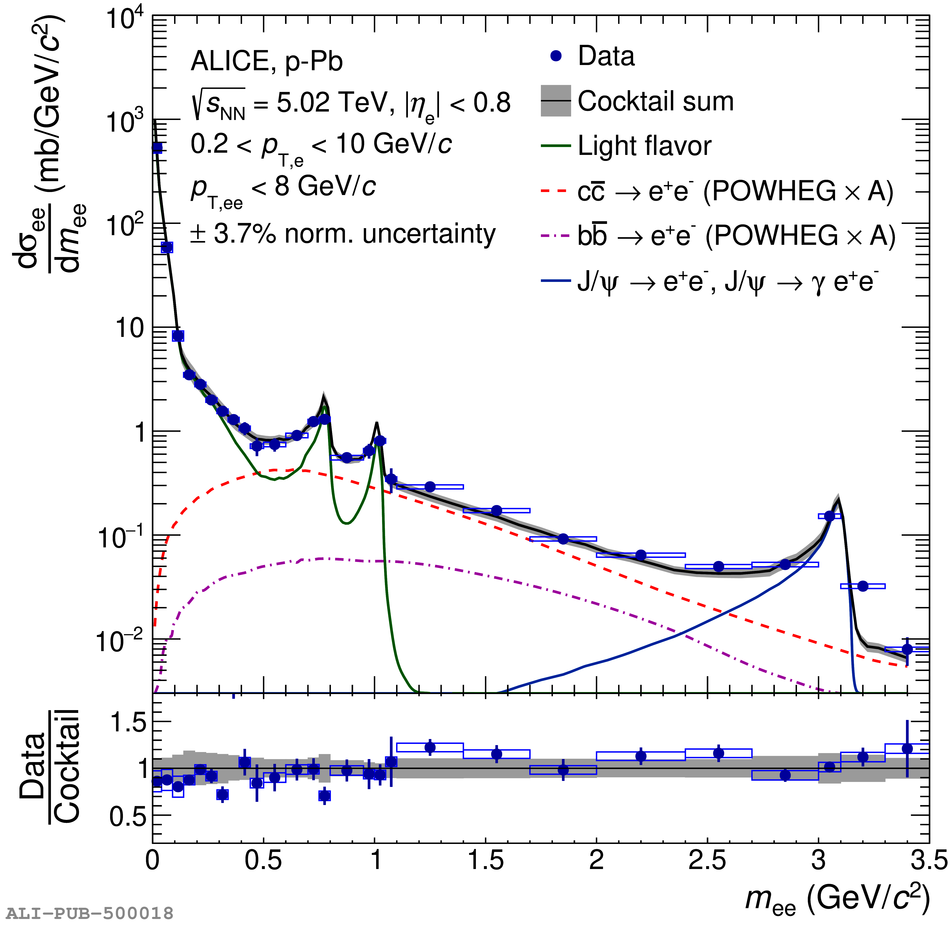 |
Figure 6
Differential ee cross section as a function of $p_{\rm T,ee}$ in the low-mass region measured in pp (left) and p$-$Pb (right) collisions at $\sqrt{s_{\rm{NN}}}$ = 5.02 TeV. The data are compared to the hadronic cocktail, where the heavy-flavor contributions are fitted to the pp spectrum in the intermediate-mass region, and for p$-$Pb collisions scaled with the atomic mass number of the Pb nucleus $A$ = 208. The gray band represents the total uncertainty on the hadronic cocktail. | 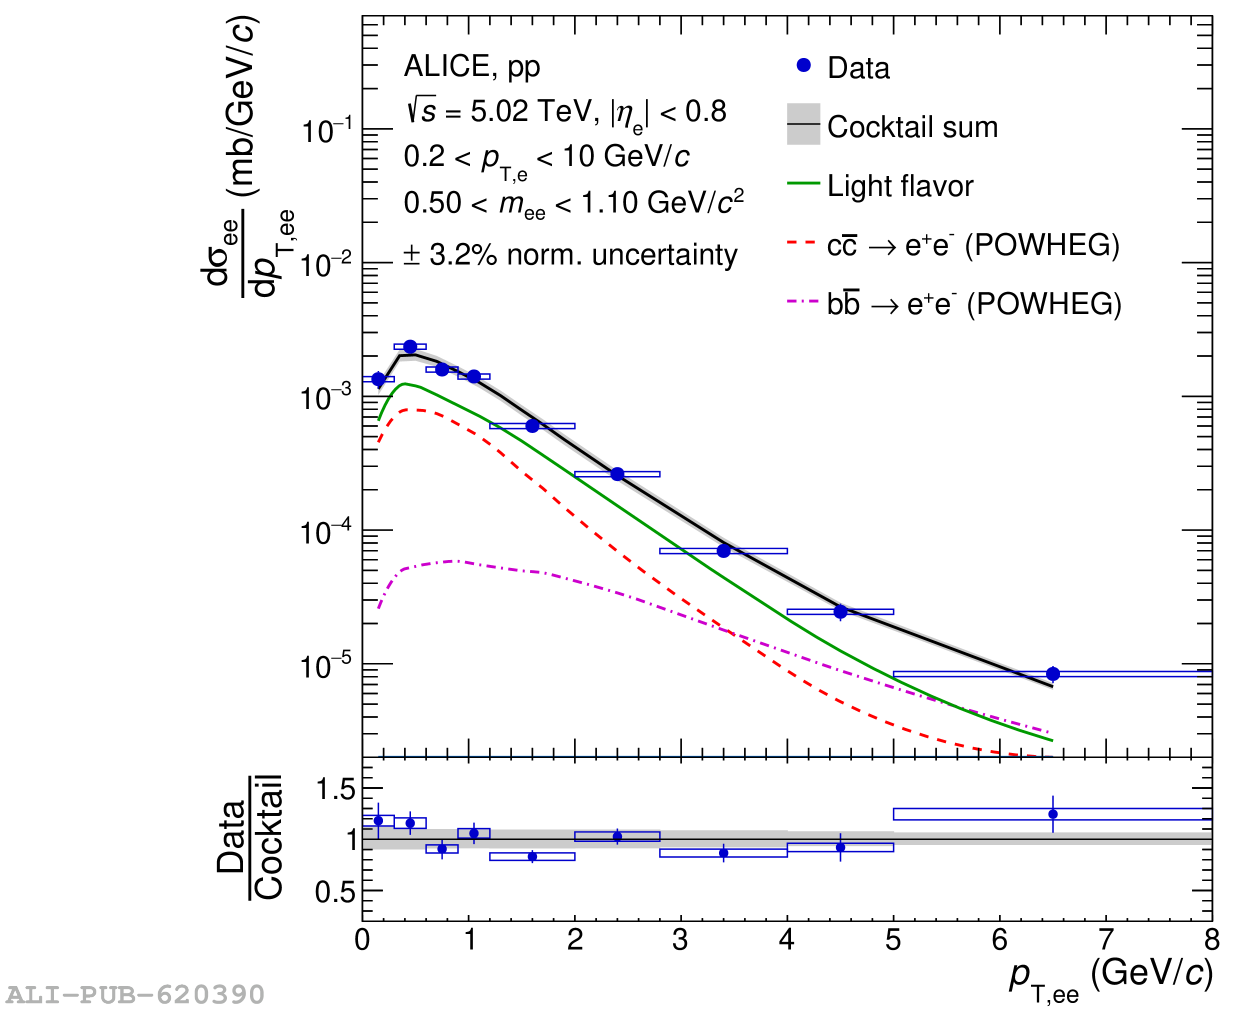 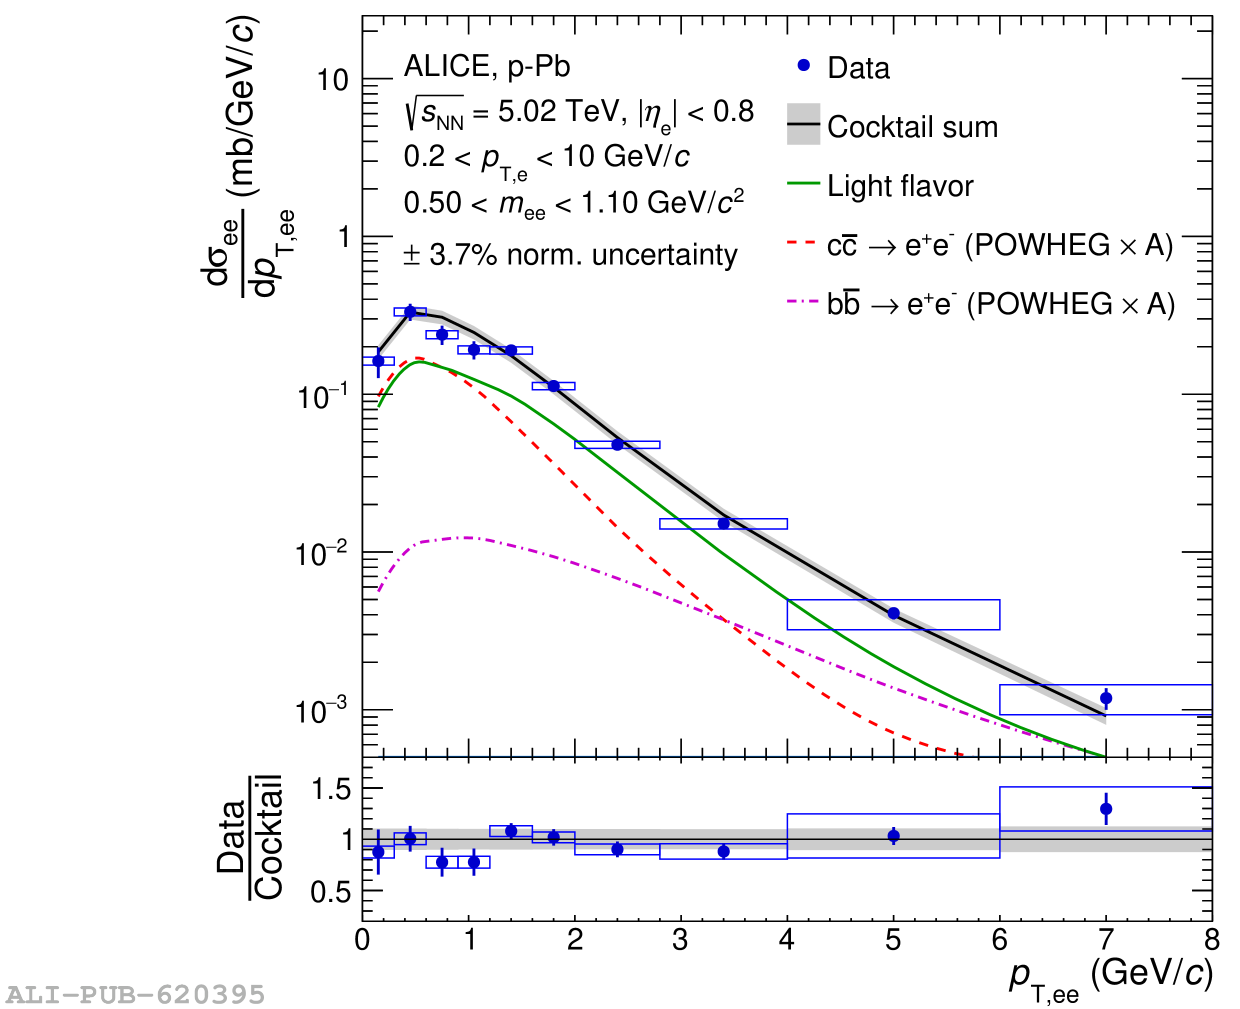 |
Figure 7
Differential ee cross section as a function of $_{\rm T,ee}$ in the intermediate-mass region measured in pp (left) and p$-$Pb (right) collisions at $\sqrt{s_{\rm{NN}}}$ = 5.02 TeV. The data are compared to the hadronic cocktail, where the heavy-flavor contributions are fitted to the pp spectrum in the intermediate-mass region, and for p$-$Pb collisions scaled with the atomic mass number of the Pb nucleus $A$ = 208. The gray band represents the total uncertainty on the hadronic cocktail. | 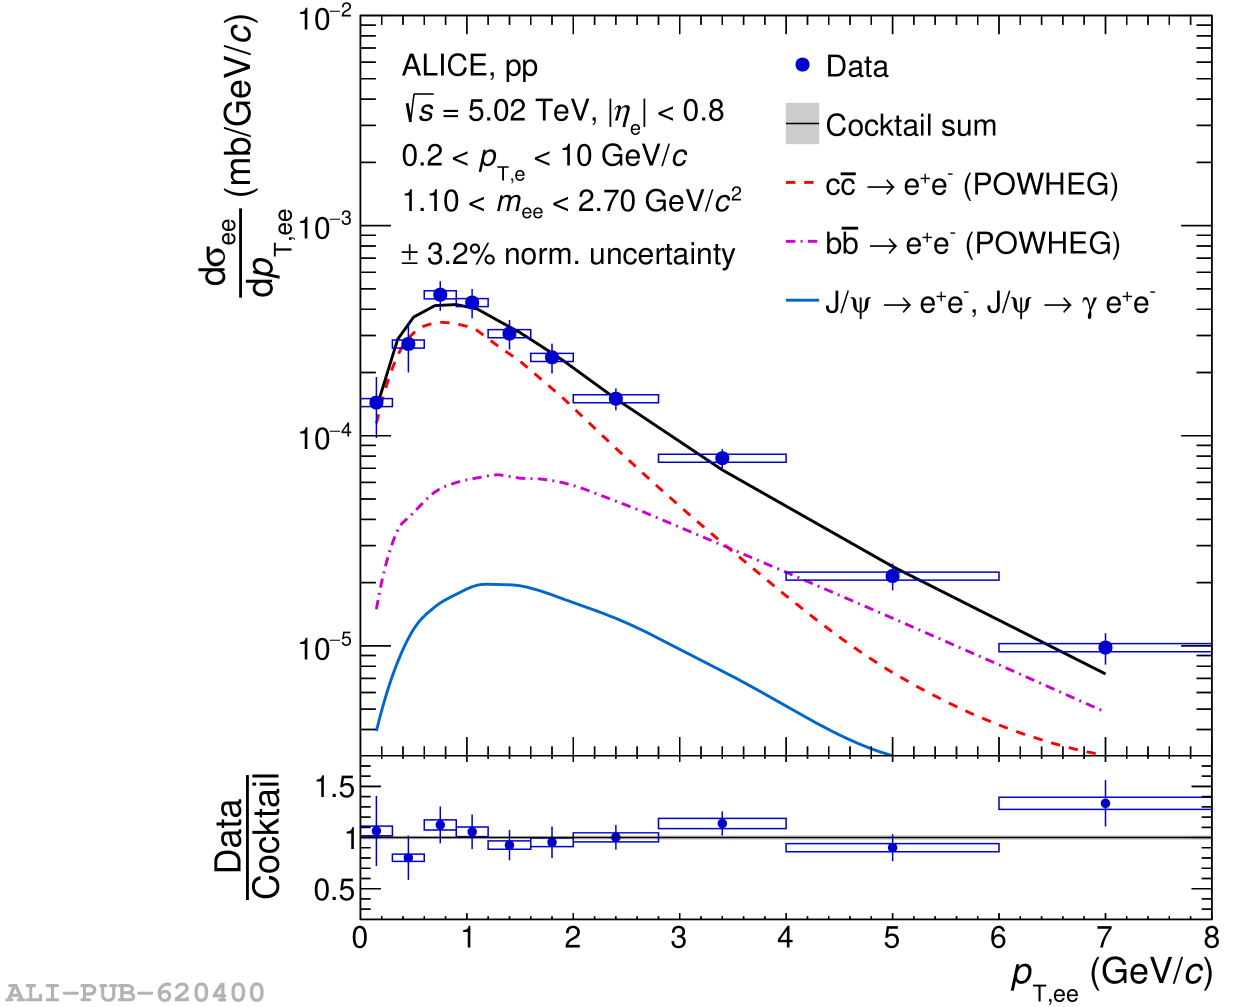 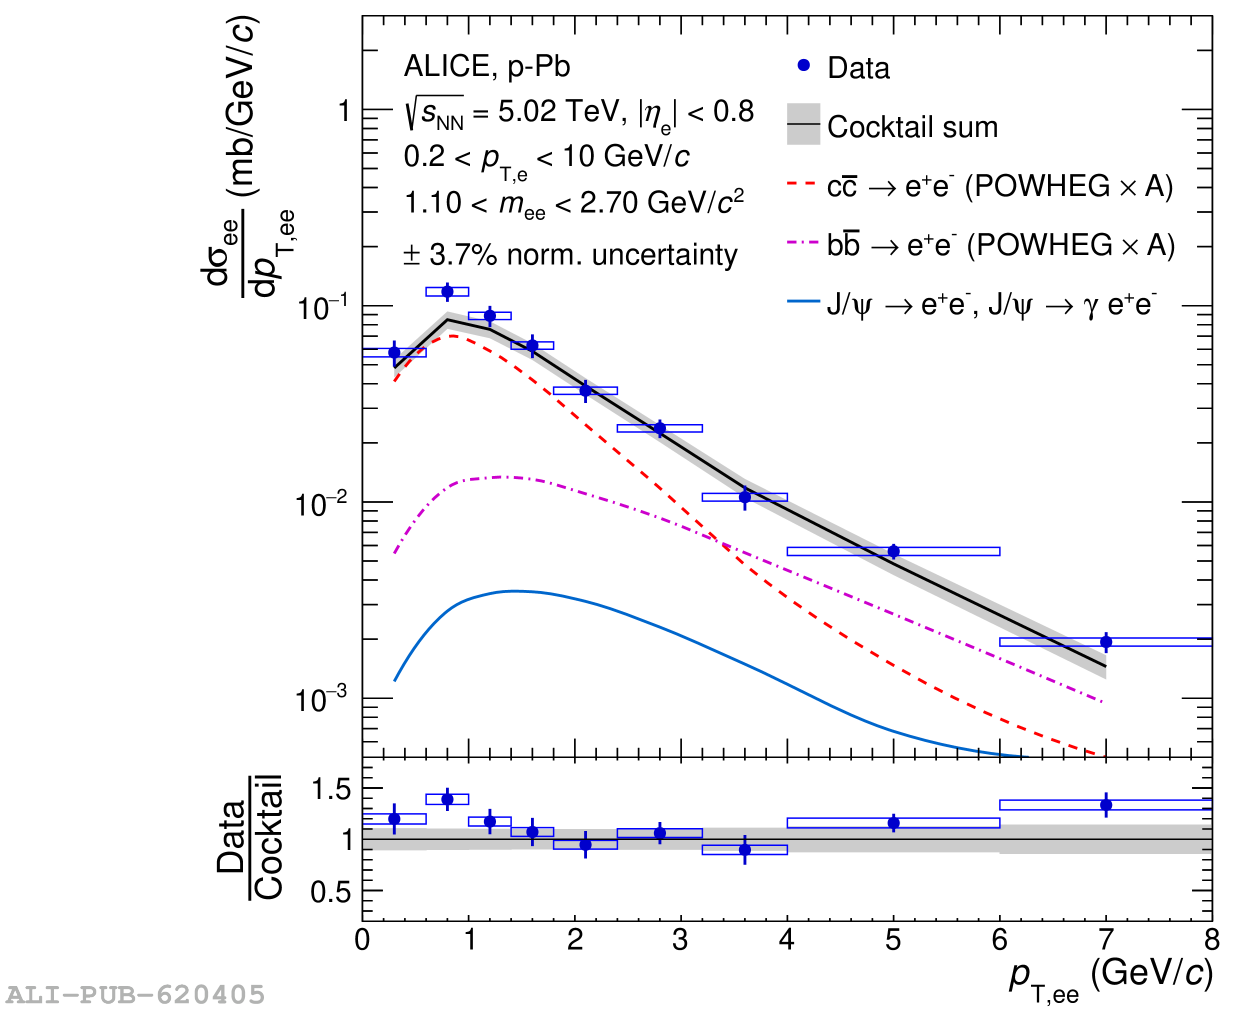 |
Figure 8
Measured dielectron nuclear modification factor as a function of $m_{\rm ee}$ at $\sqrt{s_{\rm{NN}}}$ = 5.02 TeV. The data are shown in blue, with their statistical and systematic uncertainties depicted as vertical bars and boxes. The baseline expectation, calculated from the pp and p$-$Pb cocktails outlined in Sec.4, is shown as a black line with a gray band indicating its uncertainties. Two additional cocktails, one incorporating a modified charm production due to CNM effects and another one including thermal radiation from the hadronic and partonic phases, are shown as red and orange dashed lines, respectively. |  |
Figure 9
Measured dielectron nuclear modification factor as a function of $p_{\rm T,ee}$ in the low-mass region (left) and intermediate-mass region (right) at $\sqrt{s_{\rm{NN}}}$ = 5.02 TeV. The data are shown in blue, with their statistical and systematic uncertainties depicted as vertical bars and boxes. The baseline expectation, calculated from the pp and p$-$Pb cocktails outlined in Sec.4, is shown as a black line with a gray band indicating its uncertainties. Two additional cocktails, one incorporating a modified charm production due to CNM effects and another one including thermal radiation from the hadronic and partonic phases, are shown as red and orange dashed lines, respectively. | 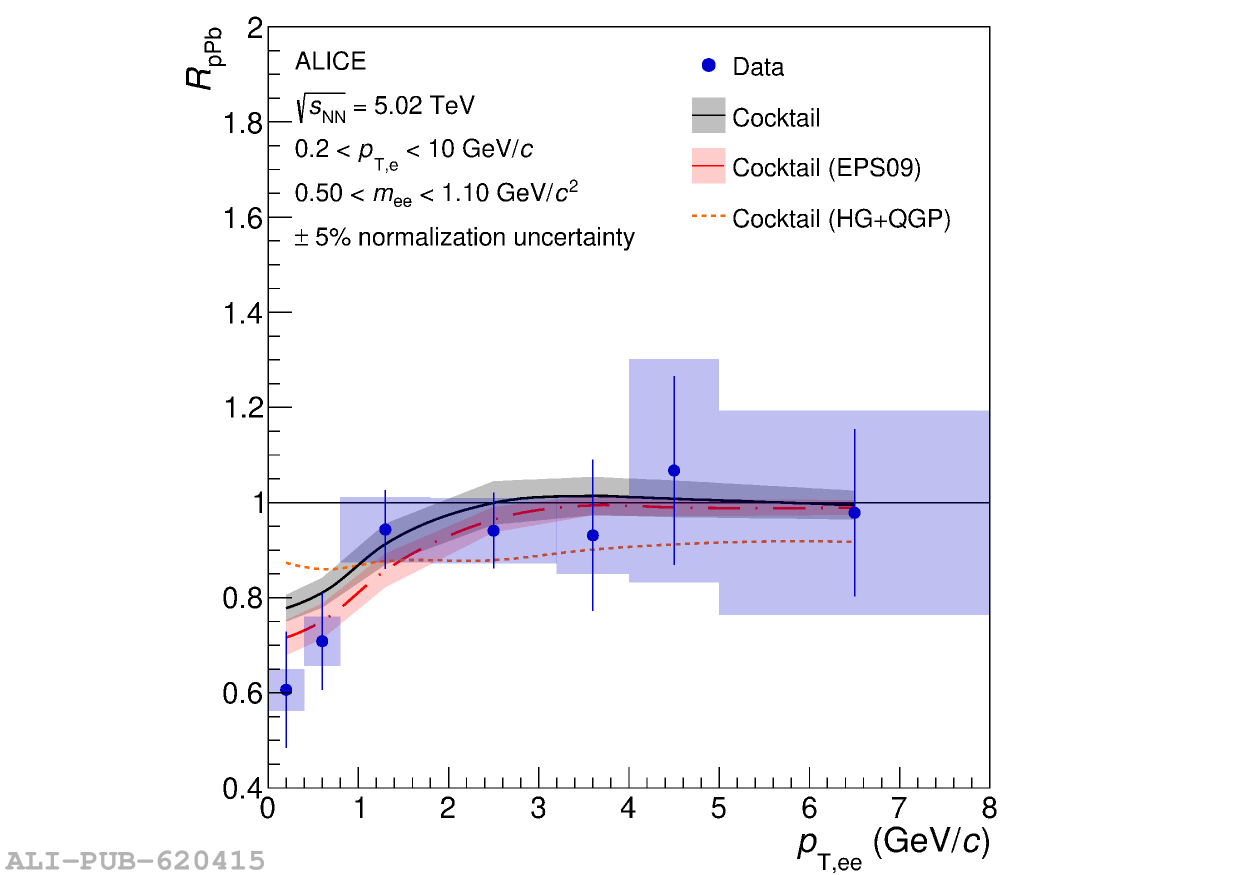 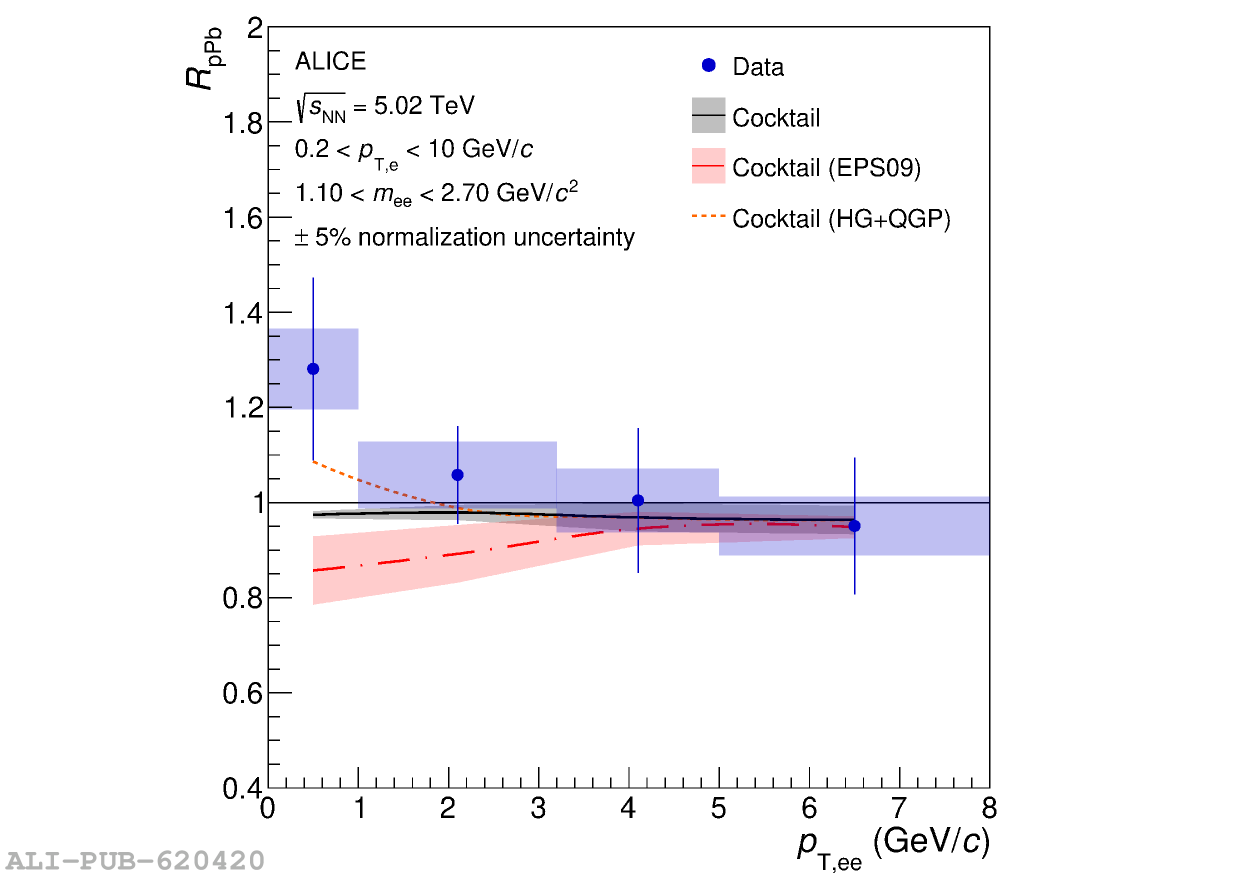 |