\lambdasquare distribution of isolated clusters (black) and template fit results for \pPb data in various \pt ranges. The stacked histograms (yellow for background, blue for signal) show the predicted counts corresponding to the best fit. The bottom panels show the normalized residuals of the fit, with the statistical uncertainty on the isolated cluster data and the background template added in quadrature. The gray shaded region indicates the signal region for the isolated-photon selection. See text for additional details. | 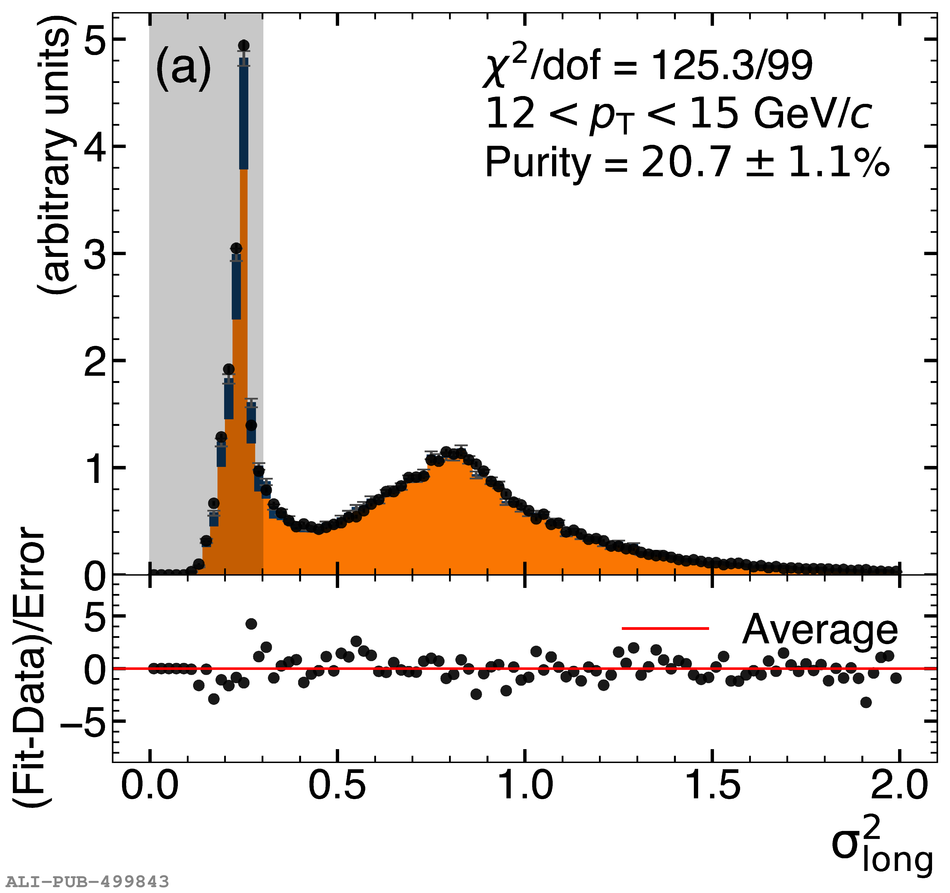 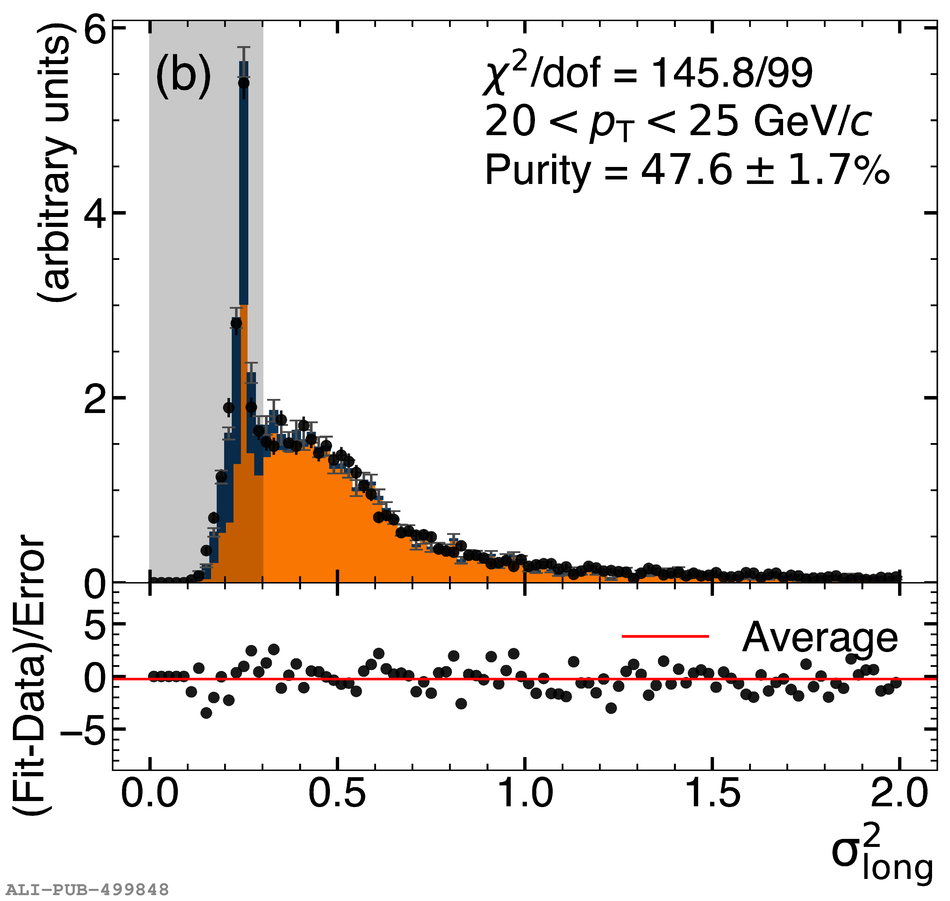  |