This paper presents isolated photon-hadron correlations using pp and p-Pb data collected by the ALICE detector at the LHC. For photons with |$\eta$| <~ 0.67 and 12 <~ $p_{\rm{T}}$ <~ 40 GeV/$c$, the associated yield of charged particles in the range |$\eta$| <~ 0.80 and 0.5 <~ $p_{\rm{T}}$ <~ 10 GeV/$c$ is presented. These momenta are much lower than previous measurements at the LHC. No significant difference between pp and p-Pb is observed, with PYTHIA 8.2 describing both data sets within uncertainties. This measurement constrains nuclear effects on the parton fragmentation in p-Pb collisions, and provides a benchmark for future studies of Pb-Pb collisions.
Phys Rev C 102 (2020) 044908
HEP Data
e-Print: arXiv:2005.14637 | PDF | inSPIRE
CERN-EP-2020-097
Figure group
Figure 1
\lambdasquare distribution of isolated clusters (black) and template fit results for \pPb data in various \pt ranges. The stacked histograms (yellow for background, blue for signal) show the predicted counts corresponding to the best fit. The bottom panels show the normalized residuals of the fit, with the statistical uncertainty on the isolated cluster data and the background template added in quadrature. The gray shaded region indicates the signal region for the isolated-photon selection. See text for additional details. | 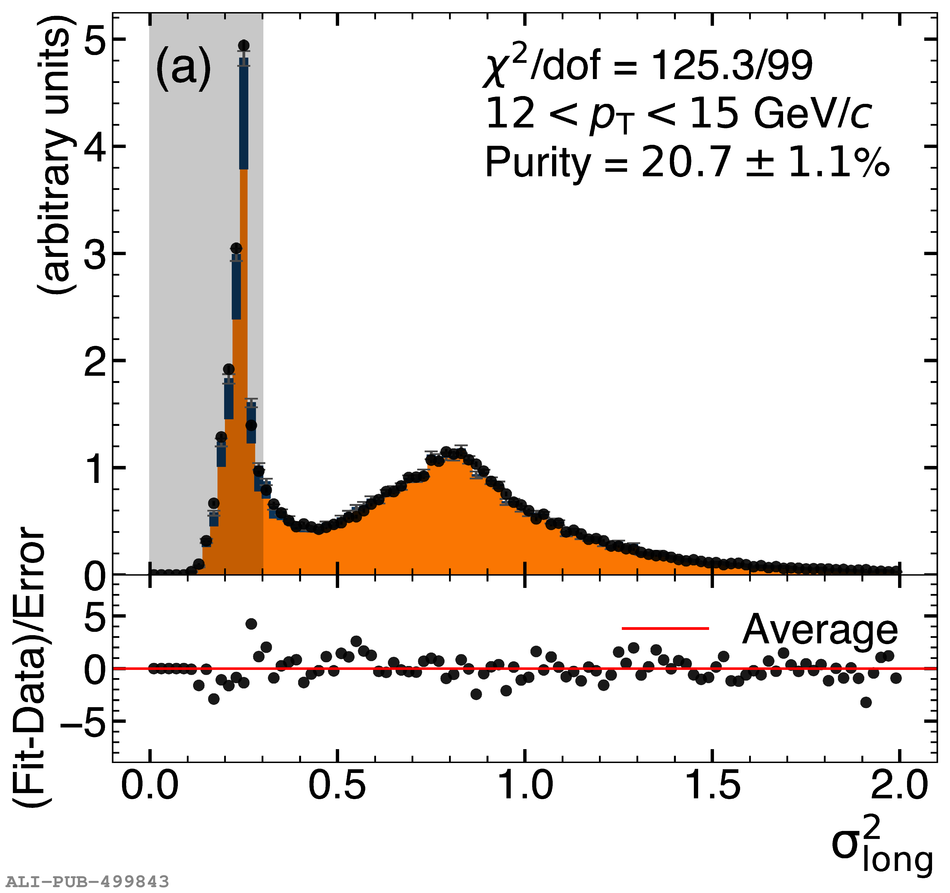 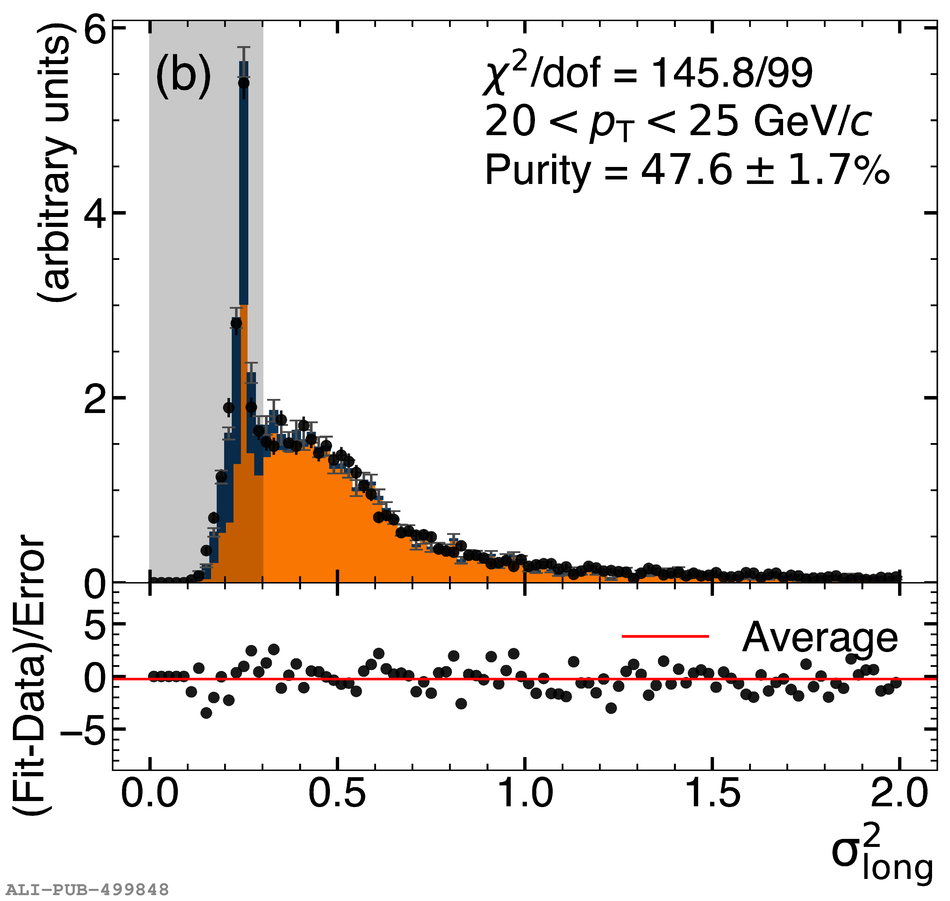  |
Figure 2
Purity of the $\gammaiso$ sample as a function of transverse momentum for pp (red) and \pPb (blue) data. The error bars represent statistical uncertainties only. The red shaded area represents systematic uncertainties in pp, while the blue empty boxes represent systematic uncertainties in \pPb. The smooth lines correspond to a three-parameter error function fit to the data. |  |
Figure 3
$\gammaiso$--hadron signal region (black circles) and background region (grey squares) correlations in pp collisions at \sqrts = 5.02 TeV as measured by the ALICE detector. The shower signal region photons correspond to isolated clusters with \lambdasquare $ 0.4$. The vertical bars represent statistical uncertainty only. The horizontal bars represent the bin width in $|\Delta\varphi|$. The background correlation is subtracted from the signal correlation according to the numerator in Eq. \ref{Corr_Subtraction}. | 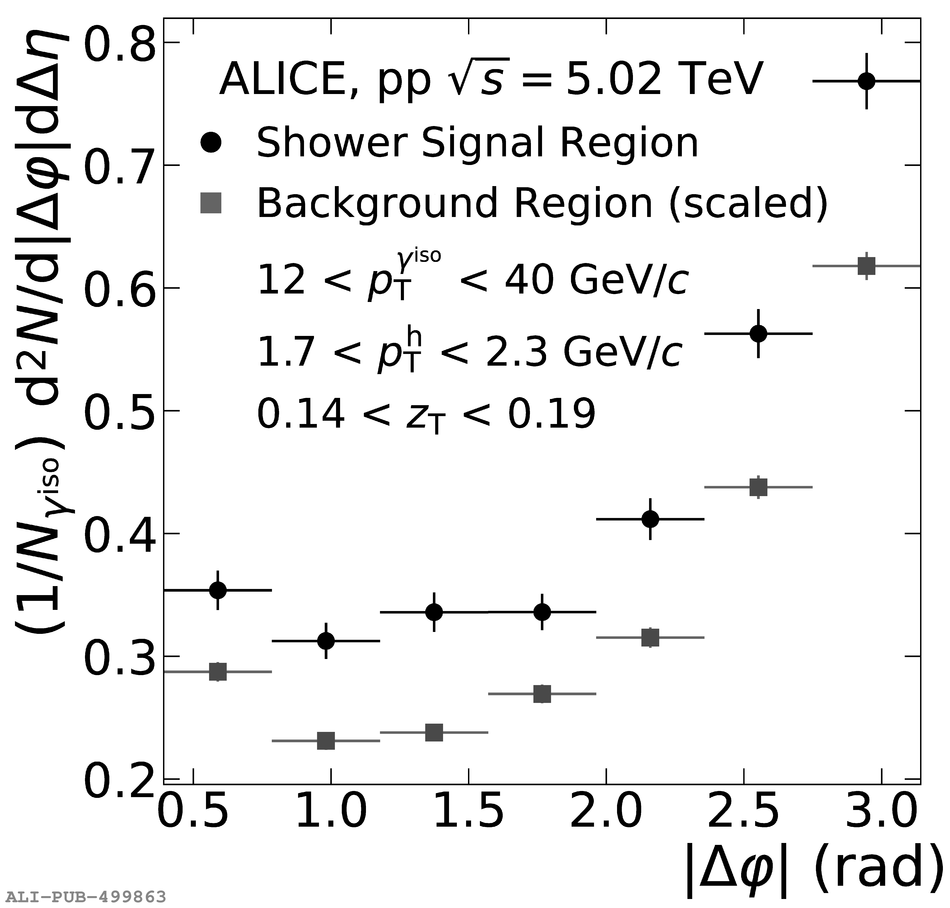 |
Figure 4
$\gammaiso$--hadron correlation functions for pp (red) and \pPb (blue) data at $\sqrt{s_\mathrm{NN}}$ = 5.02 TeV as measured by the ALICE detector. The different panels represent three different \zt bins. The correlation functions are projected over the range $|\Delta\eta| |   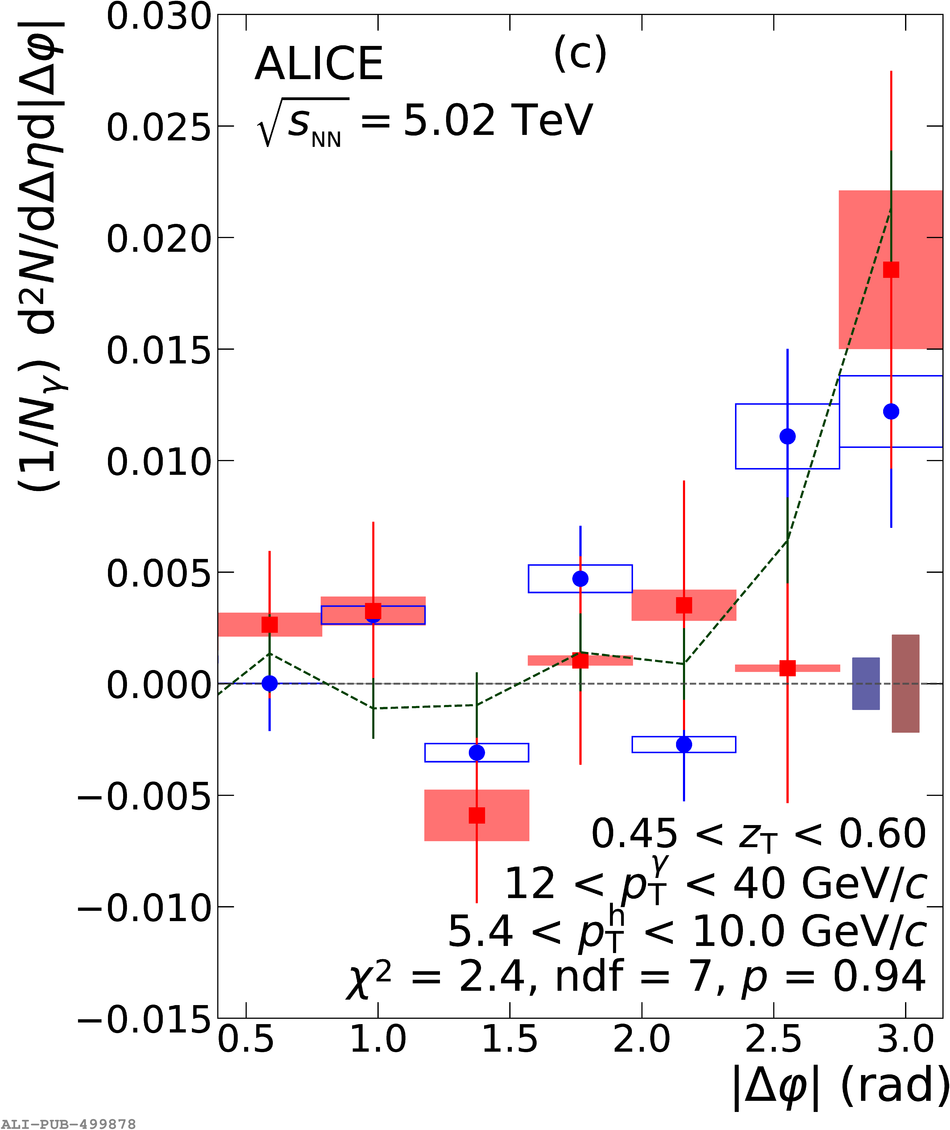 |
Figure 5
$\gammaiso$-tagged fragmentation function for pp (red) and \pPb data (blue) at $\sqrt{s_\mathrm{NN}}$ = 5.02 TeV as measured by the ALICE detector. The boxes represent the systematic uncertainties while the vertical bars indicate the statistical uncertainties. The dashed green line corresponds to \textsc{PYTHIA 8.2}. The $\chi^2$ test for the comparison of pp and \pPb data incorporates correlations among different \zt intervals. A constant that was fit to the ratio including statistical and systematic uncertainties is shown as grey band, with the width indicating the uncertainty on the fit. | 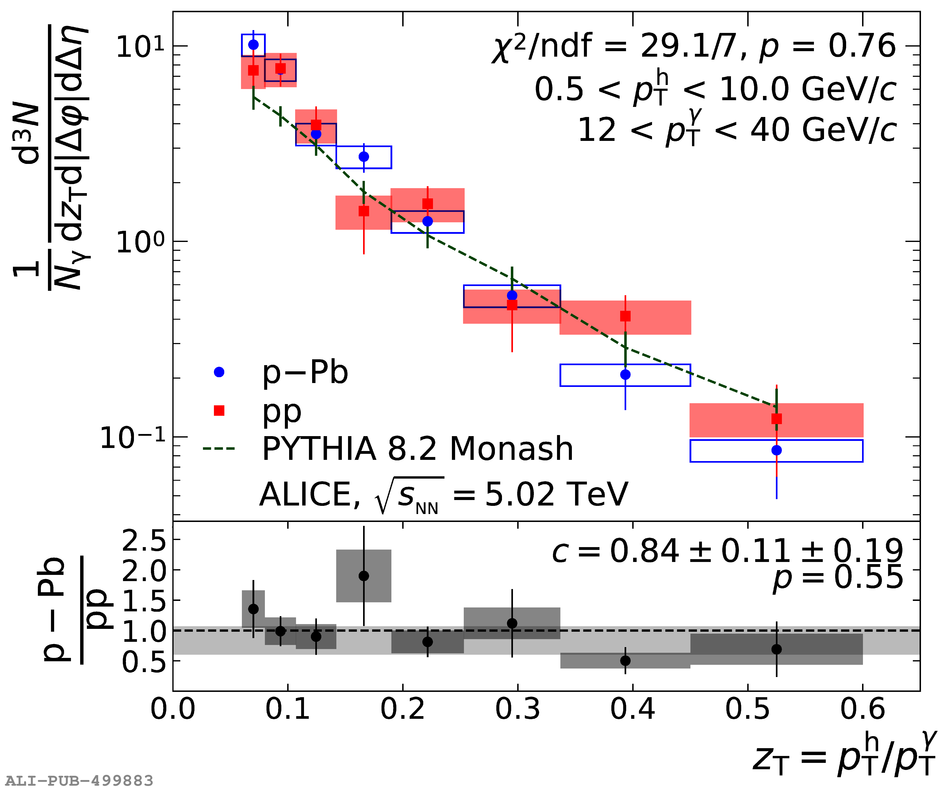 |