Ratio of the \vtwo\ of deuterons measured in \PbPb collisions at \snn = 5.02 TeV to that measured at \snn = 2.76 TeV (red circles) compared with the same ratio obtained for protons (blue squares) for two centrality intervals (10--20\% on the left panel and 40--50\% on the right panel). For a direct comparison of protons and deuterons, the measured \vtwo\ and \pt\ have were divided by $A$. Vertical bars and boxes represent the statistical and systematic uncertainties, respectively. | 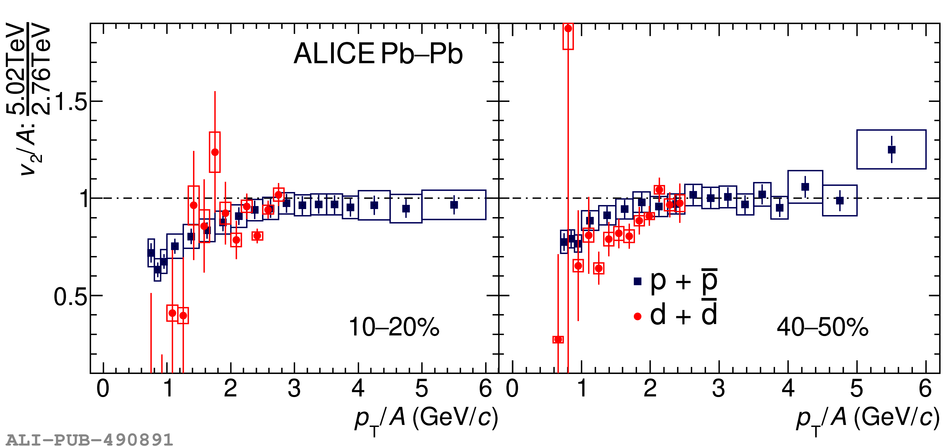 |