The measurements of the (anti)deuterons elliptic flow ($v_2$) and the first measurements of triangular flow ($v_3$) in Pb-Pb collisions at a center-of-mass energy per nucleon-nucleon collisions $\sqrt{s_{\mathrm{NN}}}$ = 5.02 TeV are presented. A mass ordering at low transverse momentum ($p_{\rm T}$) is observed when comparing these measurements with those of other identified hadrons, as expected from relativistic hydrodynamics. The measured (anti)deuterons $v_2$ lies between the predictions from the simple coalescence and blast-wave models, which provide a good description of the data only for more peripheral and for more central collisions, respectively. The mass number scaling, which is violated for $v_2$, is approximately valid for the (anti)deuterons $v_3$. The measured $v_2$ and $v_3$ are also compared with the predictions from a coalescence approach with phase-space distributions of nucleons generated by iEBE-VISHNU with AMPT initial conditions coupled with UrQMD, and from a dynamical model based on relativistic hydrodynamics coupled to the hadronic afterburner SMASH. The model predictions are consistent with the data within the uncertainties in mid-central collisions, while a deviation is observed in central centrality intervals.
Phys. Rev. C 102 (2020) 055203
HEP Data
e-Print: arXiv:2005.14639 | PDF | inSPIRE
CERN-EP-2020-099
Figure group

Figure 2
Elliptic (\vtwo, left) and triangular (\vthree, right) flow of \mbox{deuterons} as a function of \pt for different centrality intervals measured in \PbPb collisions at \snn = 5.02 TeV. The horizontal line at zero is to guide the eye. Vertical bars and boxes represent the statistical and systematic uncertainties, respectively. | 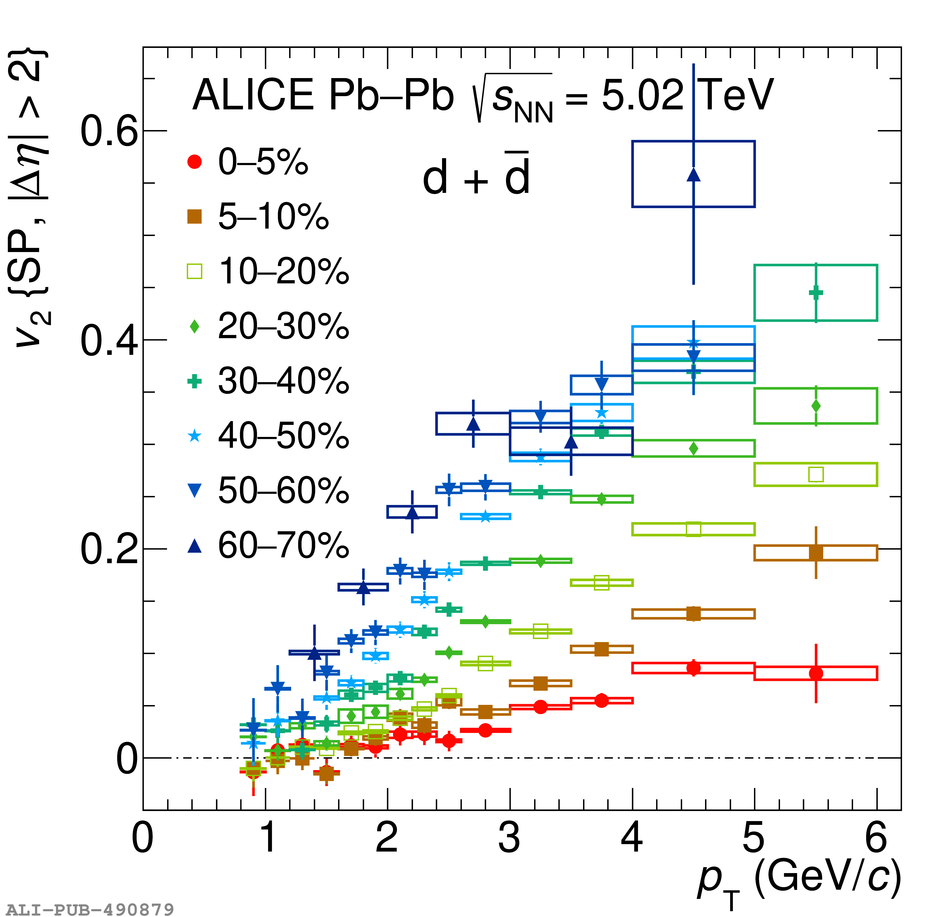 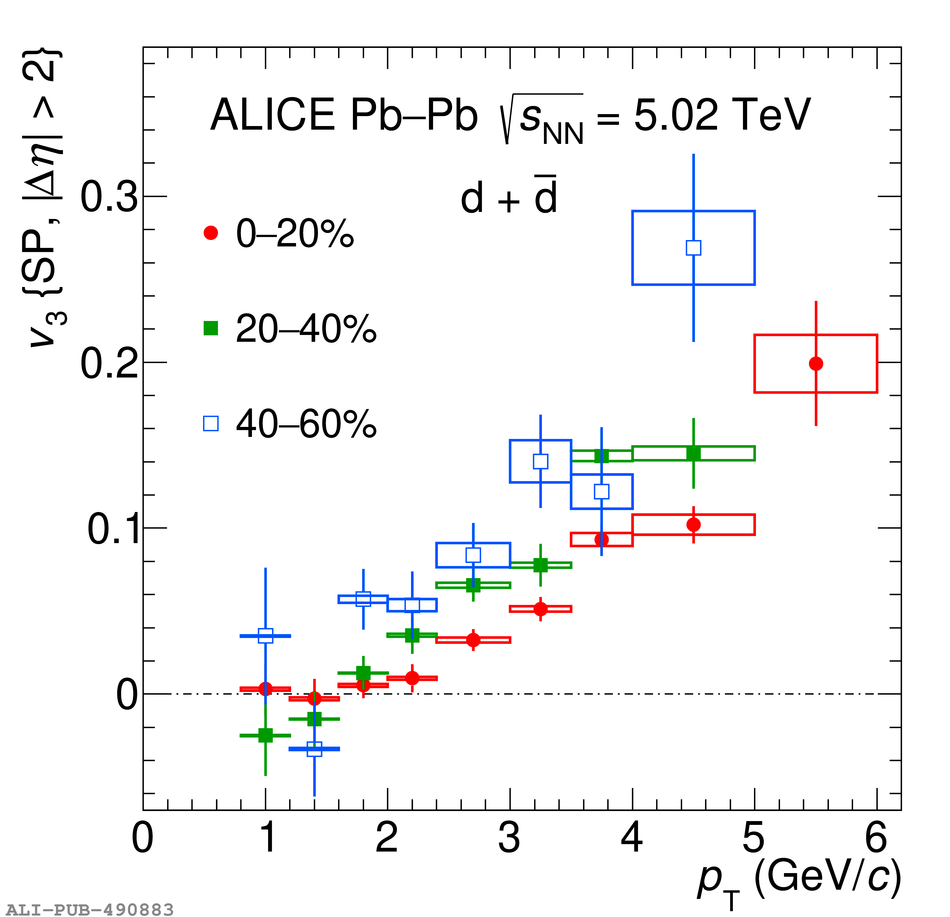 |
Figure 3
Deuterons \vtwo\ measured in \PbPb collisions at \snn = 5.02 TeV (red square) compared to that measured at \snn = 2.76 TeV (light blue circles) for two centrality intervals (10--20\% and 40--50\%). Both protons and deuteron elliptic flow were measured for pseudorapidity gap between the particle of interest and the reference flow particle $|\Delta \eta| >$ 0.9. Vertical bars and boxes represent the statistical and systematic uncertainties, respectively. | 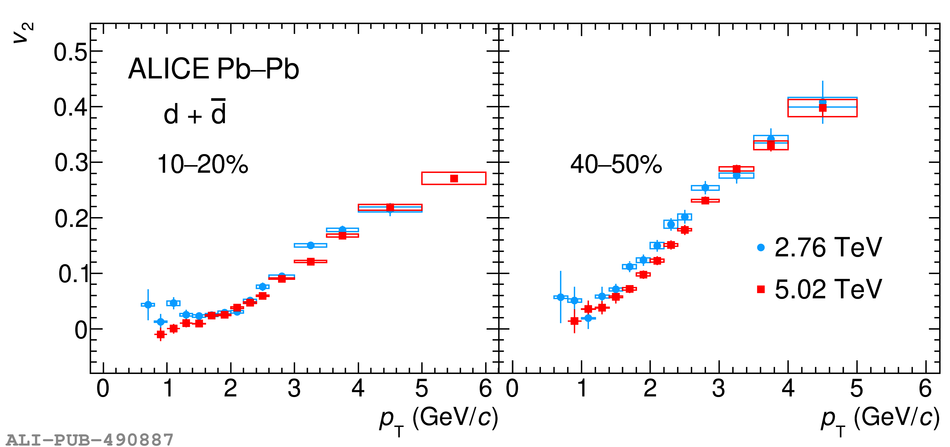 |
Figure 4
Ratio of the \vtwo\ of deuterons measured in \PbPb collisions at \snn = 5.02 TeV to that measured at \snn = 2.76 TeV (red circles) compared with the same ratio obtained for protons (blue squares) for two centrality intervals (10--20\% on the left panel and 40--50\% on the right panel). For a direct comparison of protons and deuterons, the measured \vtwo\ and \pt\ have were divided by $A$. Vertical bars and boxes represent the statistical and systematic uncertainties, respectively. | 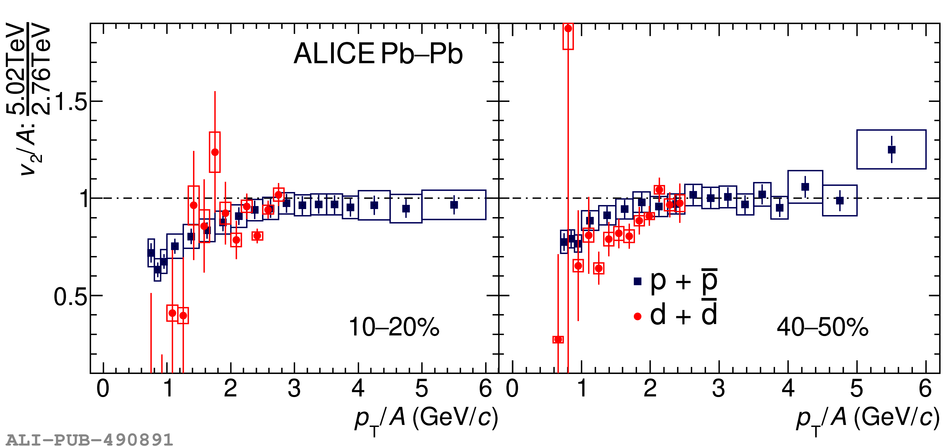 |
Figure 5
Comparison of the elliptic flow of pions, kaons, protons, deuterons and (anti)$^{3}$He in different centrality intervals for \PbPb\ collisions at \snn = 5.02 TeV. (Anti)$^{3}$He \vtwo\ is measured using the Event Plane method . Vertical bars and boxes represent the statistical and systematic uncertainties, respectively. | 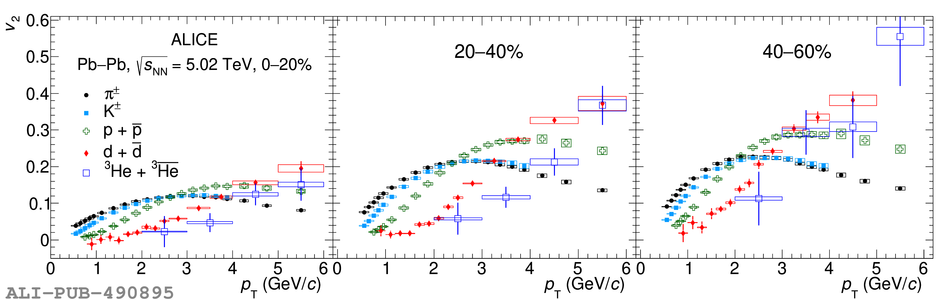 |
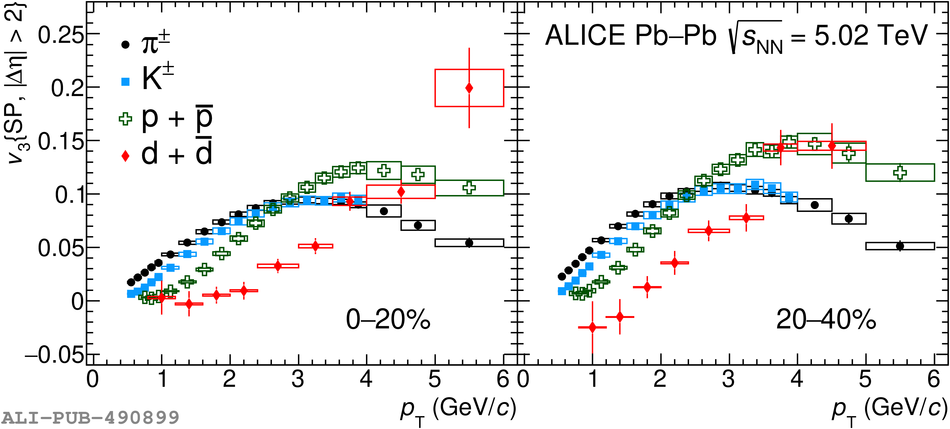
Figure 7
Blast-wave fits to the \vtwo(\pt) of pions, kaons, and protons and predictions of the deuterons \vtwo(\pt) for the centrality intervals 10--20$\%$ (left) and 40--50$\%$ (right). In the lower panels, the data-to-fit ratios are shown for pions, kaons, and protons as well as the ratio of the deuterons \vtwo to the \mbox{blast-wave} predictions. Vertical bars and boxes sent the statistical and systematic uncertainties, respectively. The dashed line at one is to guide the eye. |  |
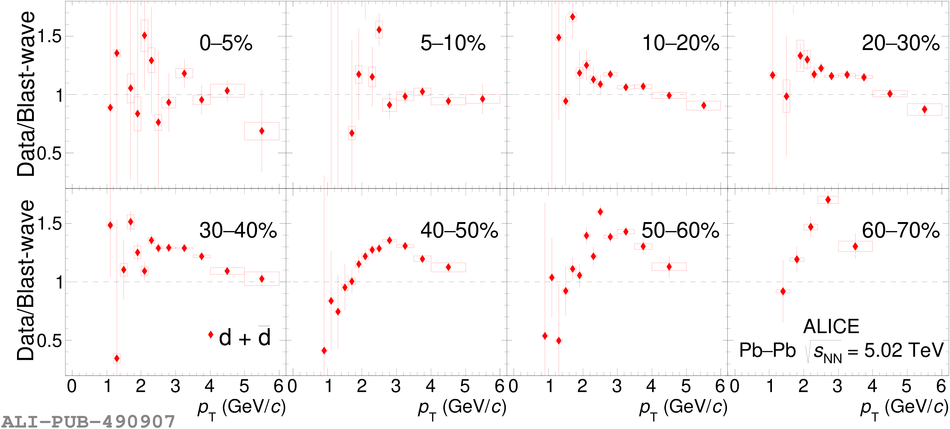
Figure 9
Measured deuterons \vtwo\ and \vthree\ (red circles) compared with the expectations from simple coalescence (Eq. \ref{eq:v2coal}) (blue shaded bands) for two centrality intervals. In the left panel, the \vtwo\ measurements in the 10--20$\%$ and 40--50$\%$ centrality intervals is shown. The right panel displays the results of \vthree\ in the 0--20$\%$ and 20--40$\%$ centrality intervals. The bottom panels show the ratio between the measured \vtwo(\vthree) and the expectations from the coalescence model. In each panel, vertical bars and boxes represent the statistical and systematic uncertainties, respectively. The line at one is to guide the eye. | 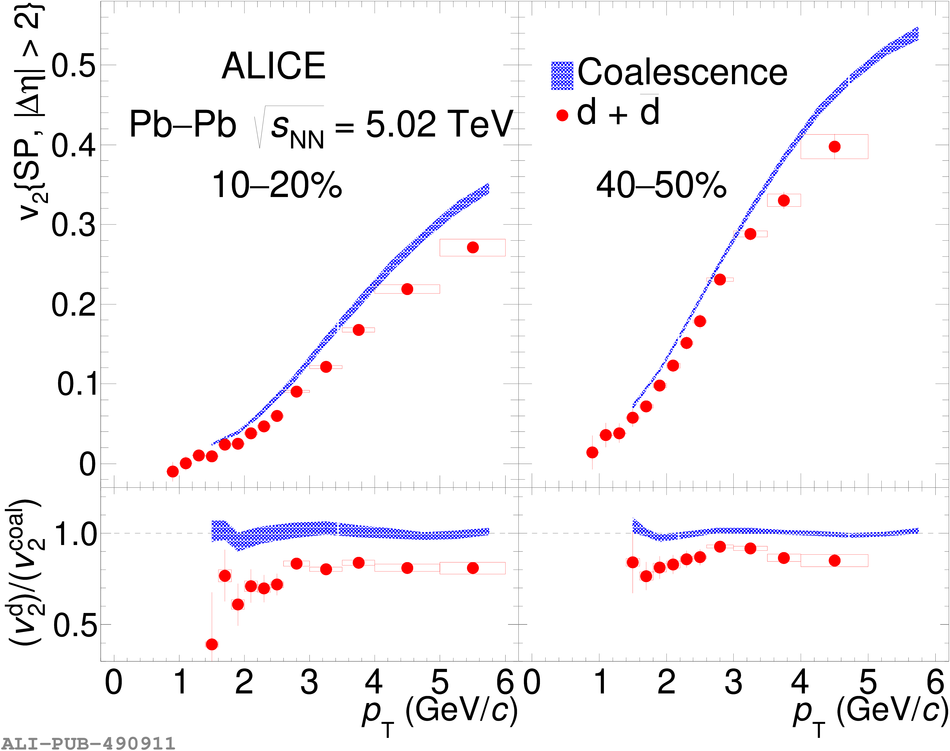 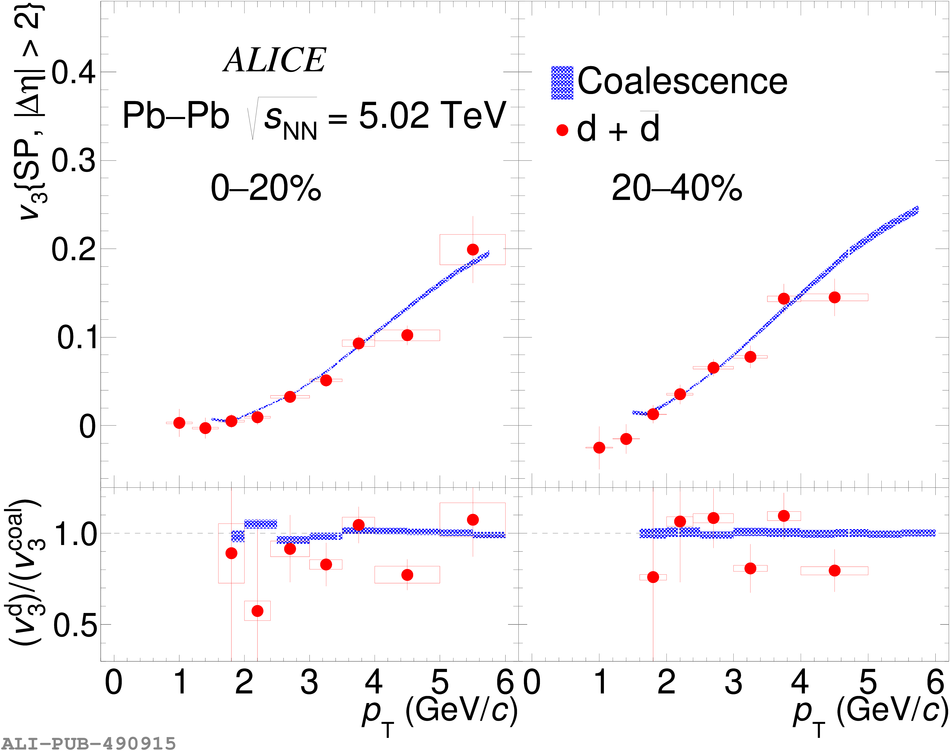 |
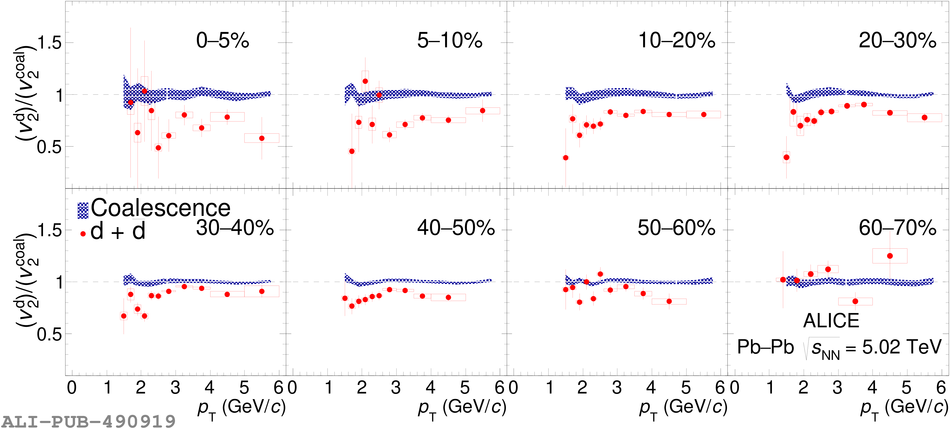
Figure 12
Measured deuterons \vtwo\ compared to the predictions from a microscopic model based on the JETSCAPE generator . The model predictions, based on SMASH afterburner and which used TRENTo initial conditions, are shown as bands. The width of the band represents the statistical uncertainty associated with the model. In the lower panel the data-to-model differences are shown. Vertical bars and boxes represent the statistical and systematic uncertainties, respectively. | 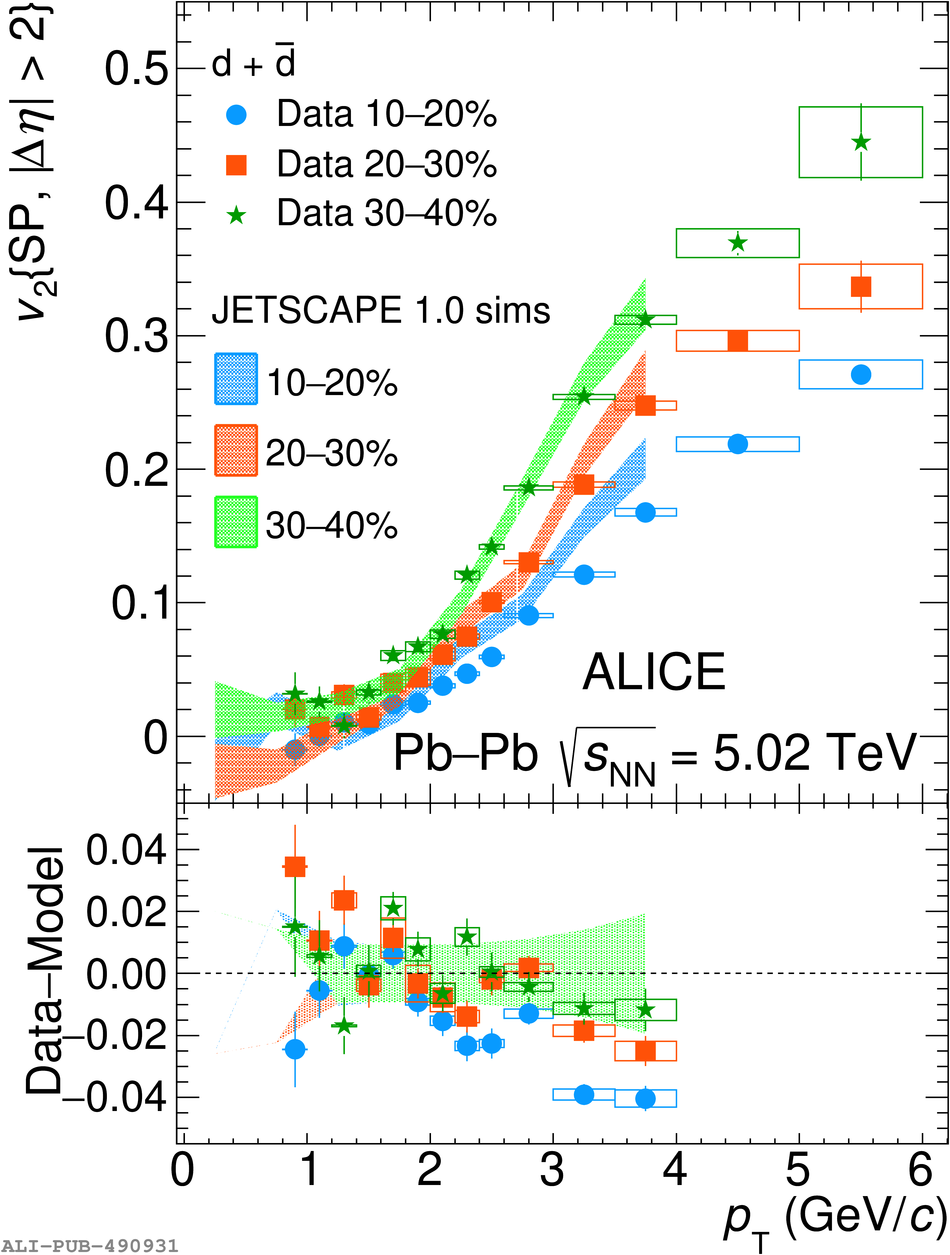 |