Inclusive J/$\psi$ $Q_{\rm pPb}$ as a function of $p_{\rm T}$ for various centrality classes at backward (left) and forward (right) rapidity. The vertical error bars represent the statistical uncertainties and the open boxes around the data points the uncorrelated systematic uncertainties. The full coloured boxes centered at $Q_{\rm pPb} = 1$ on the right are the systematic uncertainties due to pile-up, $\langle T_{\rm pPb} \rangle$, and $F_{\rm norm}$, while the full black box on the left of each panel shows the global systematic uncertainties. | 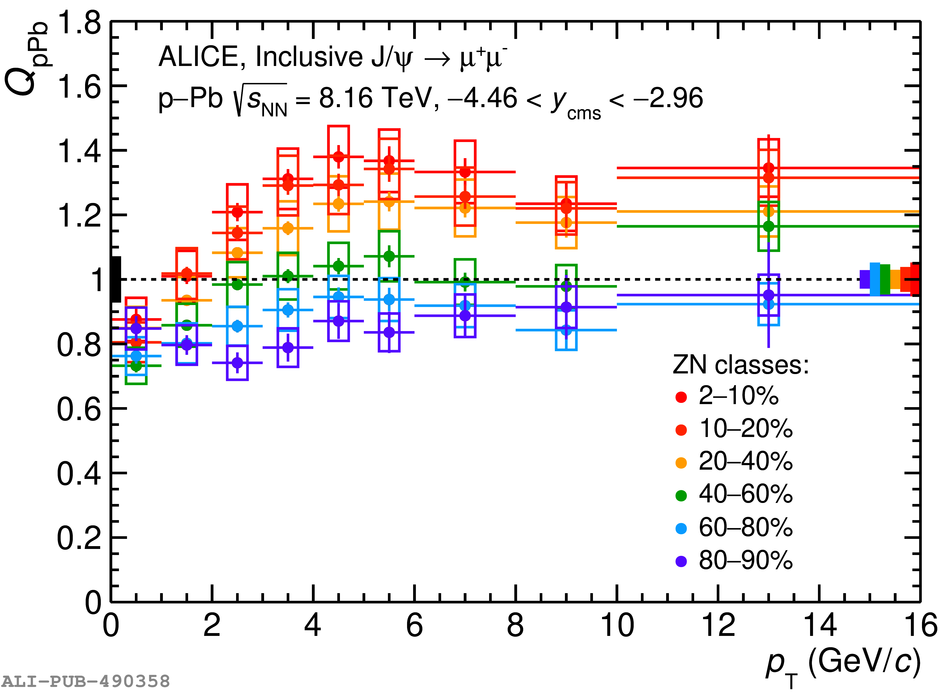  |