The inclusive production of the J/$\psi$ and $\psi$(2S) charmonium states is studied as a function of centrality in p-Pb collisions at a centre-of-mass energy per nucleon pair $\sqrt{s_{\rm NN}} = 8.16$ TeV at the LHC. The measurement is performed in the dimuon decay channel with the ALICE apparatus in the centre-of-mass rapidity intervals $-4.46 <~ y_{\rm cms} <~ -2.96$ (Pb-going direction) and $2.03 <~ y_{\rm cms} <~ 3.53$ (p-going direction), down to zero transverse momentum ($p_{\rm T}$). The J/$\psi$ and $\psi$(2S) production cross sections are evaluated as a function of the collision centrality, estimated through the energy deposited in the zero degree calorimeter located in the Pb-going direction. The $p_{\rm T}$-differential J/$\psi$ production cross section is measured at backward and forward rapidity for several centrality classes, together with the corresponding average $\langle p_{\rm T} \rangle$ and $\langle p^{2}_{\rm T} \rangle$ values. The nuclear effects affecting the production of both charmonium states are studied using the nuclear modification factor. In the p-going direction, a suppression of the production of both charmonium states is observed, which seems to increase from peripheral to central collisions. In the Pb-going direction, however, the centrality dependence is different for the two states: the nuclear modification factor of the J/$\psi$ increases from below unity in peripheral collisions to above unity in central collisions, while for the $\psi$(2S) it stays below or consistent with unity for all centralities with no significant centrality dependence. The results are compared with measurements in p-Pb collisions at $\sqrt{s_{\rm NN}} = 5.02$ TeV and no significant dependence on the energy of the collision is observed. Finally, the results are compared with theoretical models implementing various nuclear matter effects.
JHEP 02 (2021) 002
HEP Data
e-Print: arXiv:2008.04806 | PDF | inSPIRE
CERN-EP-2020-133
Figure group
Figure 1
Fit to the dimuon invariant mass distribution for the p--Pb (top panels) and Pb--p (bottom panels) data sets, for the 20--40\% (left panels) and 60--80\% (right panels) ZN centrality classes. The extended Crystal Ball function is used to describe the $\jpsi$ and $\psip$ signals, while a Variable Width Gaussian function is used for the background. The red line represents the total fit. |  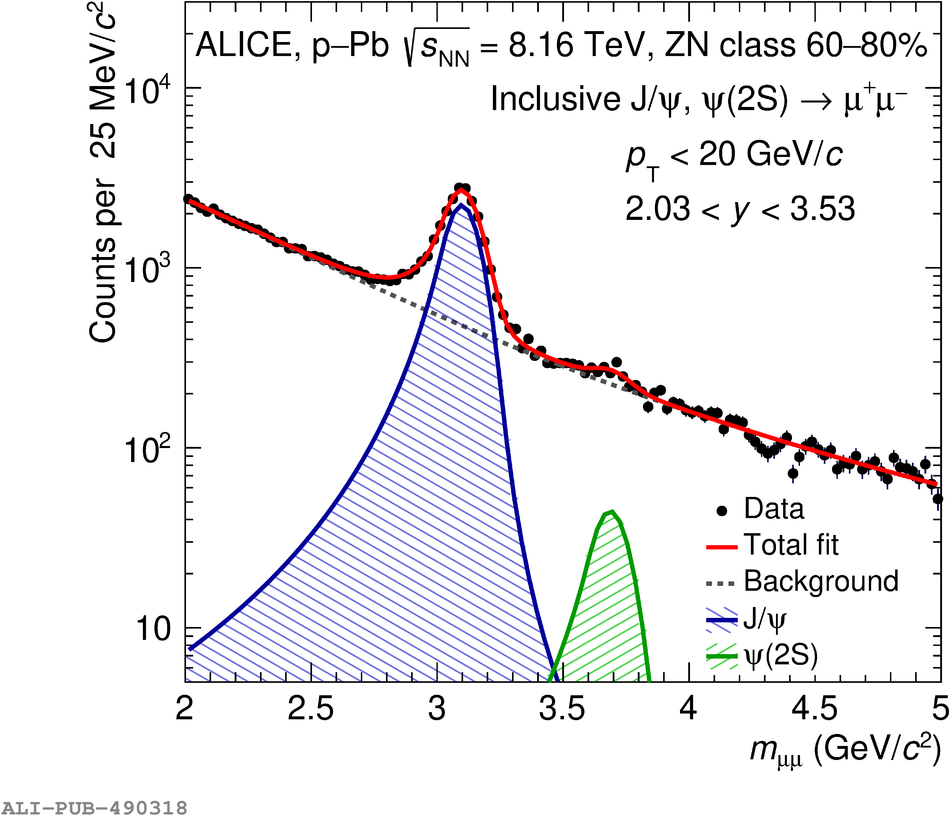 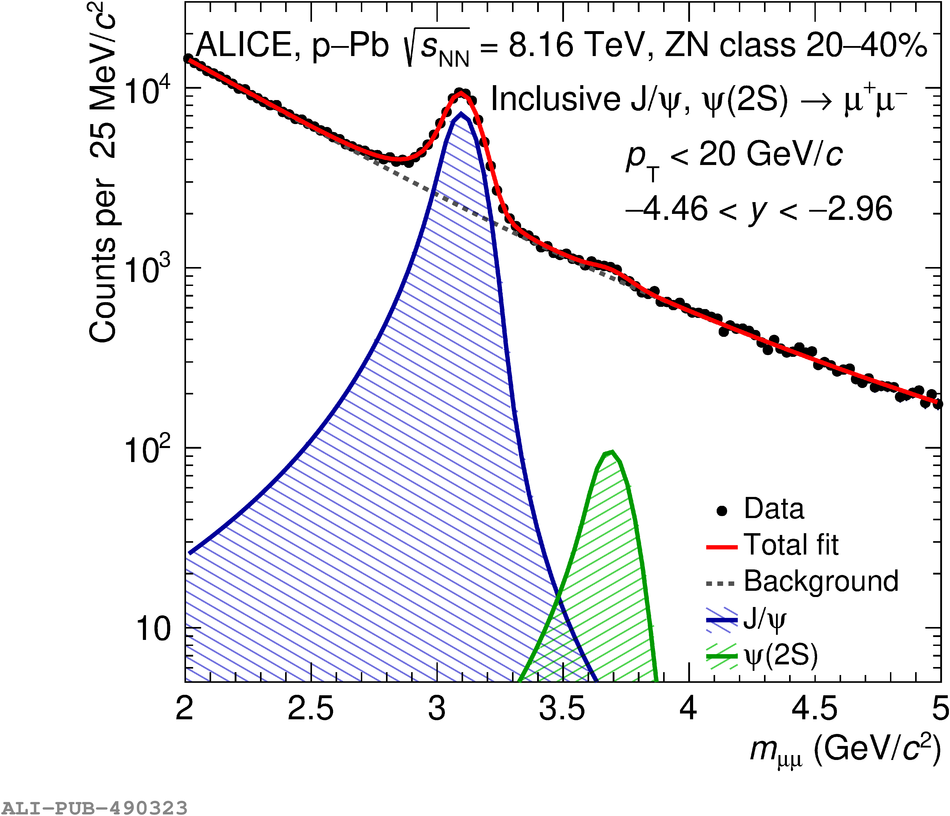 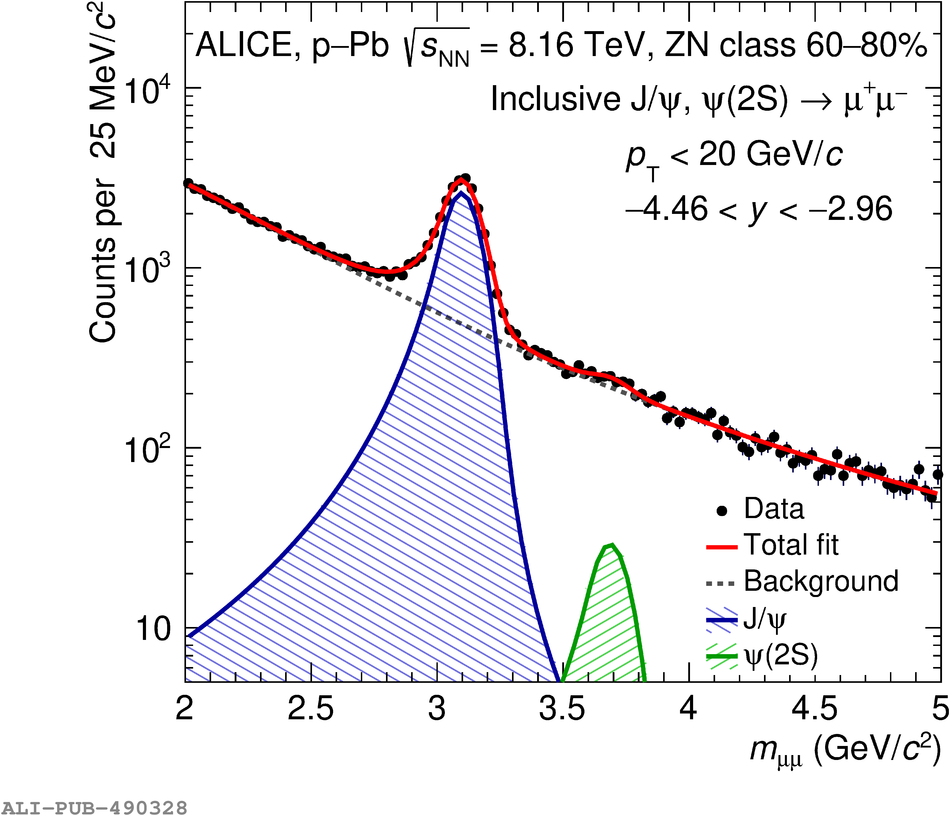 |
Figure 2
Inclusive J/$\psi$ $p_{\rm T}$-differential cross section for different centrality classes at backward (left) and forward (right) rapidity in p--Pb collisions at $\sqrt{s_{\rm NN}} = 8.16$ TeV. The vertical error bars, representing the statistical uncertainties, and the boxes around the points, representing the uncorrelated systematic uncertainties, are smaller than the marker. The global systematic uncertainty, which is correlated over centrality, rapidity, and $p_{\rm T}$ and is obtained as the quadratic sum of the systematic uncertainty of the branching ratio and the correlated systematic uncertainty of $\sigma_{\rm MB}$, amounts to 0.9\% (0.7\%) at backward (forward) rapidity and is shown as text. | 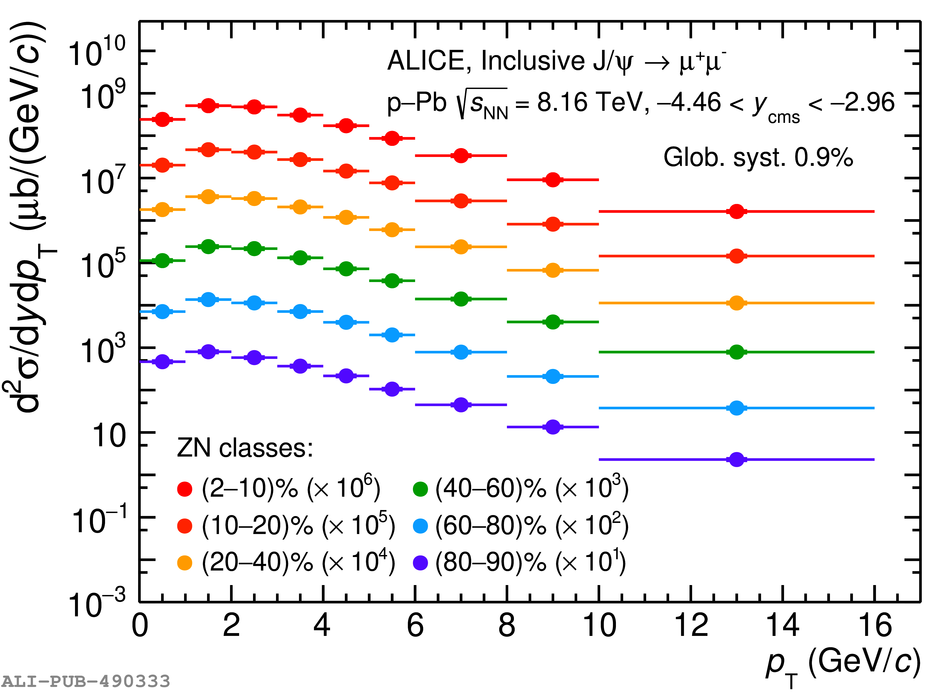  |
Figure 3
\pt\ broadening of J/$\psi$, $\Delta \langle p^{2}_{\rm T}\rangle$, as a function of $\langle N_{\rm coll}\rangle$ at backward (blue circles) and forward (red squares) rapidity in p--Pb collisions at $\sqrt{s_{\rm NN}} = 8.16$ TeV compared to the results at $\sqrt{s_{\rm NN}} = 5.02$ TeV and to energy loss model calculations . The vertical error bars represent the statistical uncertainties and the boxes around the data points the systematic uncertainties. | 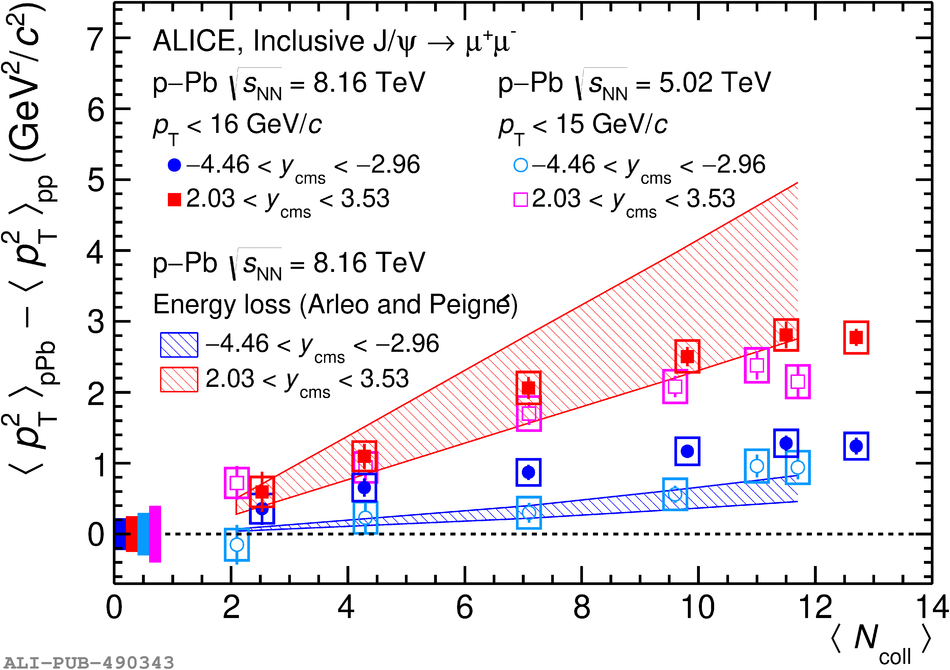 |
Figure 4
Inclusive J/$\psi$ $Q_{\rm pPb}$ as a function of $\langle N_{\rm coll} \rangle$ at backward (left) and forward (right) rapidity in p--Pb collisions at $\sqrt{s_{\rm NN}} = 8.16$ TeV compared with the results at $\sqrt{s_{\rm NN}} = 5.02$ TeV and theoretical models . The vertical error bars represent the statistical uncertainties and the boxes around the data points the uncorrelated systematic uncertainties. The boxes centered at $Q_{\rm pPb} = 1$ represent the systematic uncertainties correlated over centrality. | 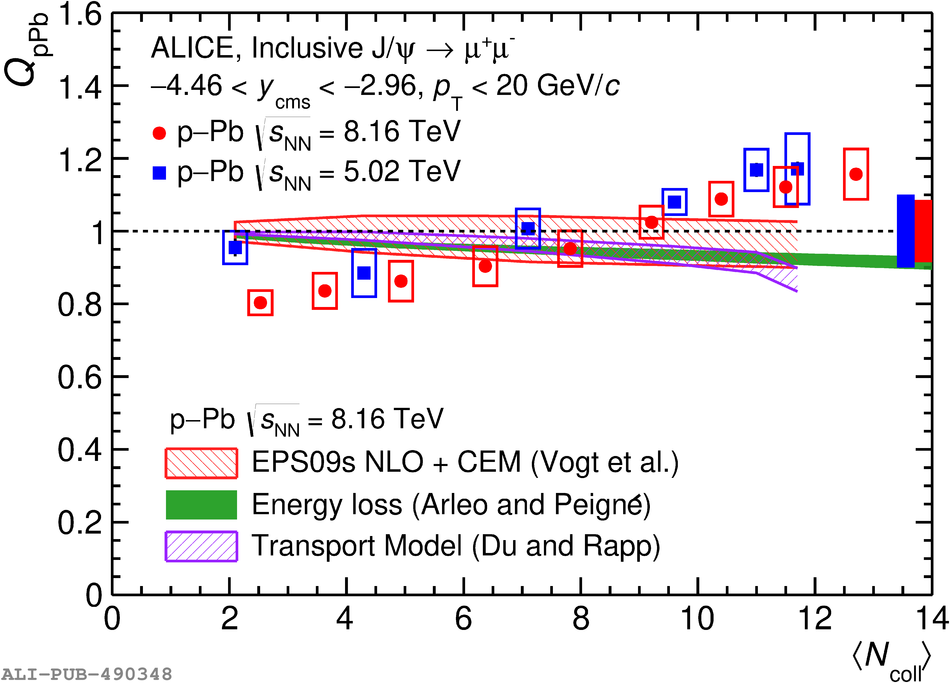  |
Figure 5
Inclusive J/$\psi$ $Q_{\rm pPb}$ as a function of $p_{\rm T}$ for various centrality classes at backward (left) and forward (right) rapidity. The vertical error bars represent the statistical uncertainties and the open boxes around the data points the uncorrelated systematic uncertainties. The full coloured boxes centered at $Q_{\rm pPb} = 1$ on the right are the systematic uncertainties due to pile-up, $\langle T_{\rm pPb} \rangle$, and $F_{\rm norm}$, while the full black box on the left of each panel shows the global systematic uncertainties. | 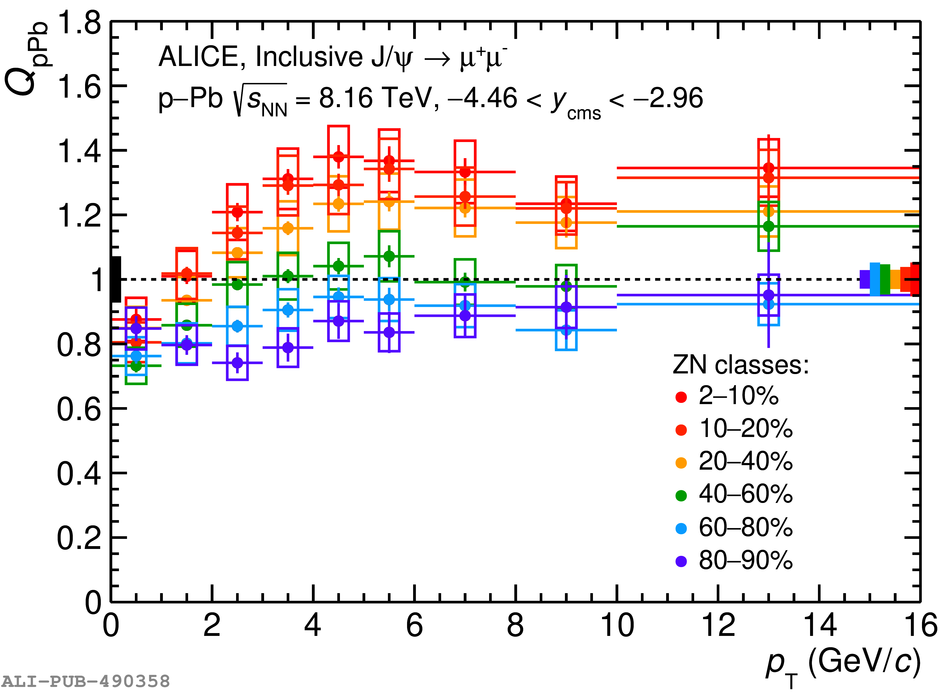  |
Figure 6
Inclusive J/$\psi$ $Q_{\rm PC}$ as a function of $p_{\rm T}$ for various centrality classes at backward (left) and forward (right) rapidity compared to the theoretical calculations . The vertical error bars represent the statistical uncertainties and the boxes around the data points the uncorrelated systematic uncertainties. The boxes centered at $Q_{\rm PC} = 1$ are the systematic uncertainties due to pile-up, $\langle T_{\rm pPb} \rangle$, and $F_{\rm norm}$. | 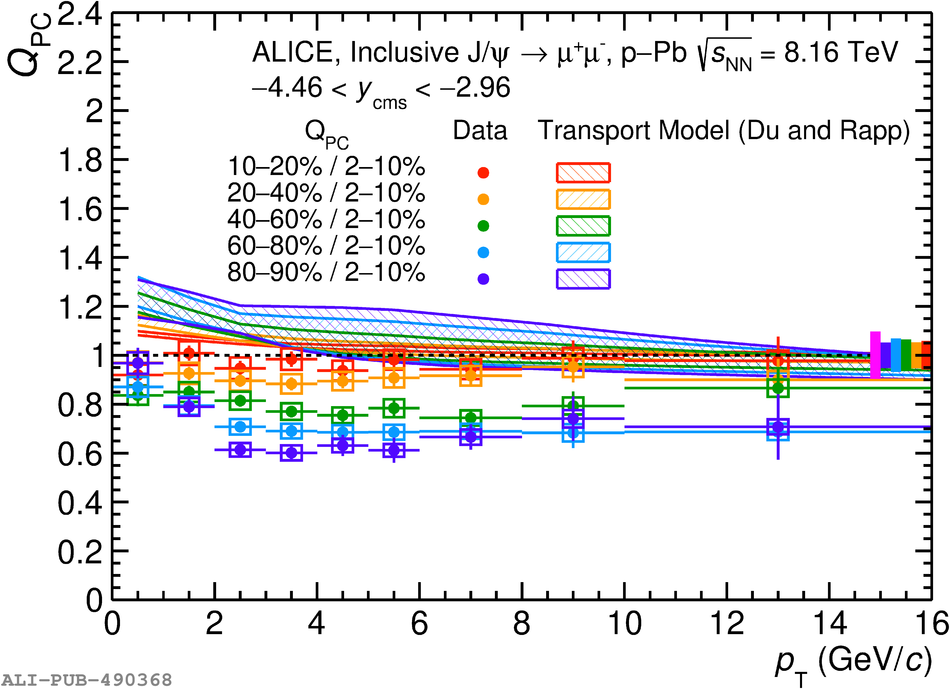  |
Figure 8
Inclusive J/$\psi$ $Q_{\rm pPb}$ as a function of $p_{\rm T}$ for 2--10\%, 10--20\%, 20--40\%, 40--60\%, 60--80\%, and 80--90\% ZN centrality classes at forward rapidity in p--Pb collisions at $\sqrt{s_{\rm NN}} = 8.16$ TeV compared with the results at $\sqrt{s_{\rm NN}} = 5.02$ TeV and with theoretical calculations . The vertical error bars show the statistical uncertainties, the open boxes the uncorrelated systematic uncertainties, and the full boxes centered at $Q_{\rm pPb} = 1$ the correlated systematic uncertainties. | 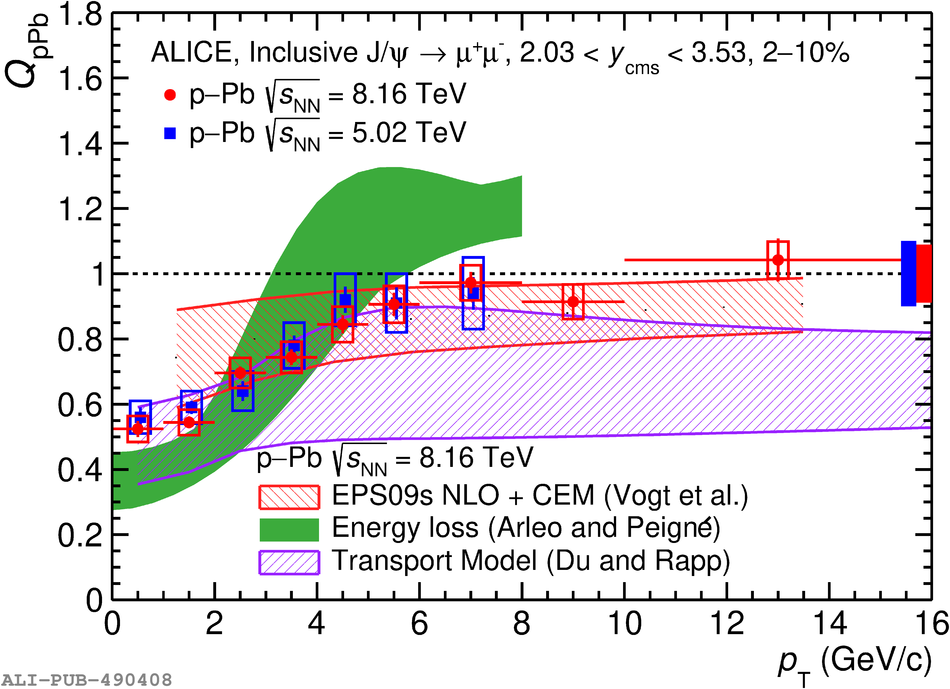 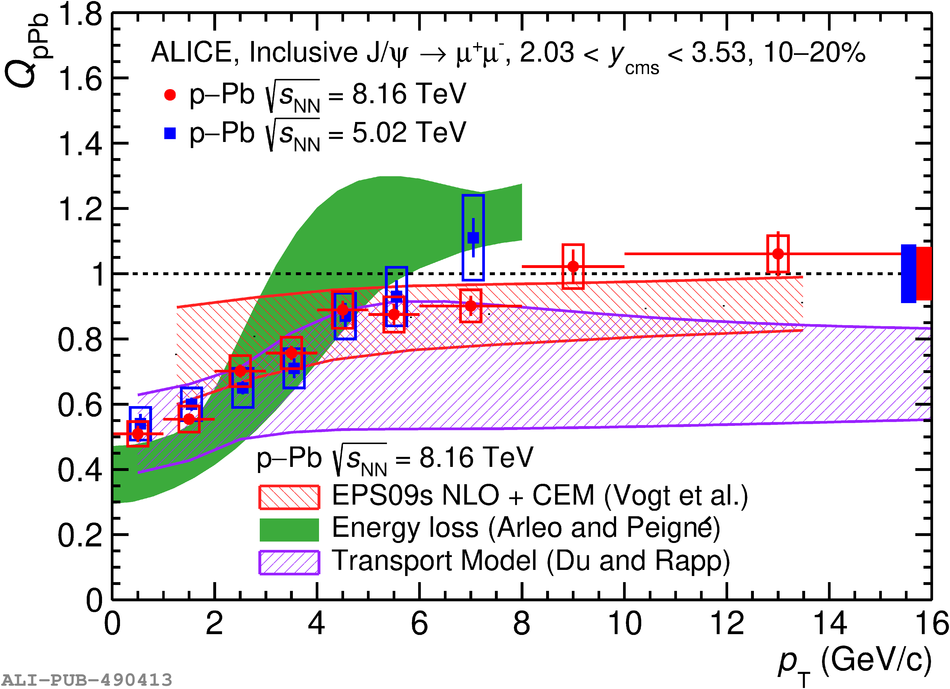 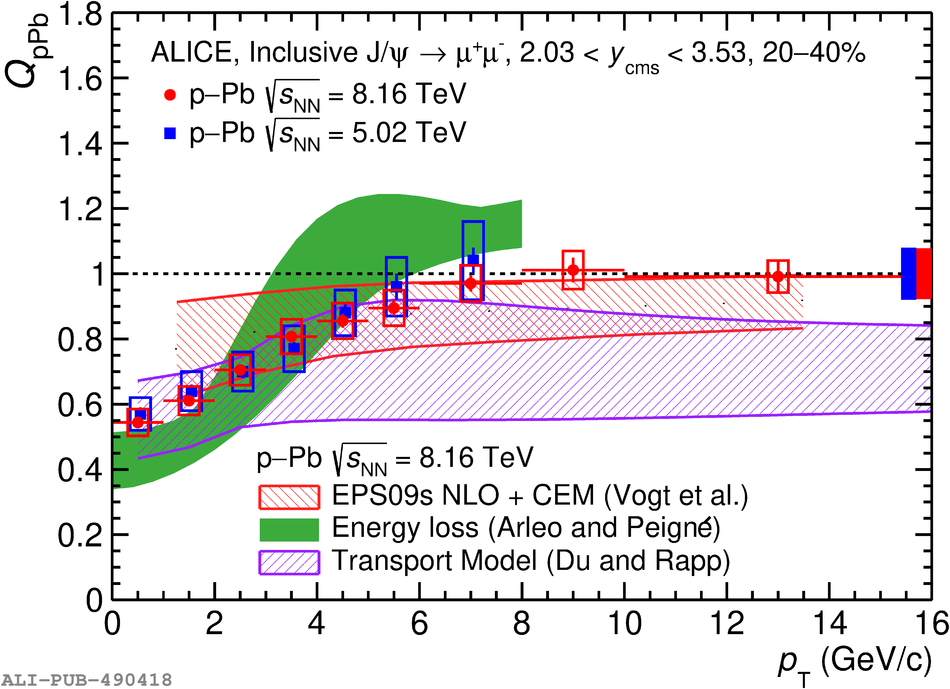 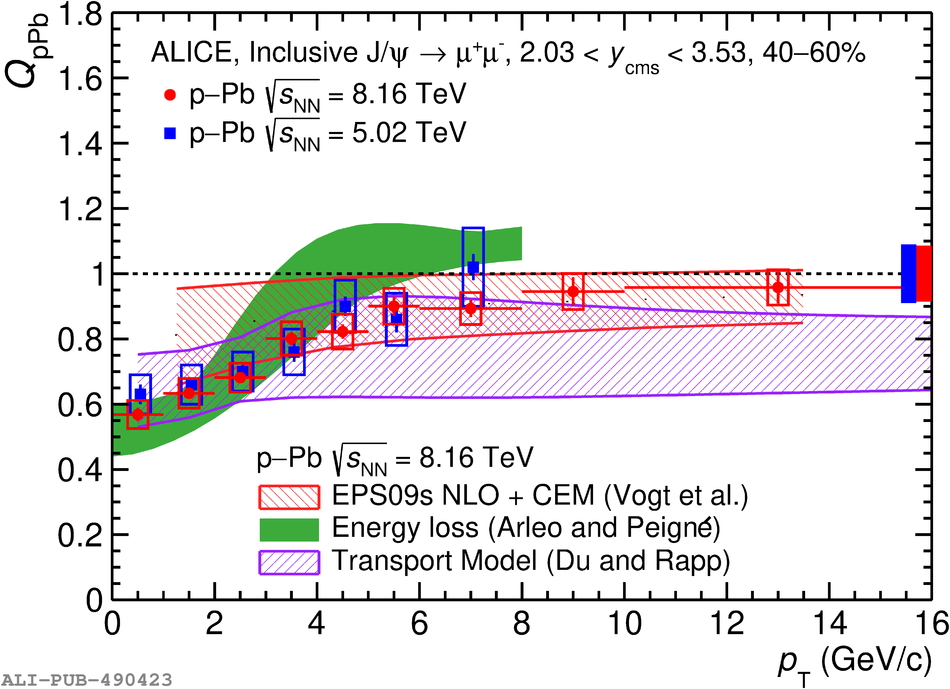   |
Figure 9
B.R.$_{\psi(\rm 2S)\rightarrow\mu^{+}\mu^{-}}{\sigma_{\psi(\rm 2S)}}$/B.R.$_{J/\psi\rightarrow\mu^{+}\mu^{-}}{\sigma_{\rm J/\psi}}$ as a function of $\langle N_{\rm coll} \rangle$ at backward (left) and forward (right) rapidity compared with the measurement in pp collisions at $\sqrt{s} = 7$ TeV (line with the band representing the total uncertainty), and to the results at $\sqrt{s_{\rm NN}} = 5.02$ TeV . Vertical error bars represent the statistical uncertainties, while the open boxes correspond to the systematic uncertainties. | 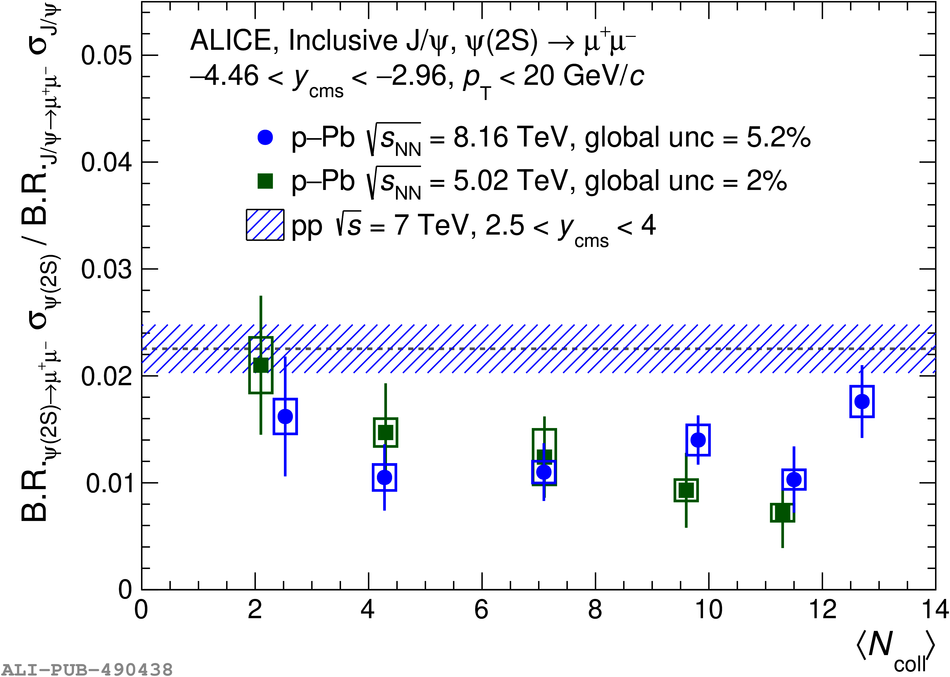 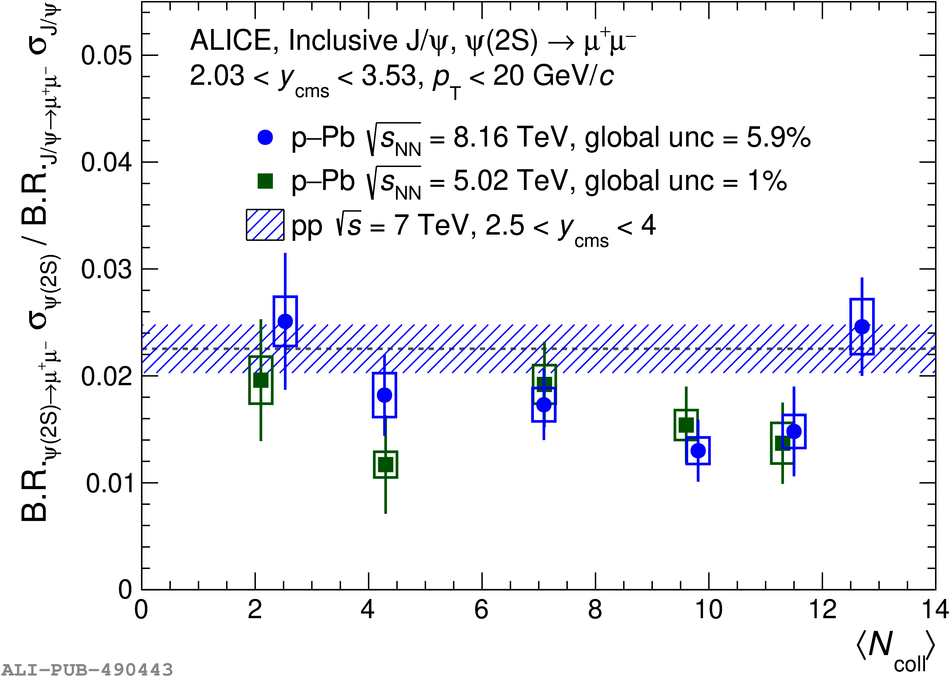 |
Figure 10
Double ratio $[\sigma_{\psi(\rm 2S)}/\sigma_{\rm J/\psi}]_{\rm pPb}/[\sigma_{\psi(\rm 2S)}/\sigma_{\rm J/\psi}]_{\rm pp}$ as a function of $\langle N_{\rm coll} \rangle$ at backward (left) and forward (right) rapidity compared with the one at $\sqrt{s_{\rm NN}} = 5.02$ TeV . The vertical error bars represent the statistical uncertainties and the open boxes around the data points the uncorrelated systematic uncertainties. The boxes around unity represent the correlated systematic uncertainty and correspond to the uncertainty on the ratio $\psi(2S)/\jpsi$ in pp collisions. Experimental points are compared with the theoretical predictions of the comovers model at $\sqrt{s_{\rm NN}} = 5.02$ TeV (green line ) and $\sqrt{s_{\rm NN}} = 8.16$ TeV (blue line ). |  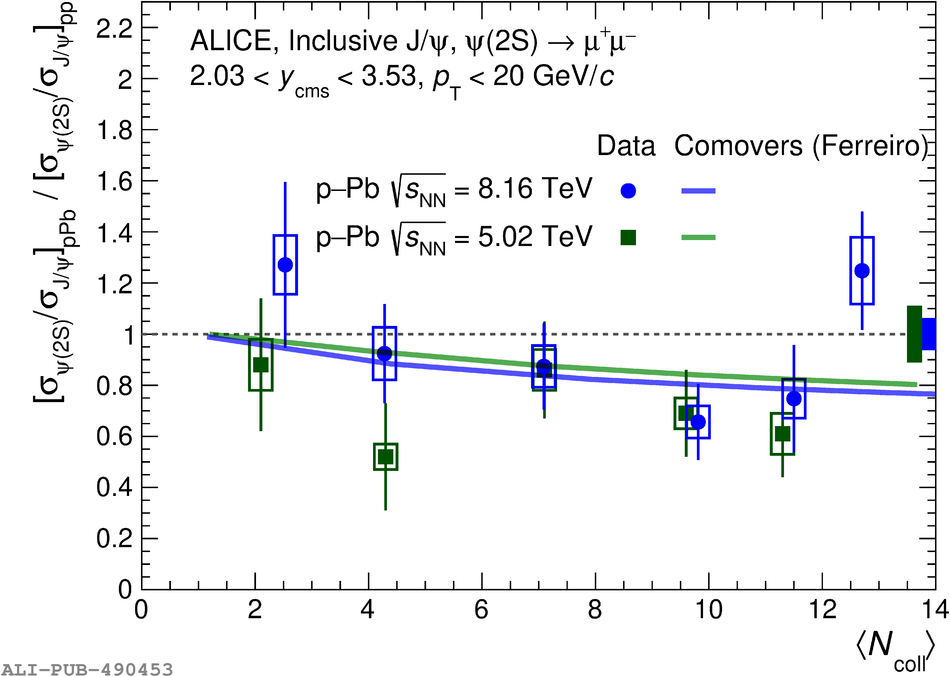 |
Figure 11
Inclusive $\psi$(2S) $Q_{\rm pPb}$ as a function of $\langle N_{\rm coll} \rangle$ at backward (left) and forward (right) rapidity compared to J/$\psi$ $Q_{\rm pPb}$ and with the theoretical models. Vertical error bars represent the statistical uncertainties, while the open boxes around the data points correspond to the uncorrelated systematic uncertainties. The red and blue boxes around unity represent the correlated systematic uncertainty specific to the J/$\psi$ and $\psi$(2S), respectively. The grey box corresponds to the common systematic uncertainty correlated over $\langle N_{\rm coll}\rangle$. |  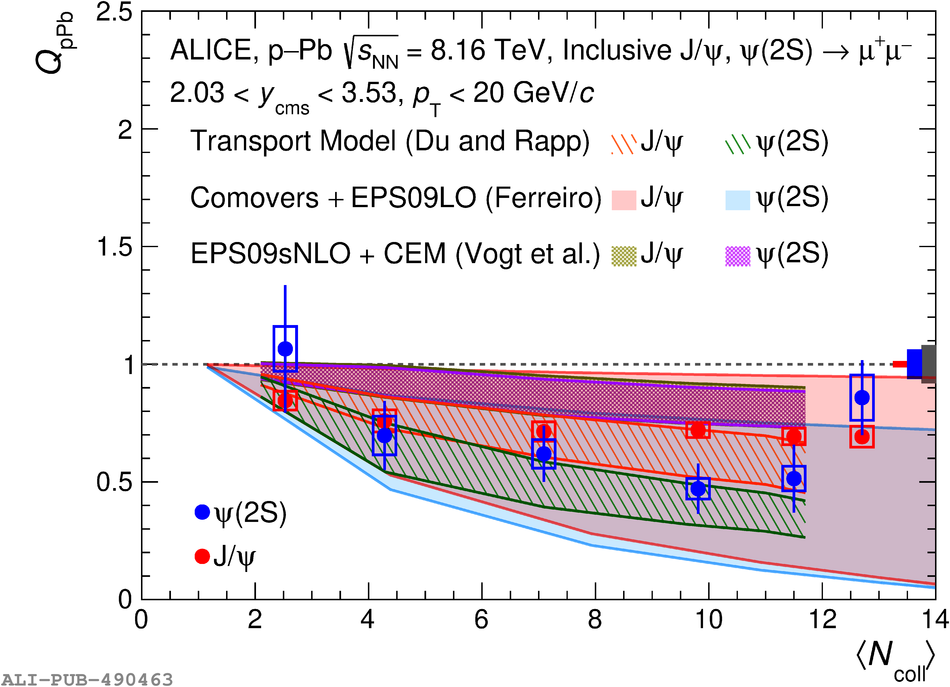 |