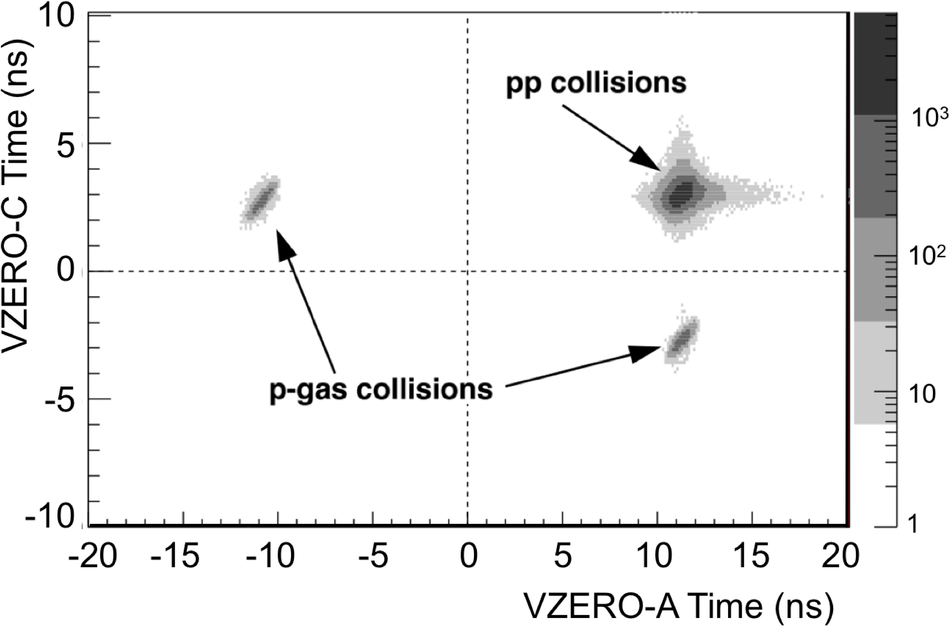
Top: VZERO-A (red-dashed line) and VZERO-C (blue-solid line) weighted average time of flight distributions for beam-beam collisions, with 0.45 and 0.35 ns r.m.s., respectively. Bottom: weighted average time of flight (as defined by Eq.3) of the particles detected in VZERO-C versus VZERO-A. The dashed line intersection represents the time of the collisions at the interaction point, or the crossing time of the background tracks at the vertical plane $z=0$. | 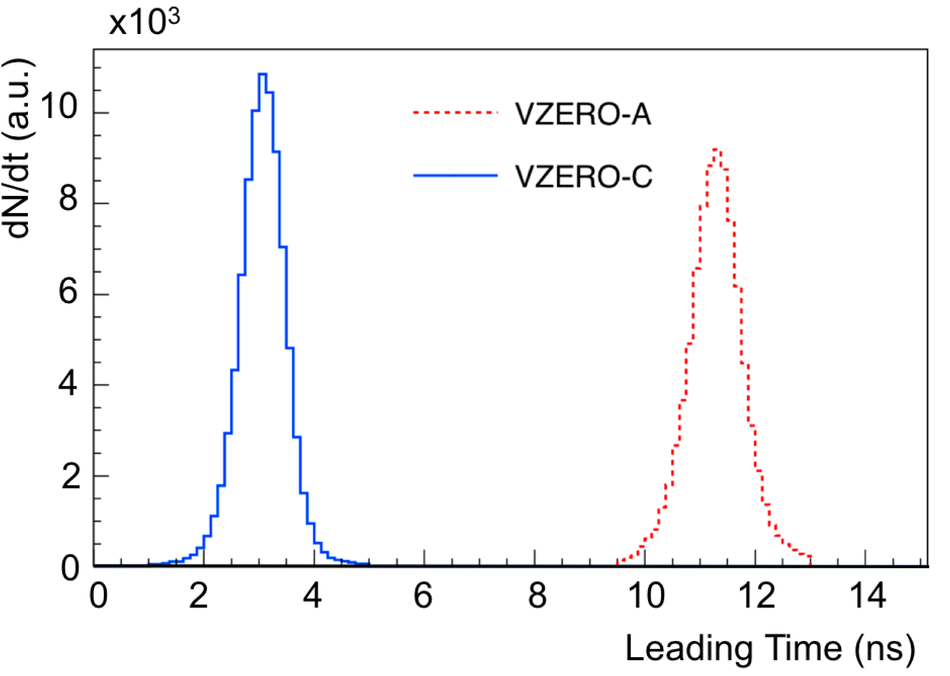 |