Performance of the ALICE VZERO system

ALICE is an LHC experiment devoted to the study of strongly interacting matter in proton-proton, proton--nucleus and nucleus-nucleus collisions at ultra-relativistic energies. The ALICE VZERO system, made of two scintillator arrays at asymmetric positions, one on each side of the interaction point, plays a central role in ALICE. In addition to its core function as a trigger, the VZERO system is used to monitor LHC beam conditions, to reject beam-induced backgrounds and to measure basic physics quantities such as luminosity, particle multiplicity, centrality and event plane direction in nucleus-nucleus collisions. After describing the VZERO system, this publication presents its performance over more than four years of operation at the LHC.


JINST 8 (2013) P10016
e-Print: arXiv:1306.3130 | PDF | inSPIRE
CERN-PH-EP-2013-082

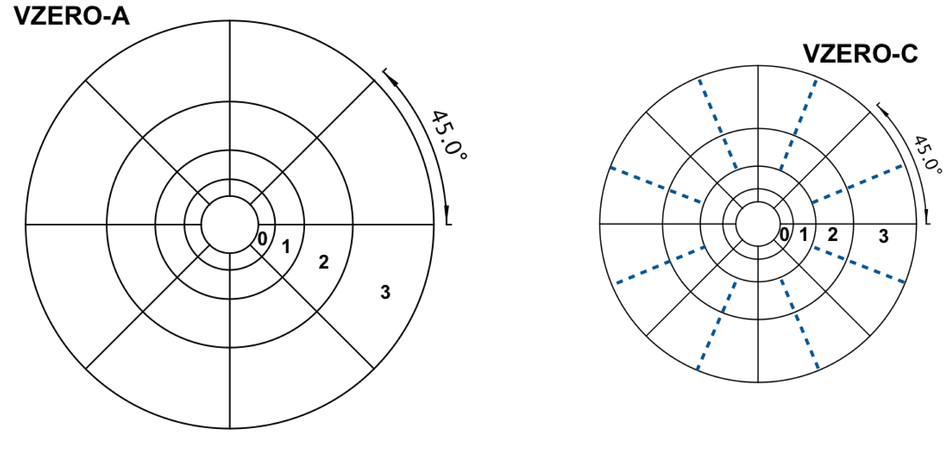
Figure 1

Sketches of VZERO-A and VZERO-C arrays showing their segmentation. Scintillator thicknesses are 2.5 and 2 cm respectively. Radii of rings are given in Table 1. The scintillator segments on both sides of the dashed lines are connected to the same PMT (see Section 3).

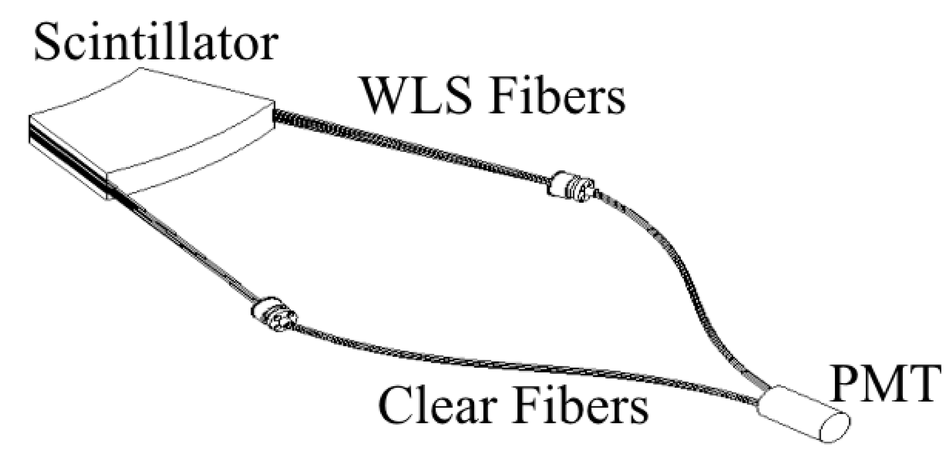
Figure 2

Schematic drawings of elementary cell designs for VZERO-A (top) and VZERO-C rings 0-1 (bottom). For VZERO-C rings 2-3, two scintillating sets (scintillator and WLS fibers) are connected to a single PMT through four clear fiber beams (see Figure 1).

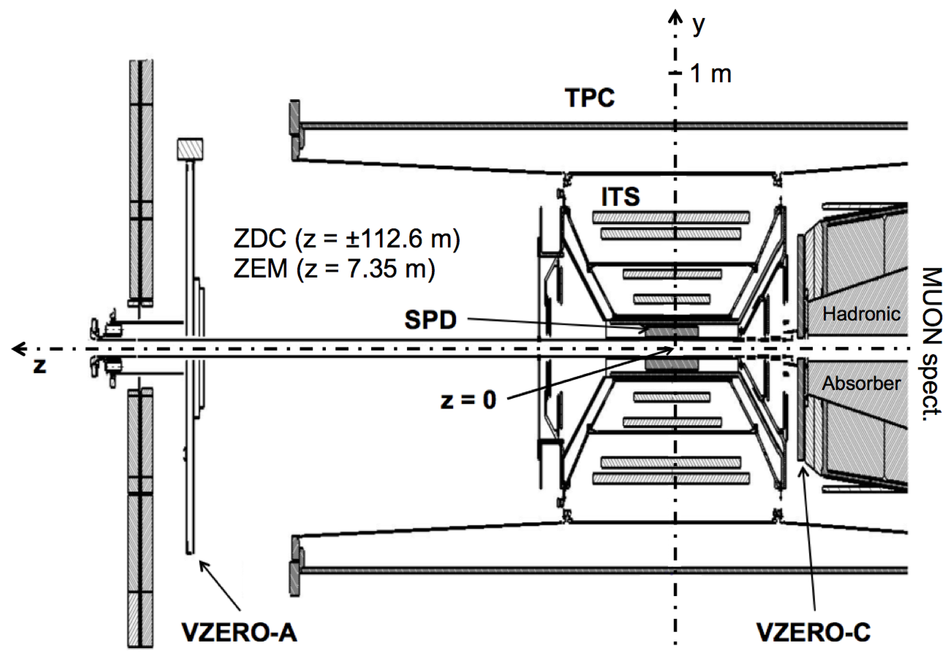
Figure 3

Position of the two VZERO arrays, and of the few detectors quoted in the text, within the general layout of the ALICE experiment.

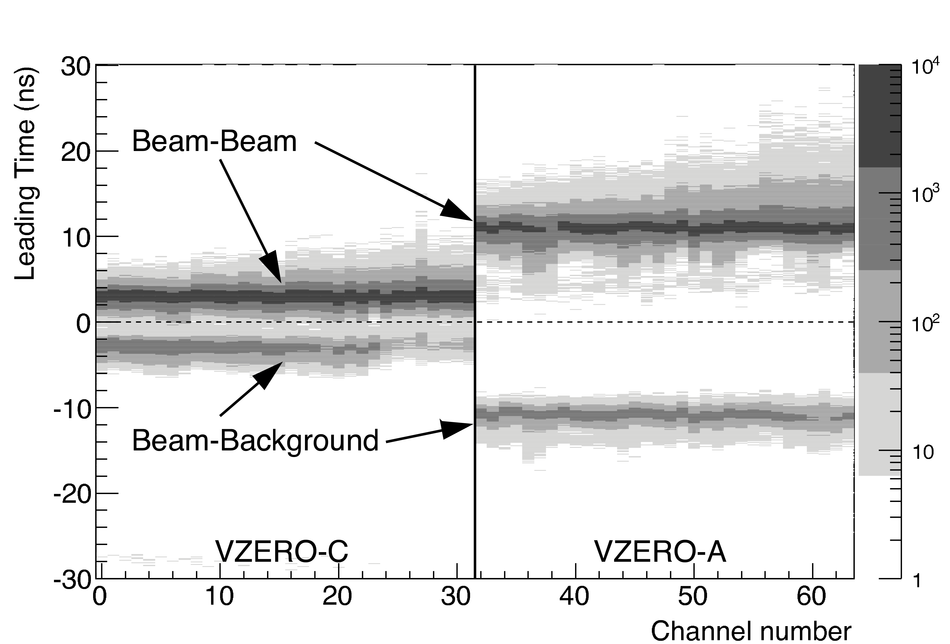
Figure 4

Charge of the pulse in ADC counts (top) and leading time of the pulse in nanoseconds (bottom) versus channel number for pp collisions at $\sqrt{s}=7$ TeV. Channels numbered from 0 to 31 correspond to VZERO-C, channels numbered from 32 to 63 correspond to VZERO-A.

Figure 5

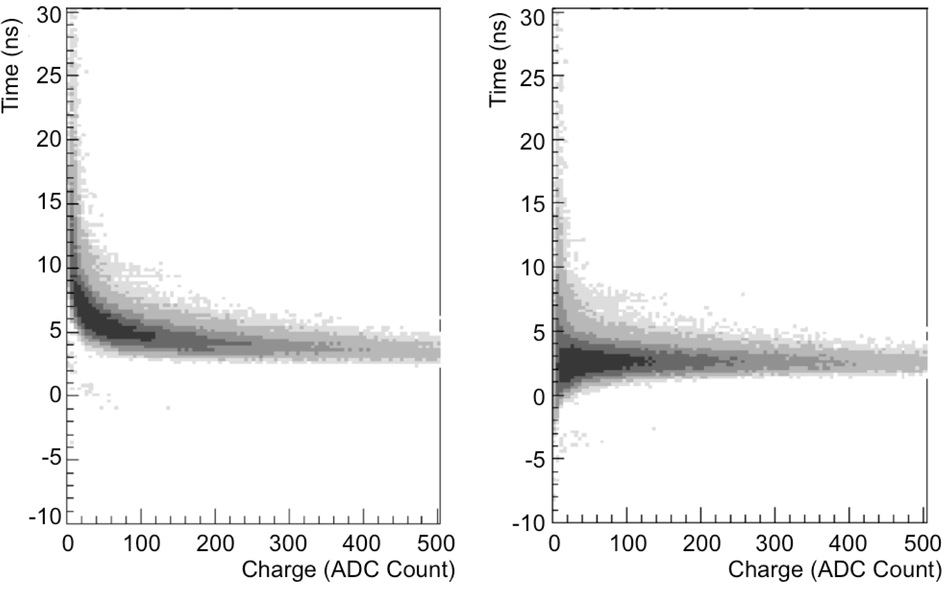
Correlation between leading time in nanoseconds and charge of the PMT signals in ADC channel counts for Pb-Pb collisions, before any correction (top) and after slewing correction (bottom).

Figure 6

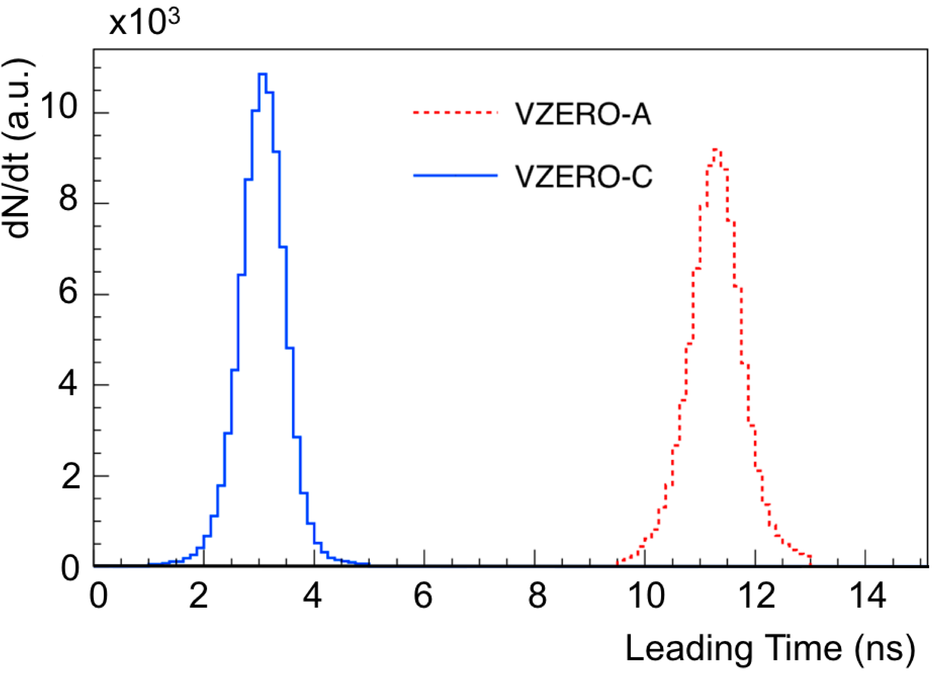
Top: VZERO-A (red-dashed line) and VZERO-C (blue-solid line) weighted average time of flight distributions for beam-beam collisions, with 0.45 and 0.35 ns r.m.s., respectively.
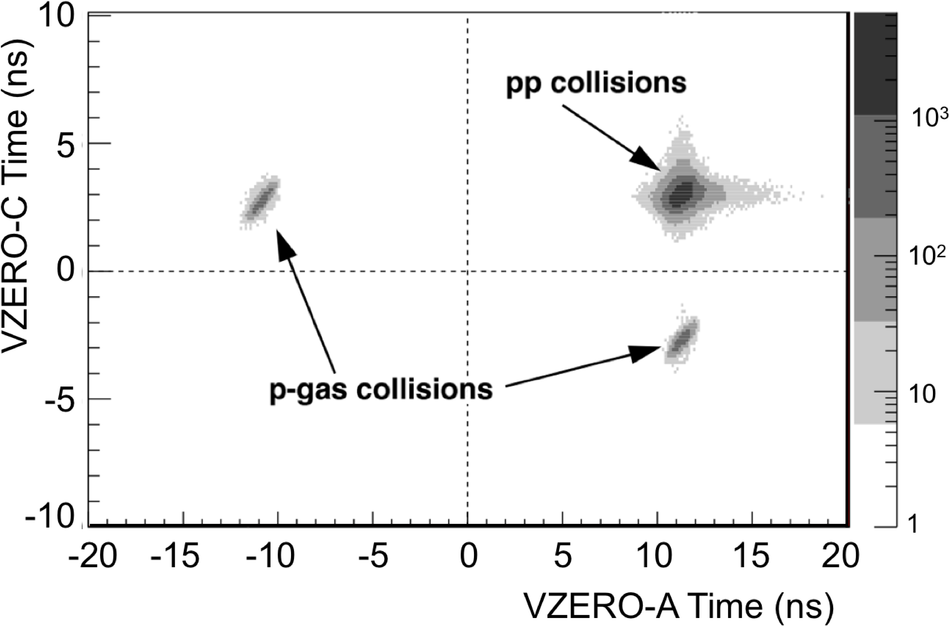
Bottom: weighted average time of flight (as defined by Eq.3) of the particles detected in VZERO-C versus VZERO-A. The dashed line intersection represents the time of the collisions at the interaction point, or the crossing time of the background tracks at the vertical plane $z=0$.

Figure 7

Example of $\rm MB_{\rm AND}$ counting rate as a function of the beam displacement in the horizontal direction from the van der Meer scan data taken in May 2010 at an energy of 7 TeV in pp collisions. Dots represents the raw trigger rates, and squares represents the interaction rates after corrections. The line is used to guide the eye. The integral is calculated using the sum of all bins.

Figure 8

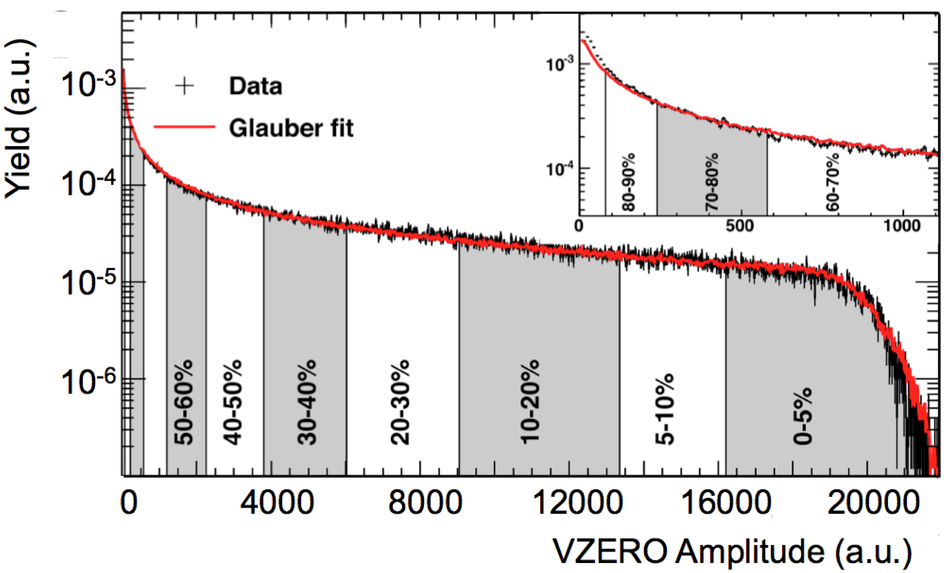
Distribution of the sum of amplitudes in the two VZERO arrays (black histogram) in Pb-Pb collisions at $\sqrt{s_{\rm NN}}=2.76$ TeV. The red line shows the fit with a Glauber model. The shaded areas define the different centrality classes of hadronic collisions. The inset shows the low amplitude part of the distribution.

Figure 9

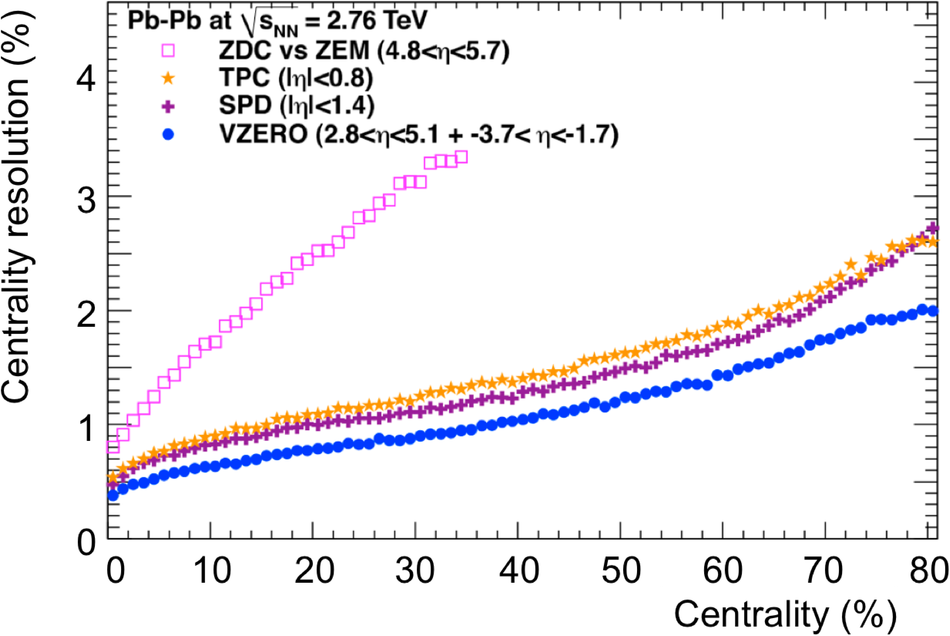
Centrality percentile resolution versus centrality for various ALICE detectors (see Figure 3).

Figure 10

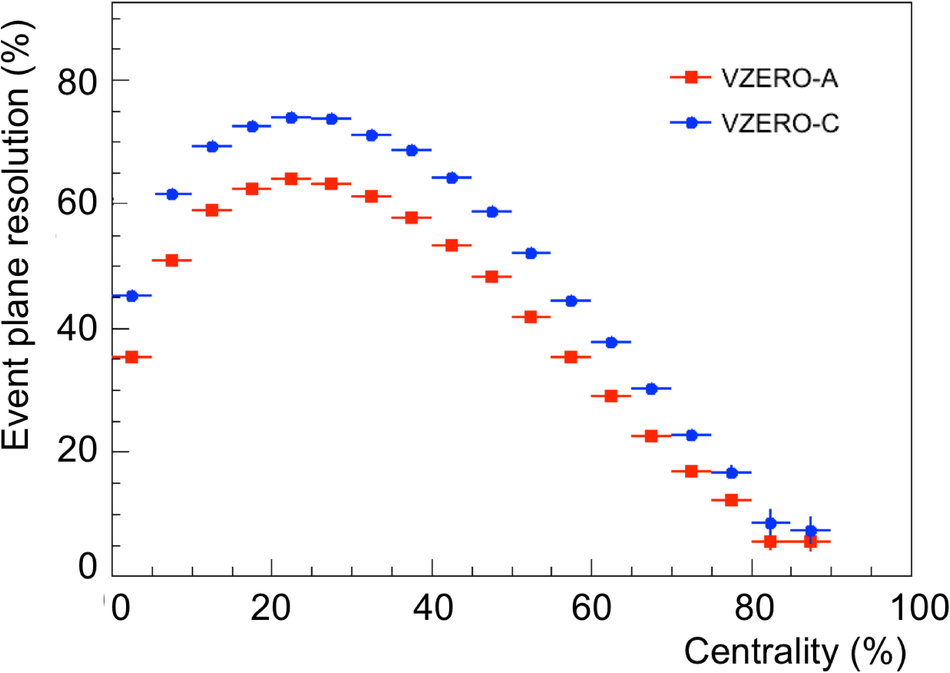
Second harmonic event plane resolution $\mathcal{R}_{\Psi_2}$ of VZERO-A and VZERO-C arrays as a function of centrality percentile.