The first measurement of the production of pions, kaons, (anti-)protons and $\phi$ mesons at midrapidity in Xe-Xe collisions at $\sqrt{s_{\rm NN}} = 5.44$ TeV is presented. Transverse momentum ($p_{\rm T}$) spectra and $p_{\rm T}$-integrated yields are extracted in several centrality intervals bridging from p-Pb to mid-central Pb-Pb collisions in terms of final-state multiplicity. The study of Xe-Xe and Pb-Pb collisions allows systems at similar charged-particle multiplicities but with different initial geometrical eccentricities to be investigated. A detailed comparison of the spectral shapes in the two systems reveals an opposite behaviour for radial and elliptic flow. In particular, this study shows that the radial flow does not depend on the colliding system when compared at similar charged-particle multiplicity. In terms of hadron chemistry, the previously observed smooth evolution of particle ratios with multiplicity from small to large collision systems is also found to hold in Xe-Xe. In addition, our results confirm that two remarkable features of particle production at LHC energies are also valid in the collision of medium-sized nuclei: the lower proton-to-pion ratio with respect to the thermal model expectations and the increase of the $\phi$-to-pion ratio with increasing final-state multiplicity.
Eur. Phys. J. C 81 (2021) 584
HEP Data
e-Print: arXiv:2101.03100 | PDF | inSPIRE
CERN-EP-2020-249
Figure group
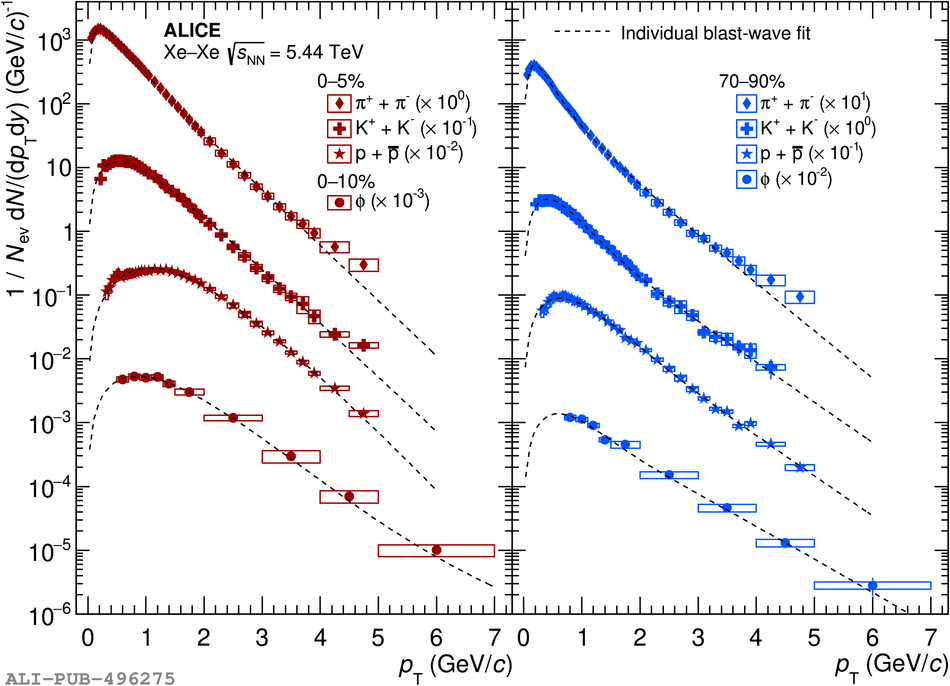

Figure 4
Left: proton-to-phi and proton-to-pion \pt-differential ratios in \centint{0}{10} central \xexe collisions at \snnXeXe and \centint{10}{20} central \pbpb collisions at \snnF Right: proton-to-phi and proton-to-pion \pt-differential ratios in \centint{50}{70} \xexe collisions at \snnXeXe and \centint{60}{70} \pbpb collisions at \snnF The two selected groups of centrality bins have similar \avdNchdeta (see text for details) The statistical and systematic uncertainties are shown as error bars and boxes around the data points The \pt-differential ratios measured in \pp collisions at \sF are also shown in the right panel for comparison The bands represent the systematic uncertainties alone | 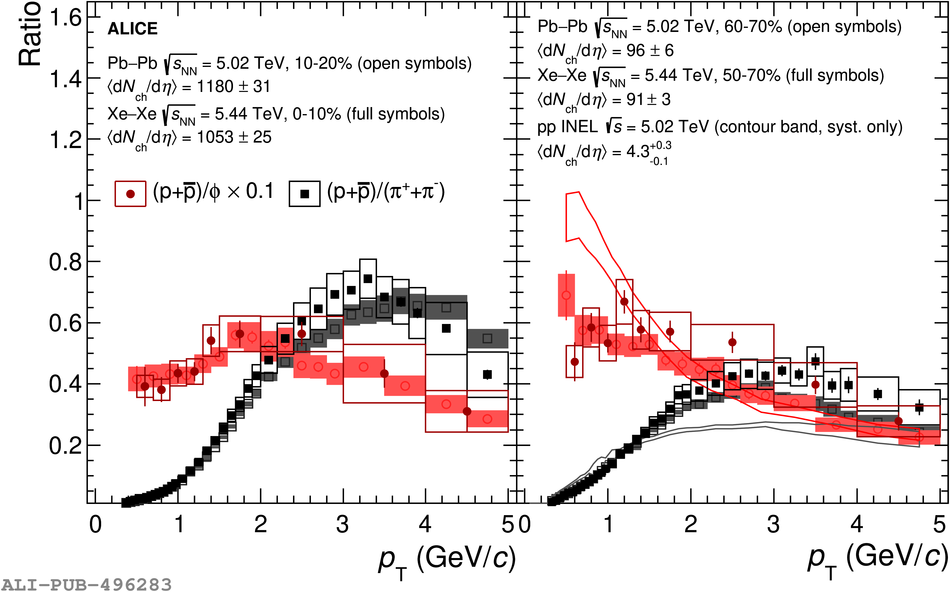 |
Figure 5
Proton-to-pion ratio as a function of charged particle multiplicity density in two \pt intervals for \xexe and \pbpb collisions at \snn = 5.44 and 5.02 TeV In the bottom panel, the flow coefficient \vtwotwo is plotted for the same collision systems as a function of charged particle multiplicity density The statistical and systematic uncertainties are shown as error bars and boxes around the data points | 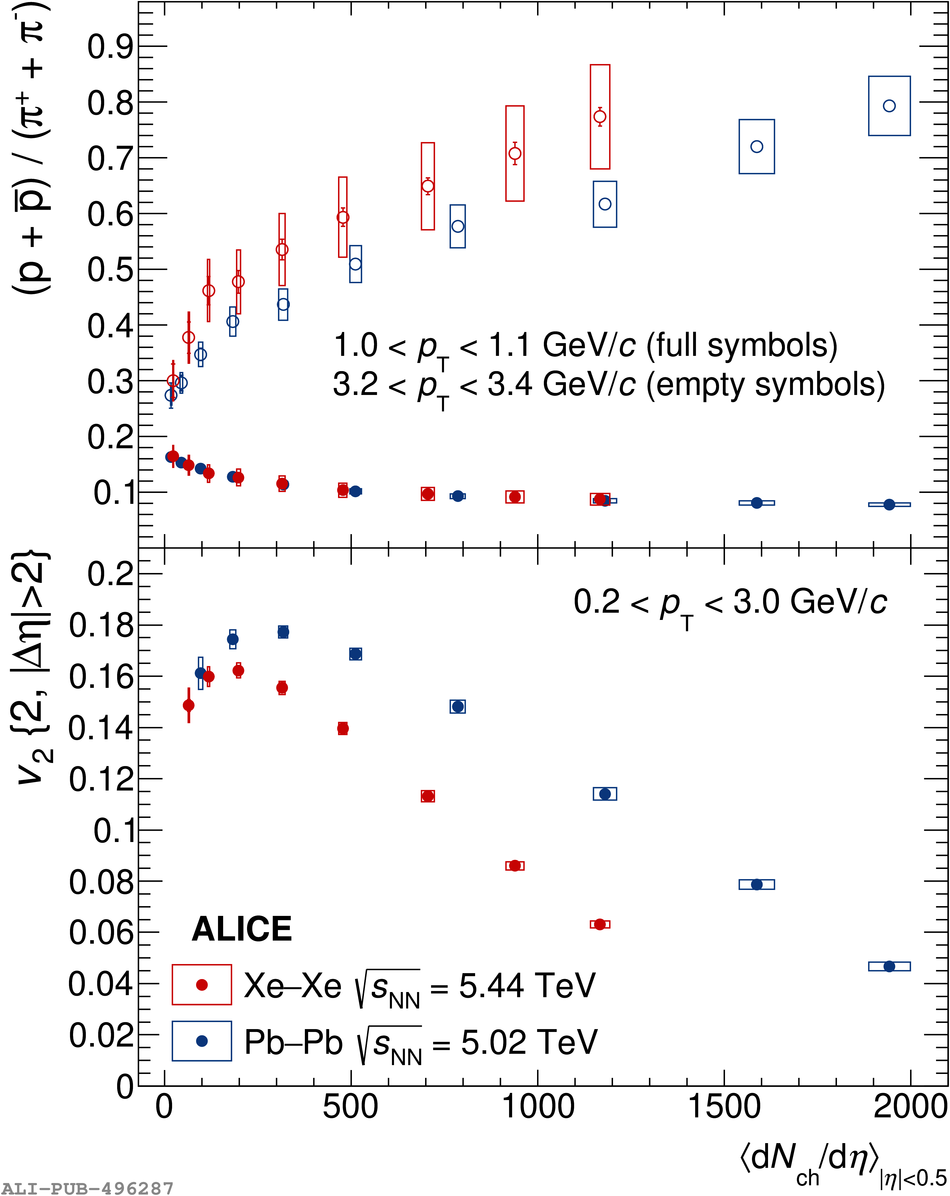 |
Figure 6
Ratio of kaon, proton and \pphi integrated yields to pion integrated yield as a function of the charged-particle multiplicity density for \xexe collisions at \snnXeXe and \pbpb collisions at \snnT and 5.02 TeV The statistical and systematic uncertainties are shown as error bars and boxes around the data points Predictions from the canonical statistical model (CSM) are shown as bands considering different correlation volumes (based on ) and chemical freeze-out temperatures The correlation volume indicates the volume over which the strangeness conservation is imposed |  |