Left: proton-to-phi and proton-to-pion \pt-differential ratios in \centint{0}{10} central \xexe collisions at \snnXeXe and \centint{10}{20} central \pbpb collisions at \snnF Right: proton-to-phi and proton-to-pion \pt-differential ratios in \centint{50}{70} \xexe collisions at \snnXeXe and \centint{60}{70} \pbpb collisions at \snnF The two selected groups of centrality bins have similar \avdNchdeta (see text for details) The statistical and systematic uncertainties are shown as error bars and boxes around the data points The \pt-differential ratios measured in \pp collisions at \sF are also shown in the right panel for comparison The bands represent the systematic uncertainties alone | 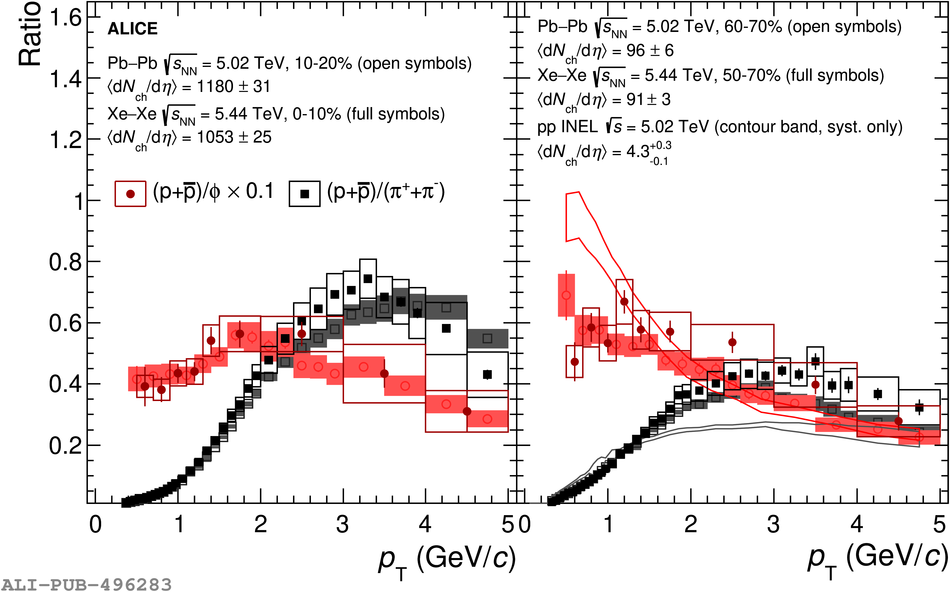 |