The production of J/$\psi$ is measured at midrapidity ($|y|<~0.9$) in proton-proton collisions at $\sqrt{s}$ = 5.02 and 13 TeV, through the dielectron decay channel, using the ALICE detector at the Large Hadron Collider. The data sets used for the analyses correspond to integrated luminosities of $\mathcal{L}_{\rm int}$ = 19.4 $\pm$ 0.4 nb$^{-1}$ and $\mathcal{L}_{\rm int}$ = 32.2 $\pm$ 0.5 nb$^{-1}$ at $\sqrt{s}$ = 5.02 and 13 TeV, respectively. The fraction of non-prompt J/$\psi$ mesons, i.e. those originating from the decay of beauty hadrons, is measured down to a transverse momentum $p_{\rm T}$ = 2 GeV/$c$ (1 GeV/$c$) at $\sqrt{s}$ = 5.02 TeV (13 TeV). The $p_{\rm T}$ and rapidity ($y$) differential cross sections, as well as the corresponding values integrated over $p_{\rm T}$ and $y$, are carried out separately for prompt and non-prompt J/$\psi$ mesons. The results are compared with measurements from other experiments and theoretical calculations based on quantum chromodynamics (QCD). The shapes of the $p_{\rm T}$ and $y$ distributions of beauty quarks predicted by state-of-the-art perturbative QCD models are used to extrapolate an estimate of the $\rm b\overline{b}$ pair cross section at midrapidity and in the total phase space. The total $\rm b\overline{b}$ cross sections are found to be $\sigma_{\rm b \overline{\rm b}} = 541 \pm 45 (\rm stat.) \pm 69 (\rm syst.)_{-12}^{+10} (\rm extr.)~{\rm \mu b}$ and $\sigma_{\rm b \overline{\rm b}}~=~218 \pm 37 (\rm stat.) \pm 31 (\rm syst.)_{-9.1}^{+8.2} (\rm extr.)~{\rm \mu b}$ at $\sqrt{s}$ = 13 and 5.02 TeV, respectively. The value obtained from the combination of ALICE and LHCb measurements in pp collisions at $\sqrt{s}$ = 13 TeV is also provided.
JHEP 03 (2022) 190
HEP Data
e-Print: arXiv:2108.02523 | PDF | inSPIRE
CERN-EP-2021-152
Figure group
Figure 1
Invariant mass (left panels) and pseudoproper decay length (right panels) distributions for \pJPsi candidates at midrapidity with superimposed projections of the maximum likelihood fit. Pseudoproper decay length distributions are shown for \pJPsi candidates reconstructed under the \pJPsi mass peak, i.e. for $2.92 < \mee < 3.16$ \GeVmass, for display purposes only. The distributions refer to the \pt-integrated case, in particular the upper (lower) panels show the distributions for \pt\ $>$ 1 (2) \GeVc in pp collisions at \s = 13 (5.02) TeV. The $\chi^{2}$ values, which are computed considering the binned distributions of data points and the corresponding projections of the total fit function, are also reported. | 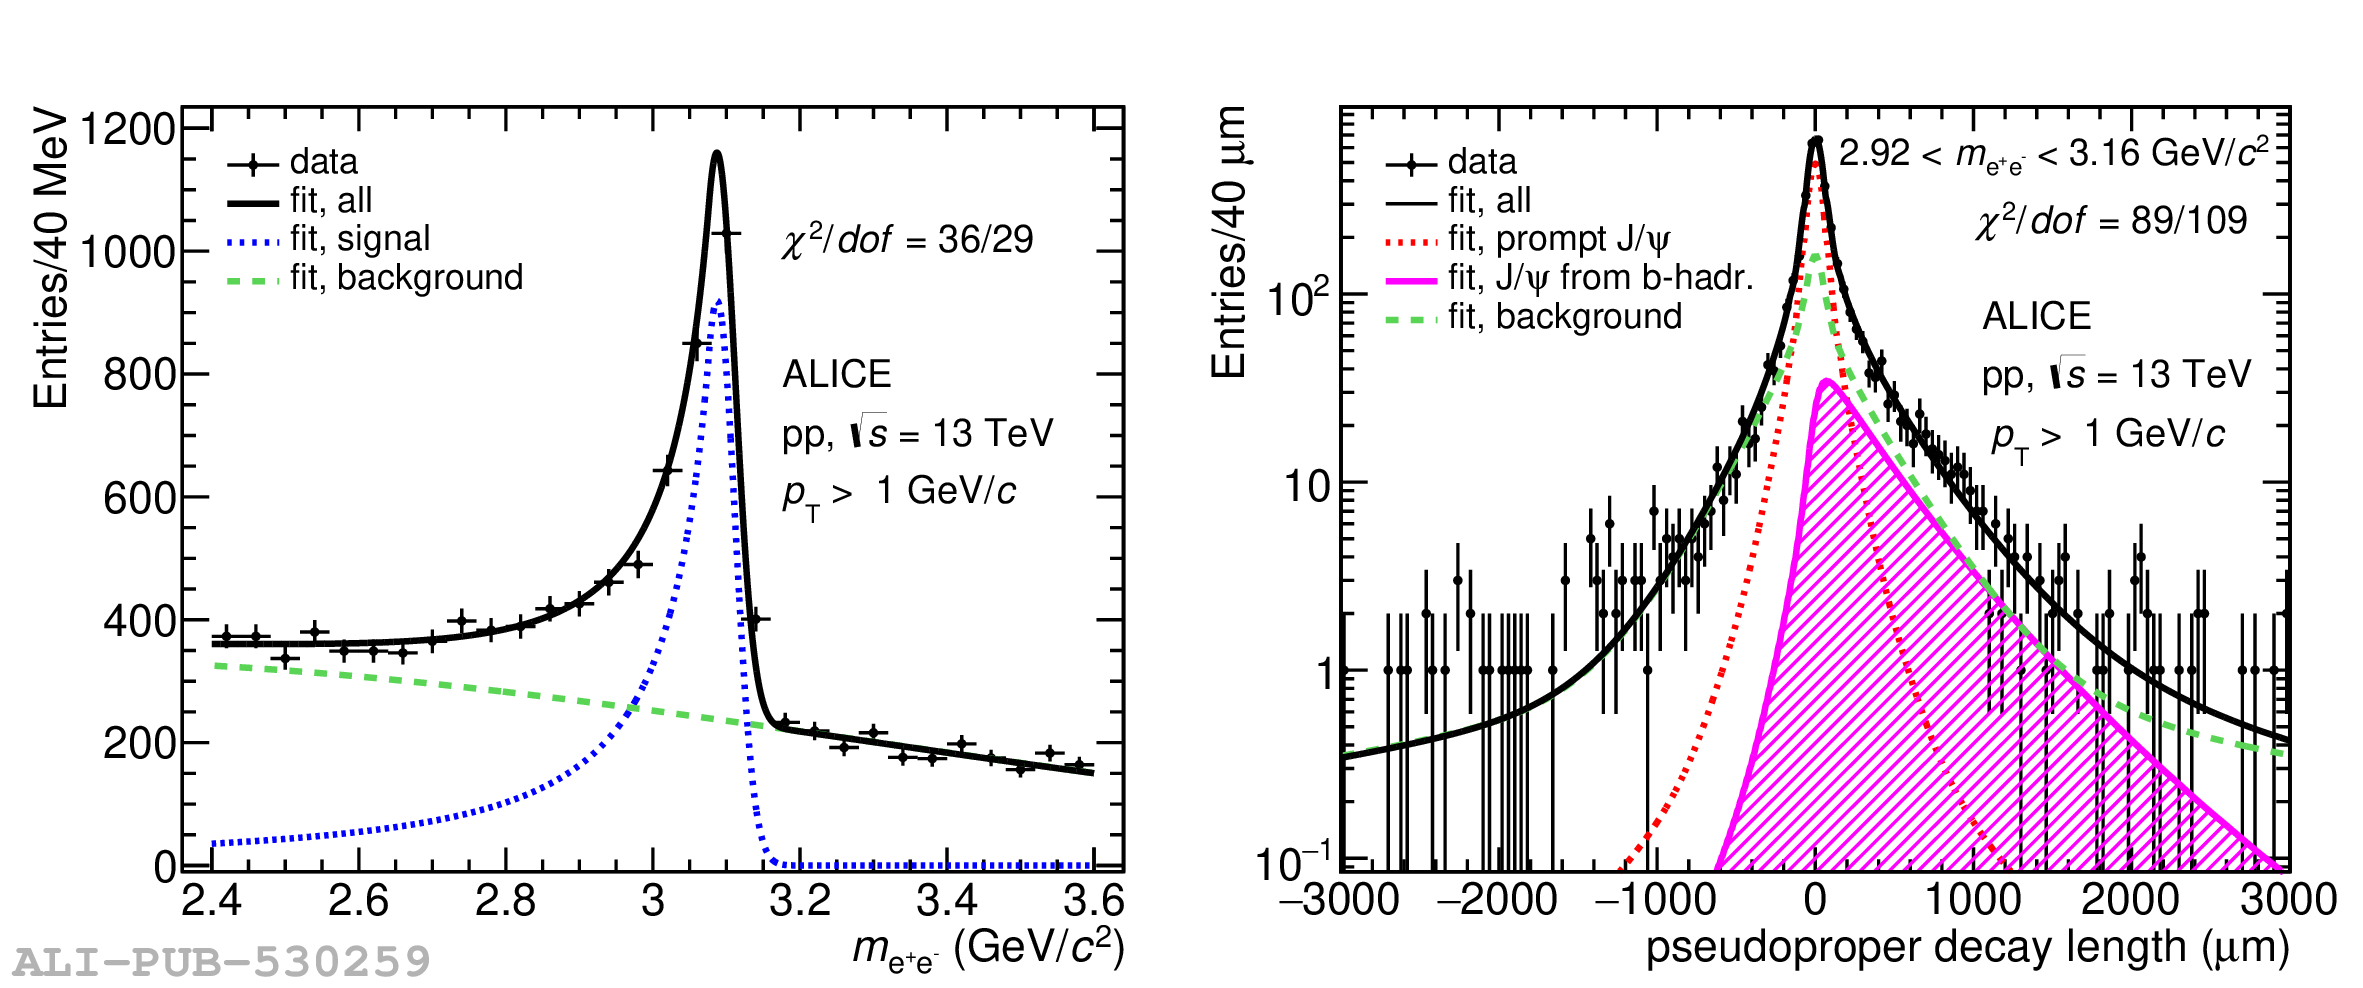 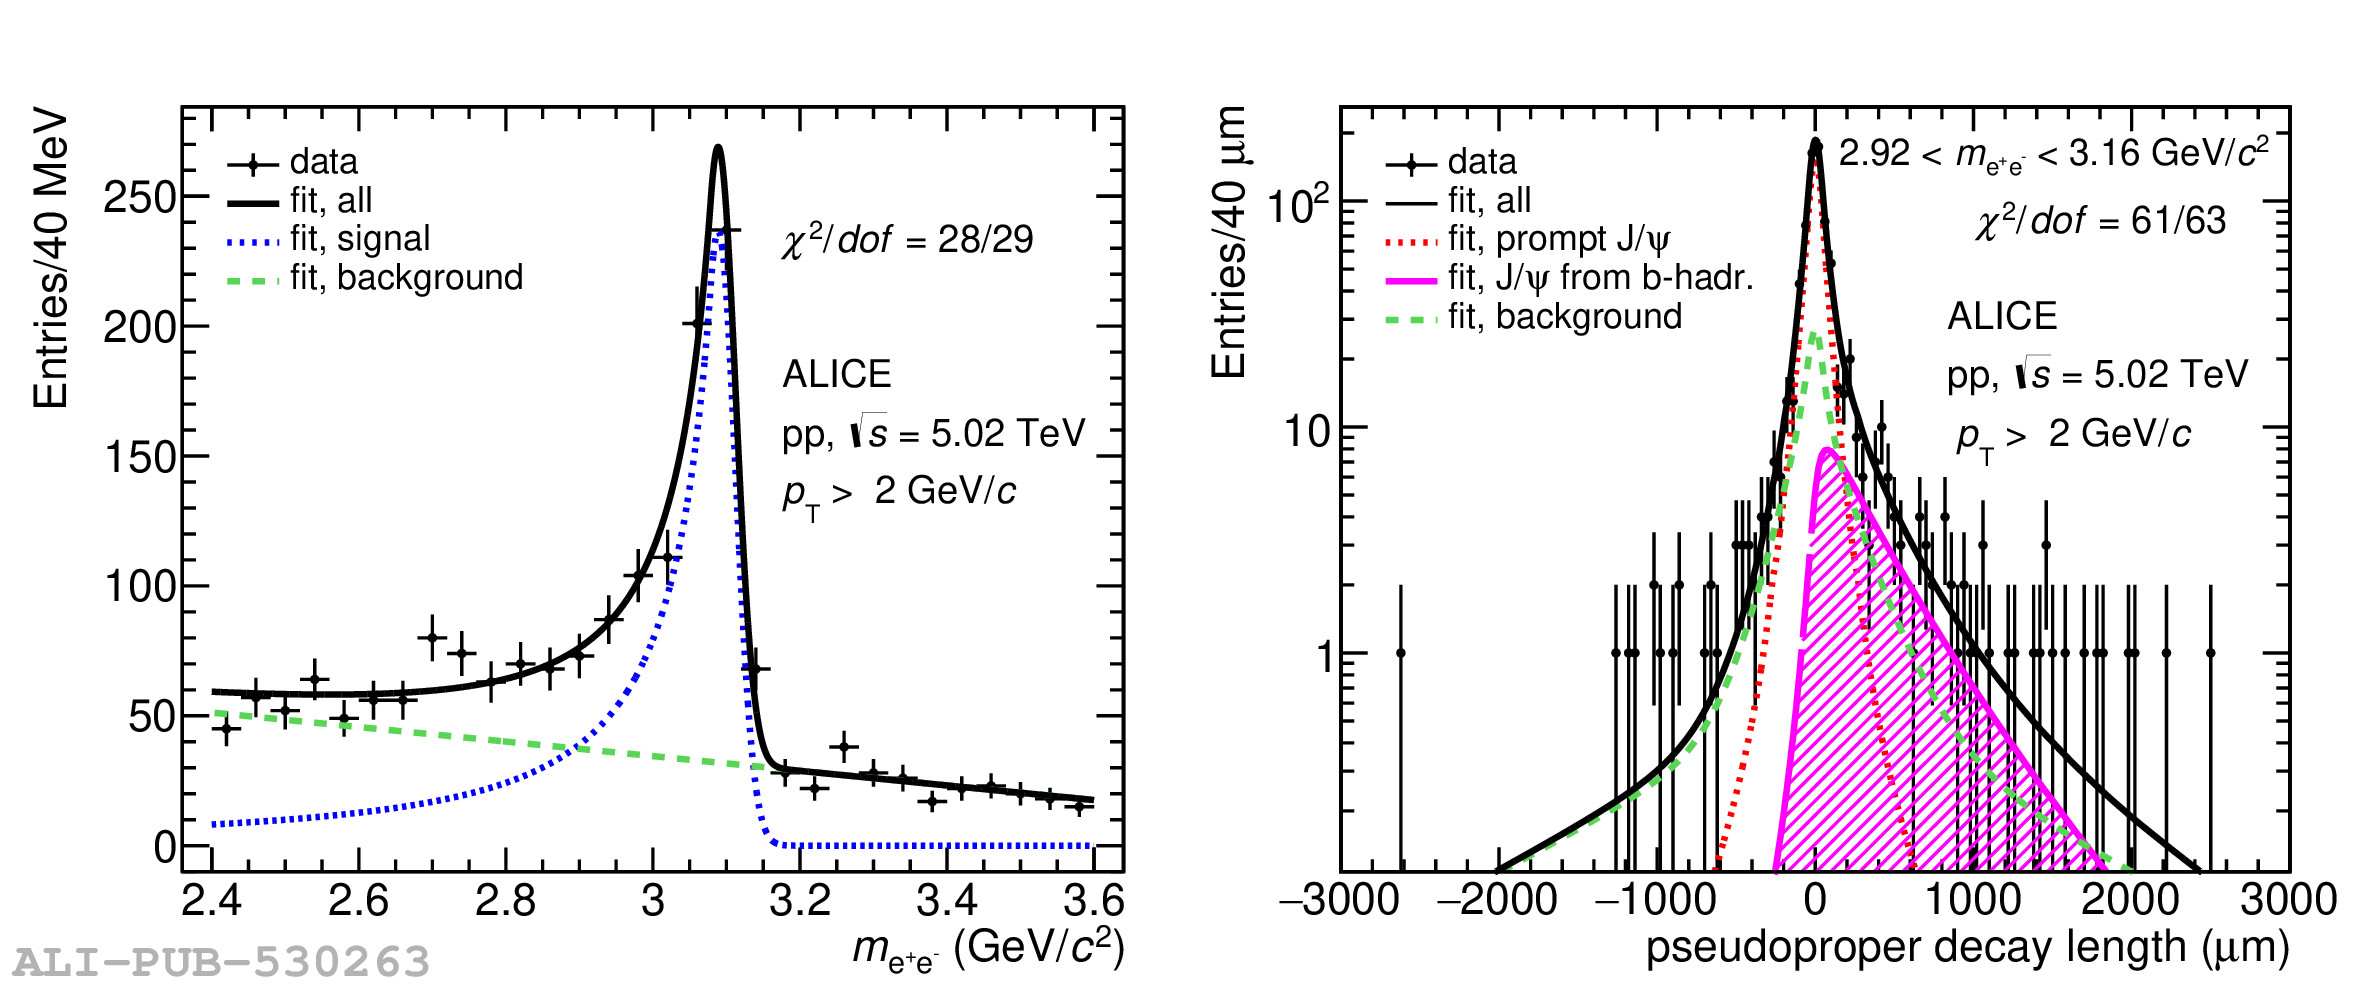 |
Figure 2
Non-prompt \pJPsi fraction as a function of \pt measured by the ALICE collaboration in pp collisions at \s = 13 TeV (left panel) and 5.02 TeV (right panel) compared with similar results obtained at midrapidity in \pp collisions at the LHC, namely CMS and ATLAS . The results from CDF in proton\textendash antiproton collisions at \s = 1.96 TeV are also shown in both panels. Error bars correspond to the quadratic sum of statistical and systematic uncertainties. | 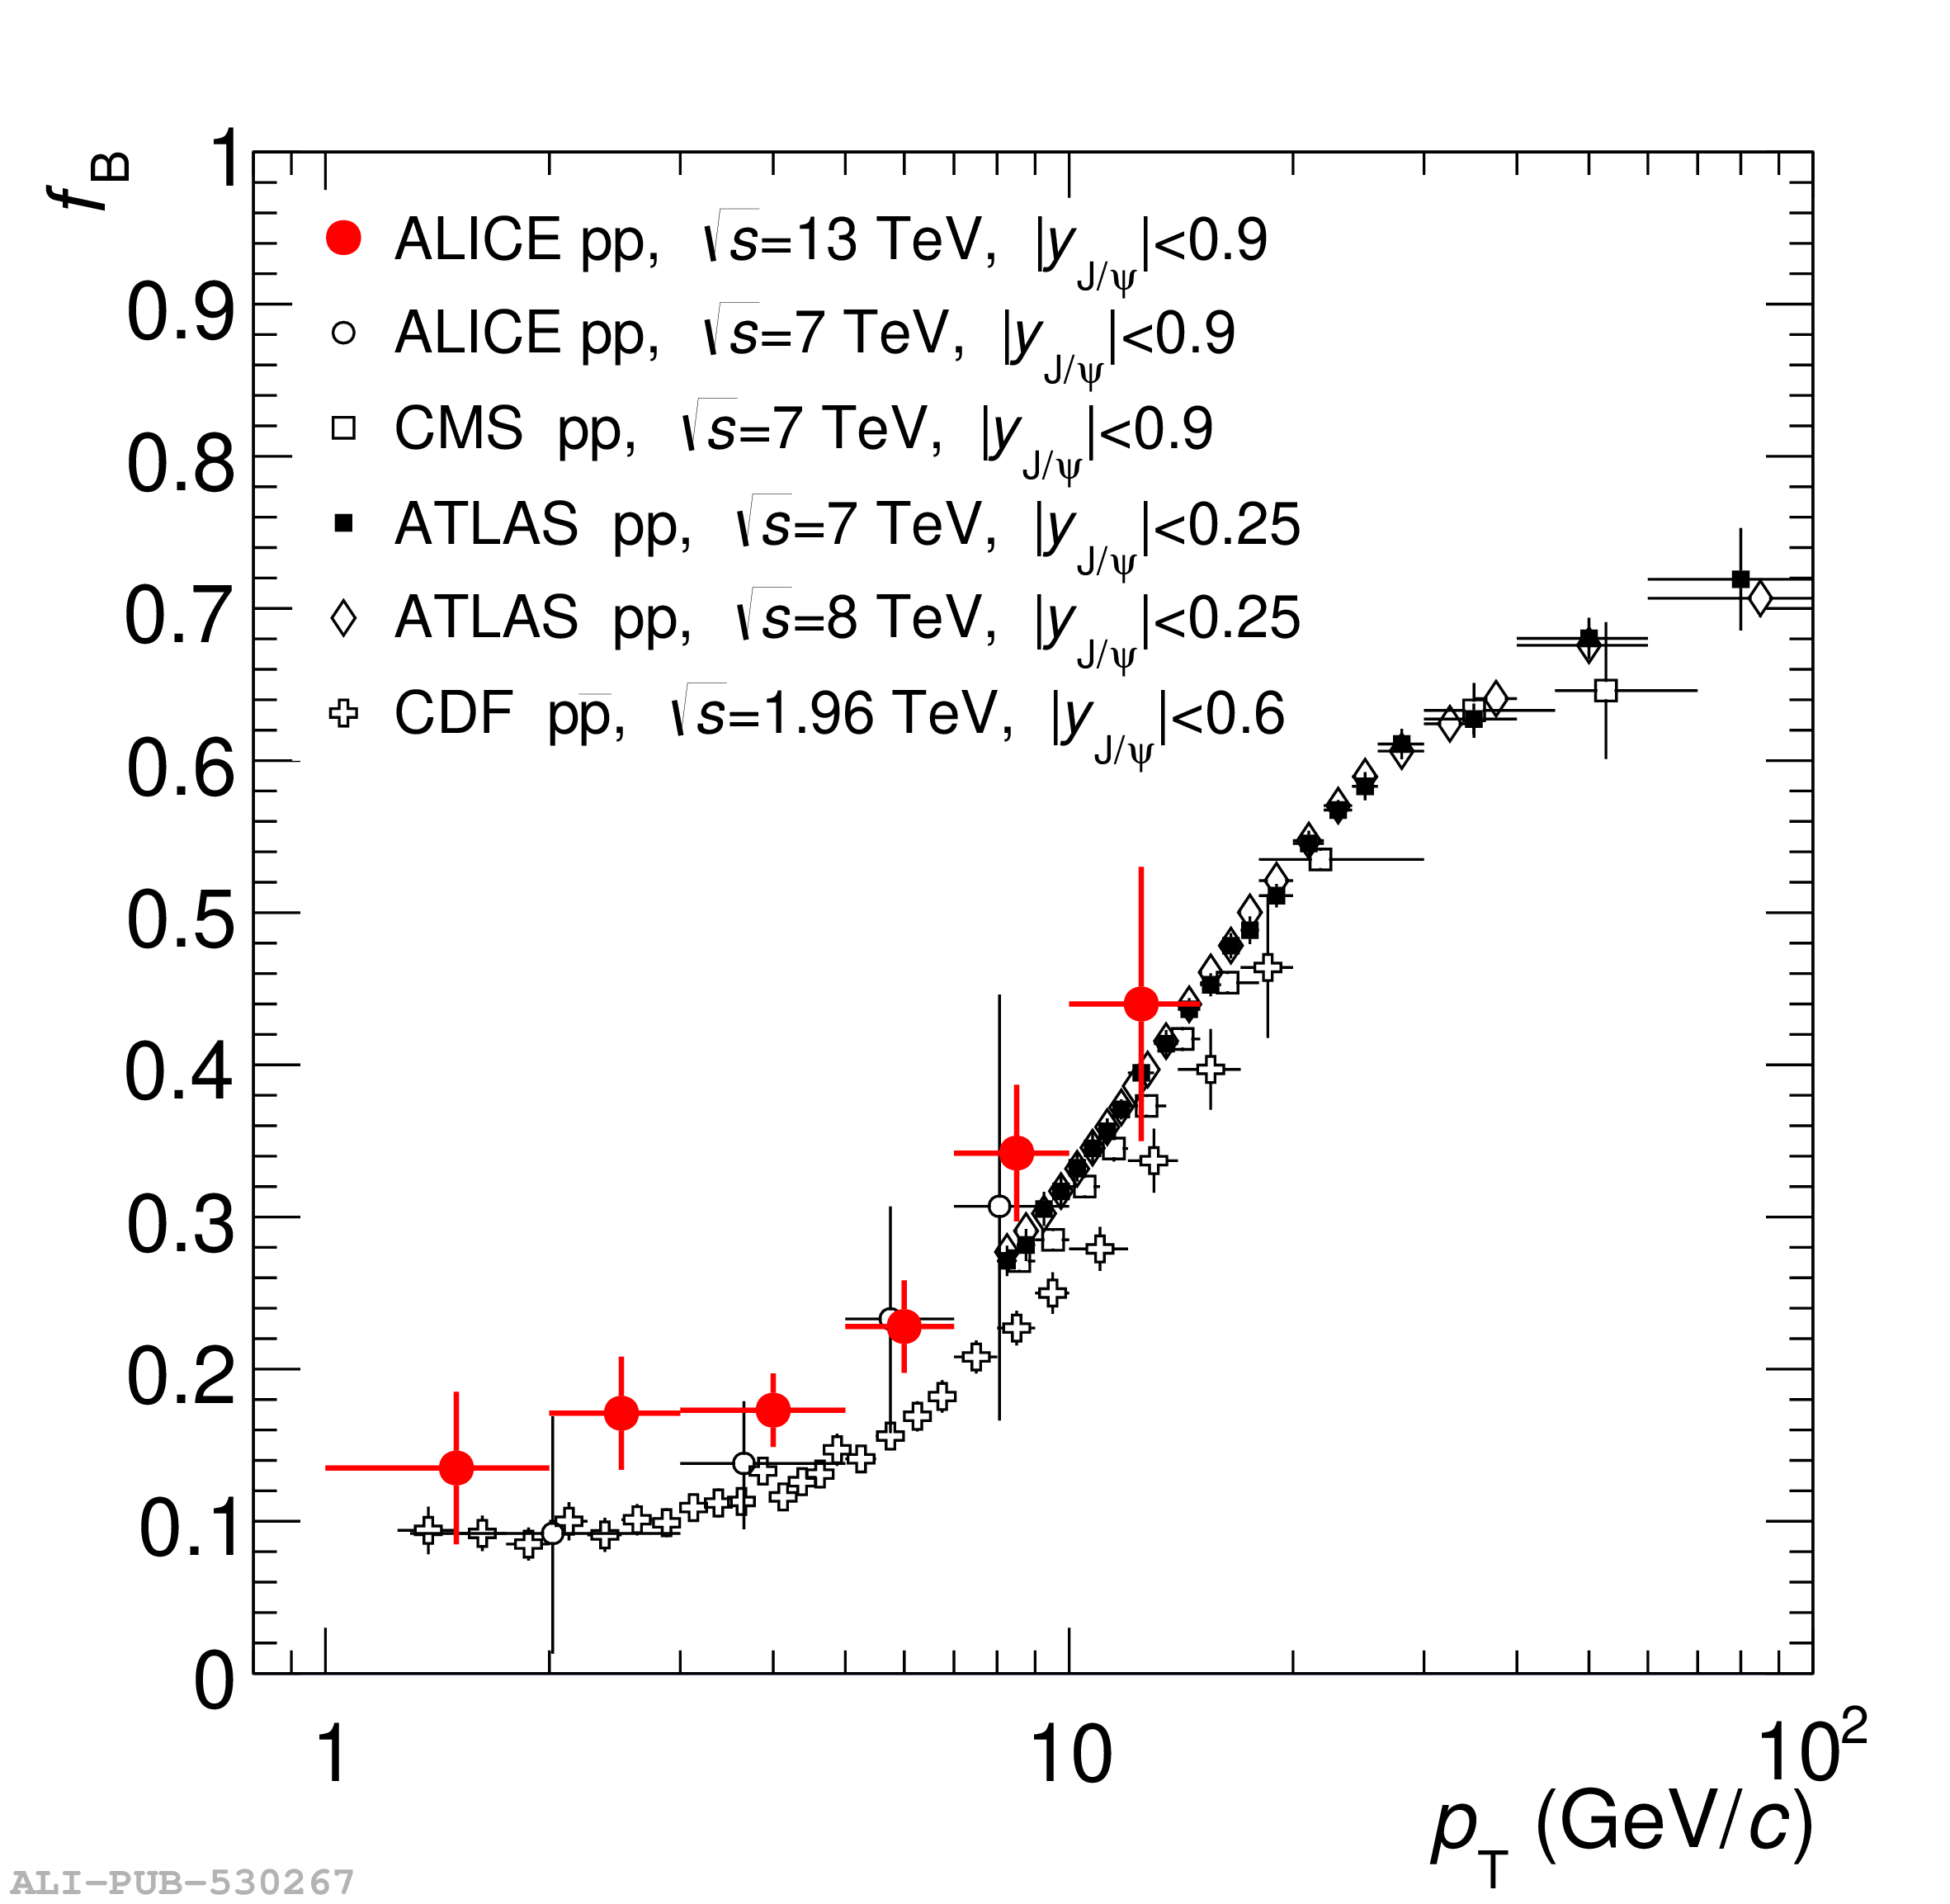 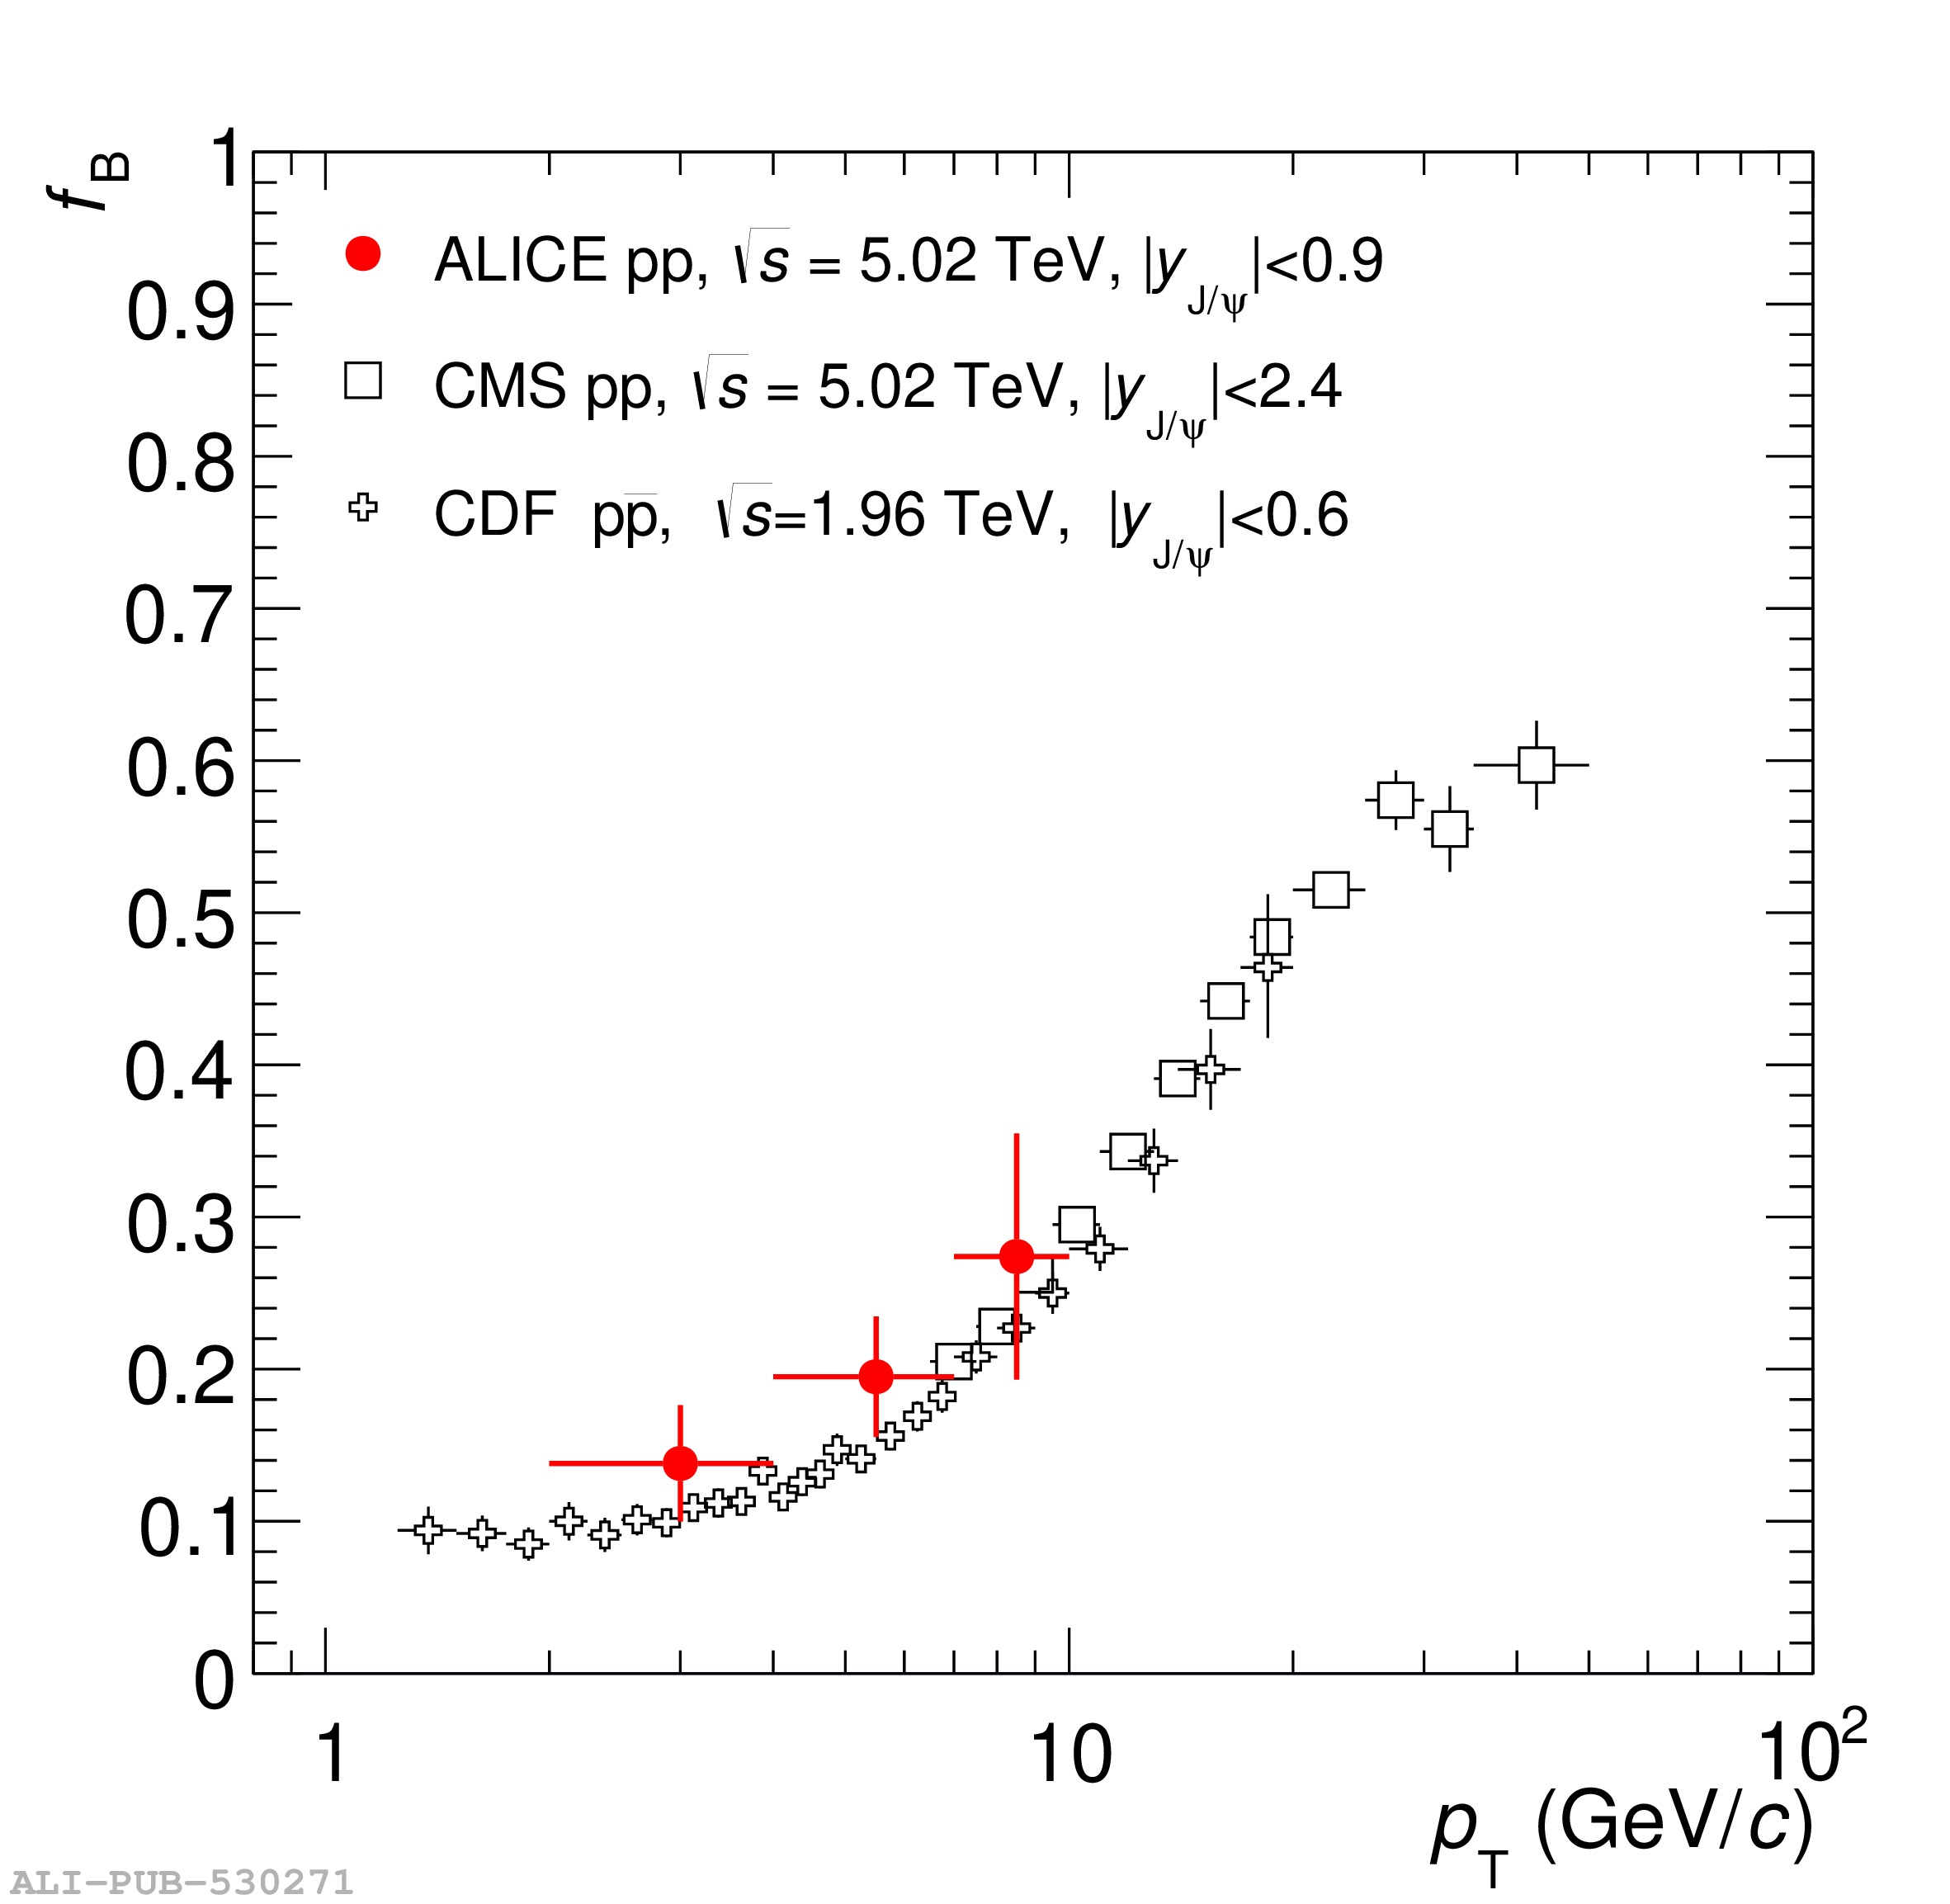 |
Figure 3
The $\frac{{\rm d}^2\sigma}{{\rm d}y {\rm d}\pt}$ of non-prompt \pJPsi\ in pp collisions at $\sqrt{s}$ = 13 TeV (left panel) and 5.02 TeV (right panel) as a function of \pt. The measurement at \s = 5.02 TeV is compared with similar measurements from CMS and ATLAS collaborations at high \pt The error bars (boxes) represent the statistical (systematic) uncertainties. Uncertainties due to the luminosity are not included in the boxes. The results are compared with the FONLL calculations at both energies. Bottom panels show the ratios FONLL to ALICE data. The uncertainty band represents the relative uncertainty from the model whereas the bars and boxes centered around unity refer to relative statistical and systematic uncertainties on ALICE data points, respectively. |  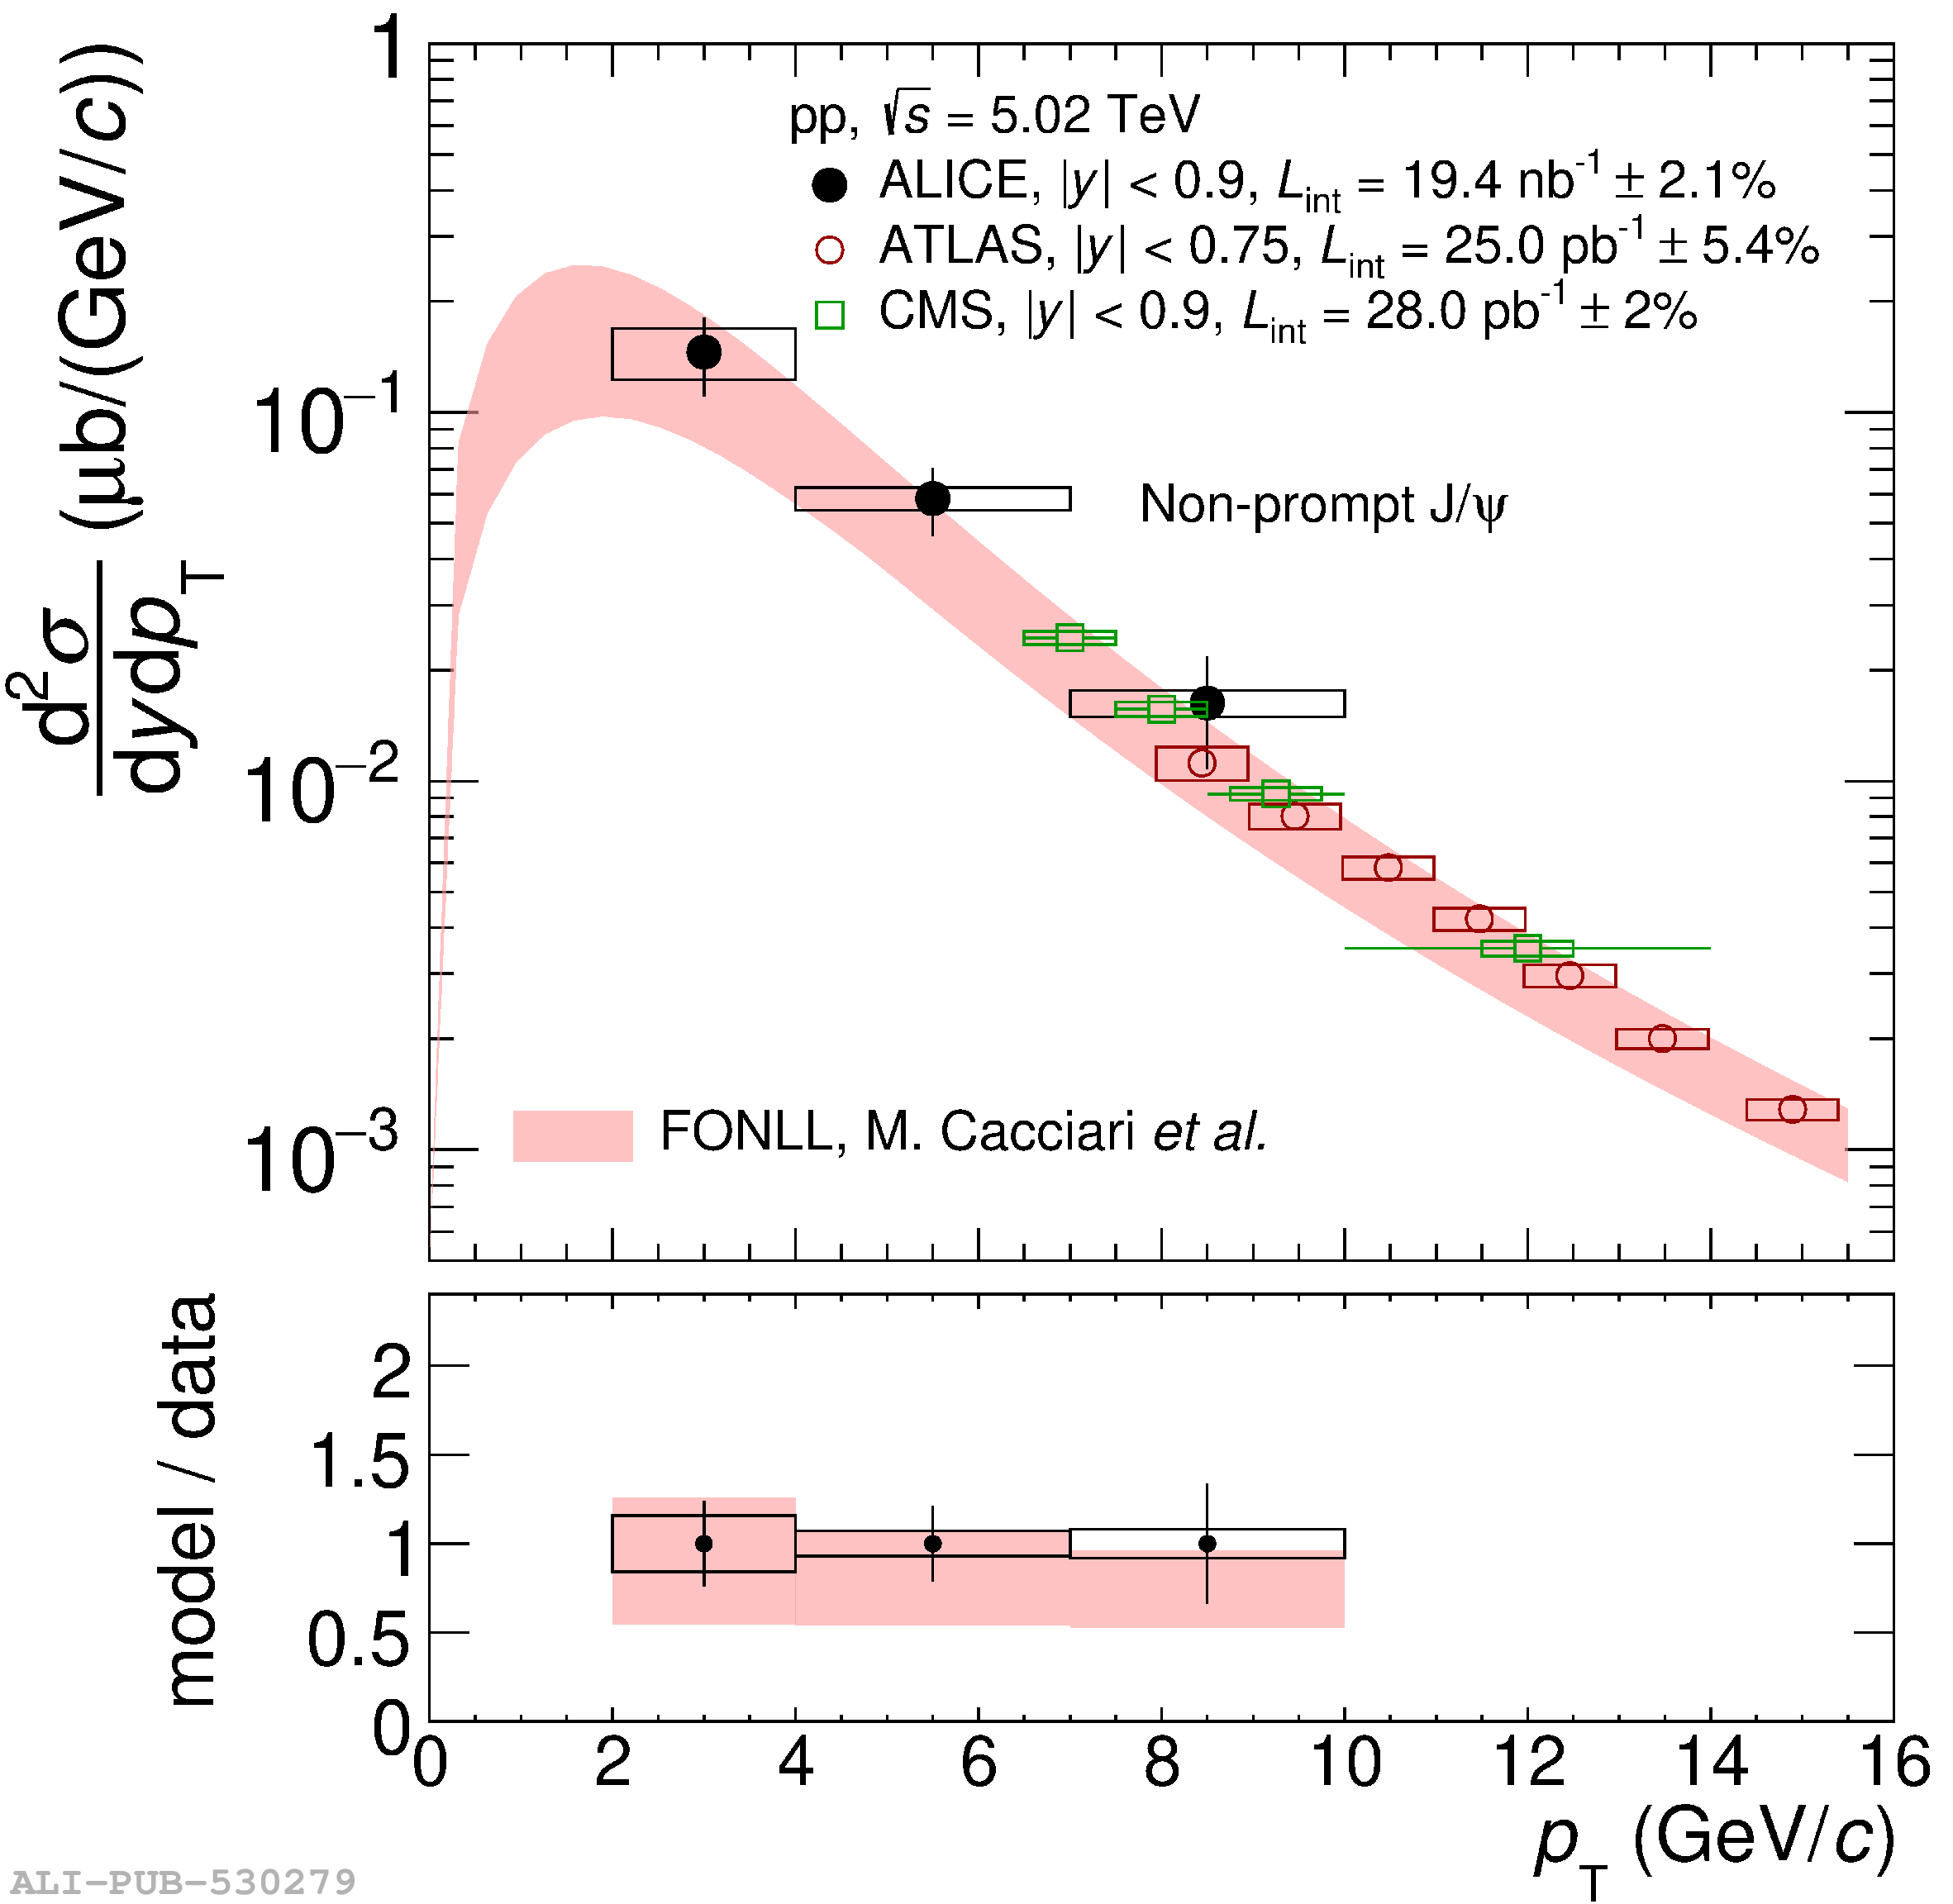 |
Figure 4
The $\frac{{\rm d}^2\sigma}{{\rm d}y {\rm d}\pt}$ of prompt \pJPsi measured by the ALICE collaboration in pp collisions at \s = 13 TeV (left panel) and \s = 5.02 TeV (right panel). The error bars (boxes) represent the statistical (systematic) uncertainty. The results at \s = 5.02 TeV are compared with similar measurements from CMS and ATLAS at high \pt. Uncertainties due to the luminosity are not included in the boxes. The results are compared with calculations from NLO NRQCD , NRQCD+CGC , and from ICEM . Bottom panels show the ratios of the models to ALICE results. The uncertainty bands represent the relative uncertainty from each model whereas the bars and boxes centered around unity refer to relative statistical and systematic uncertainties on ALICE data points, respectively. | 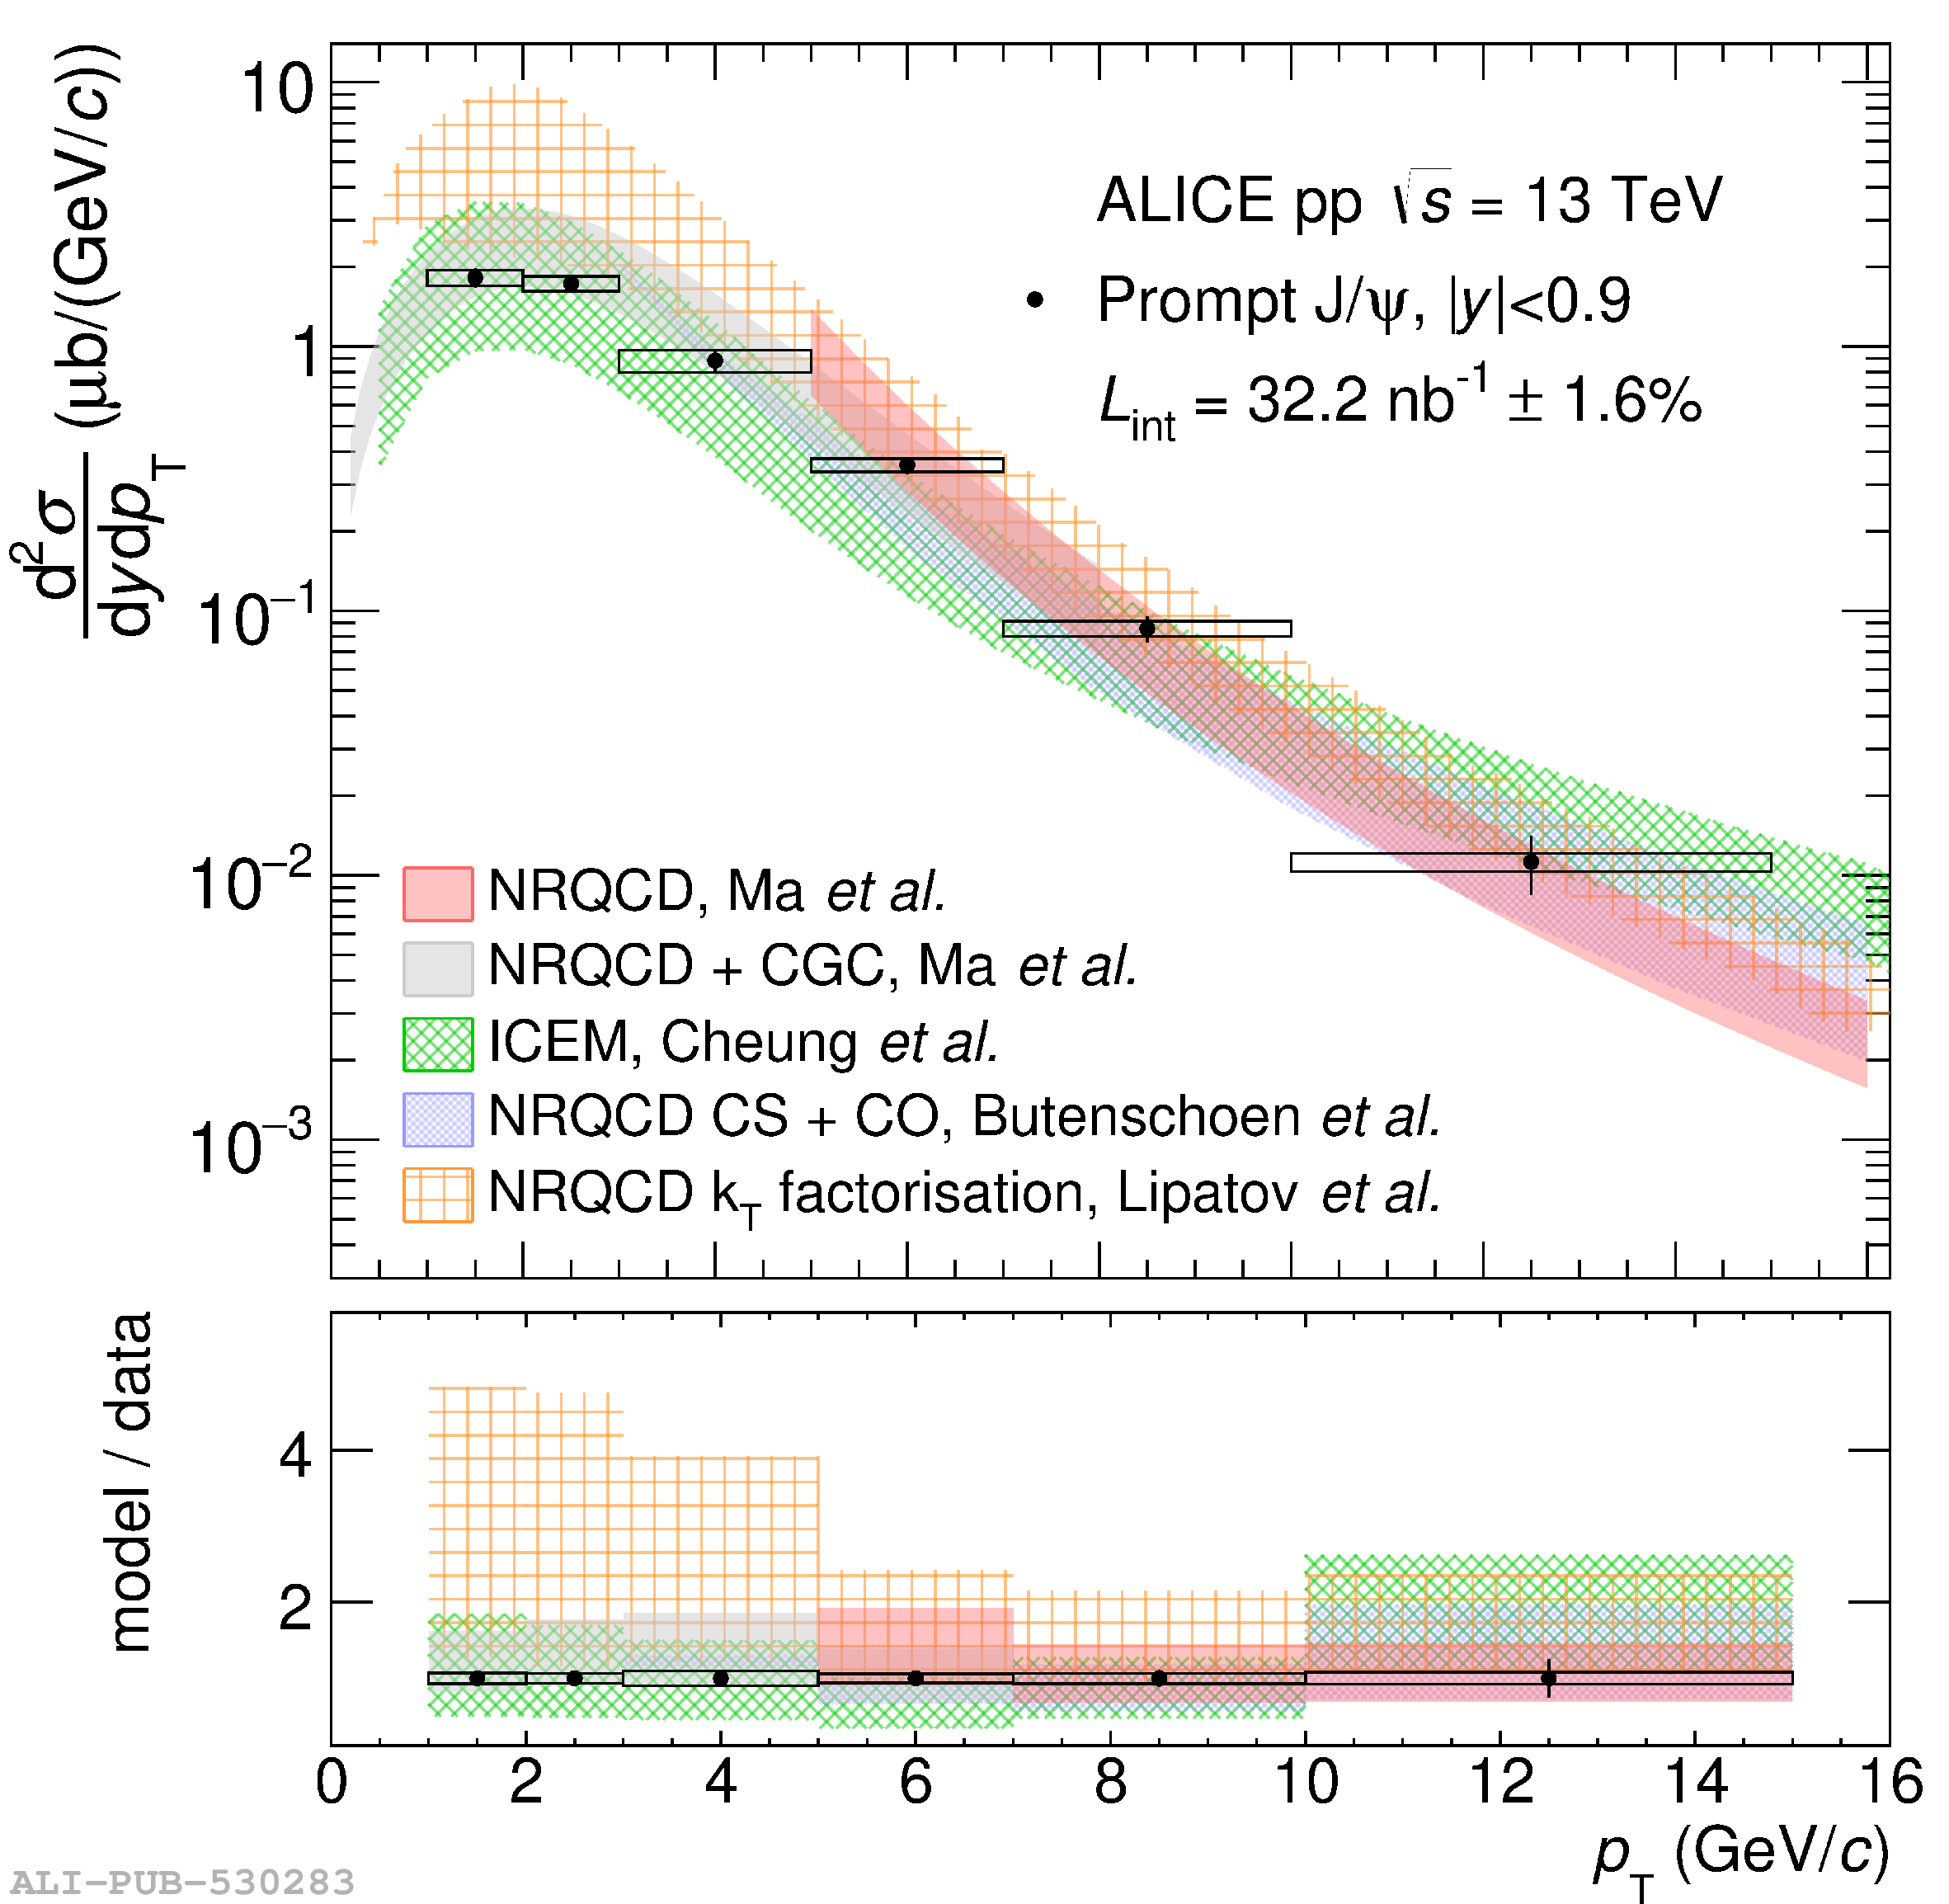 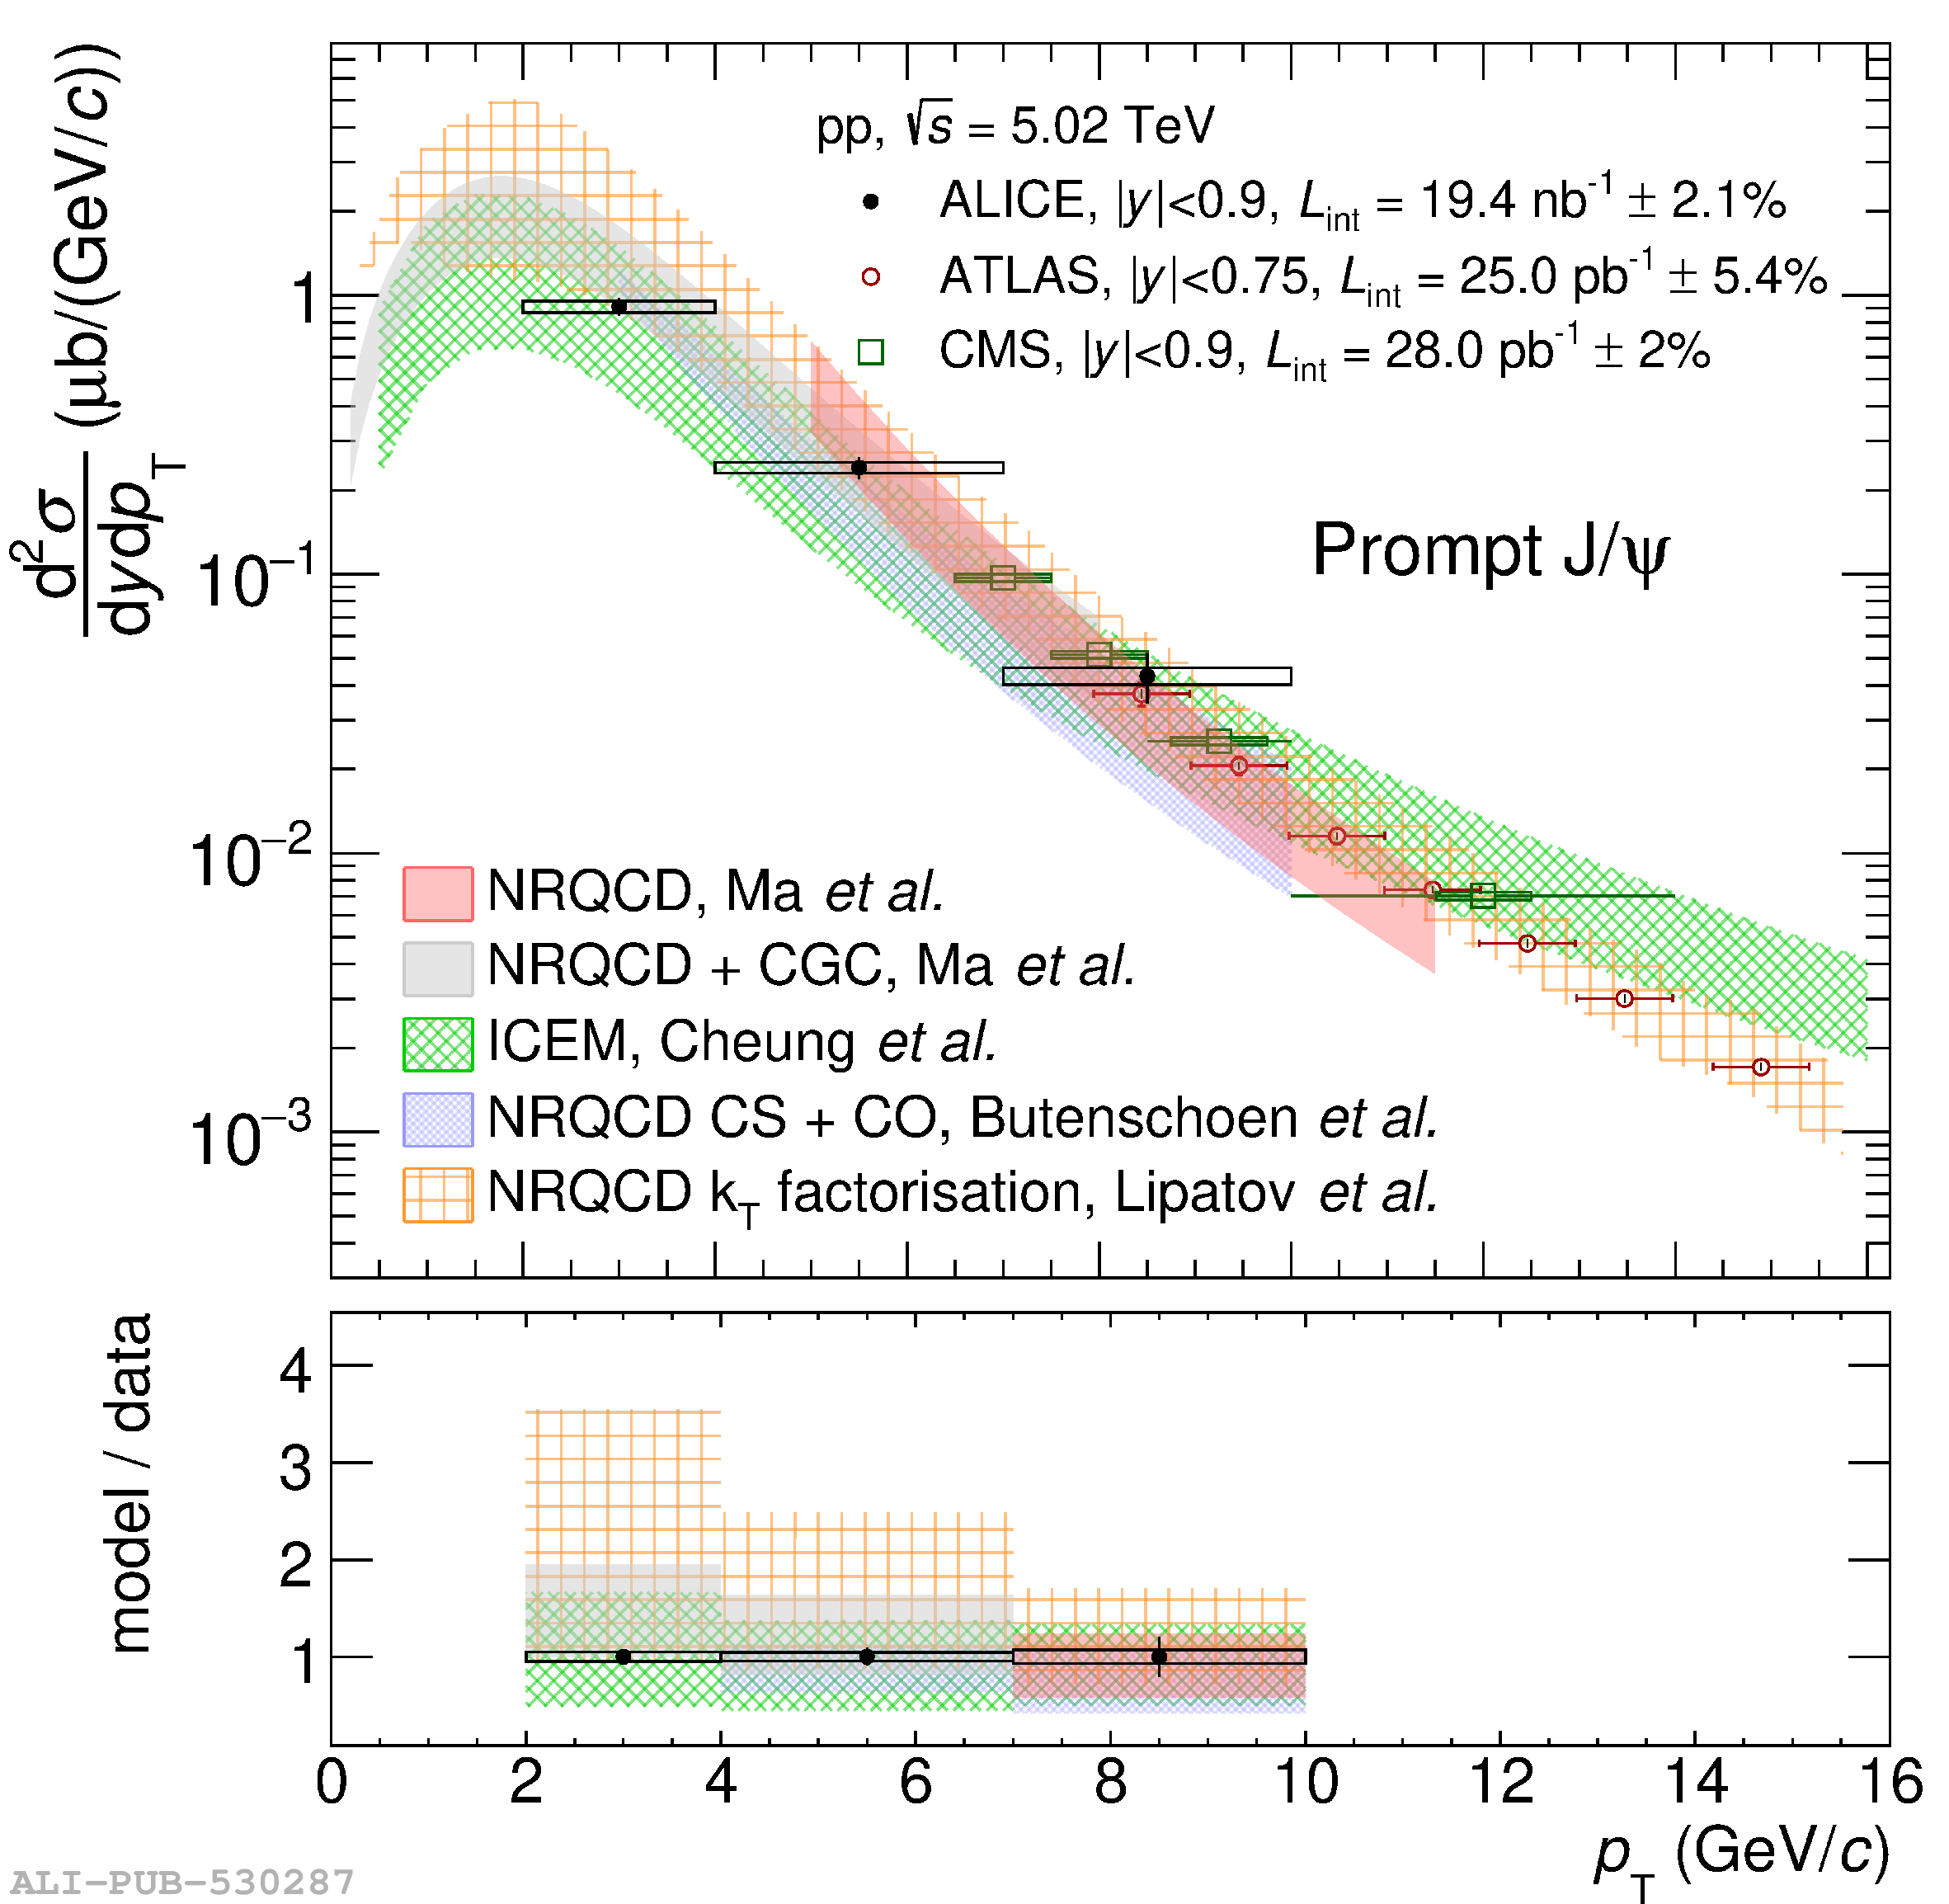 |
Figure 5
Left panel: the $\frac{{\rm d}\sigma}{{\rm d}y}$ of non-prompt \pJPsi extrapolated down to \pt\ = 0 at midrapidity computed by the ALICE collaboration compared with similar measurements in pp collisions at \s = 13 TeV carried out at forward rapidity by the LHCb collaboration Right panel: the $\frac{{\rm d}\sigma}{{\rm d}y}$ of prompt \pJPsi as a function of the rapidity in \pp collisions at \s = 13 TeV. The results close to midrapidity are based on the ALICE measurements extrapolated down to \pt = 0, and closed (open) symbols represent measured (reflected) data points (see text for details). Similar results obtained by the LHCb collaboration at forward rapidity are shown as well. The theoretical calculations are from Refs. . | 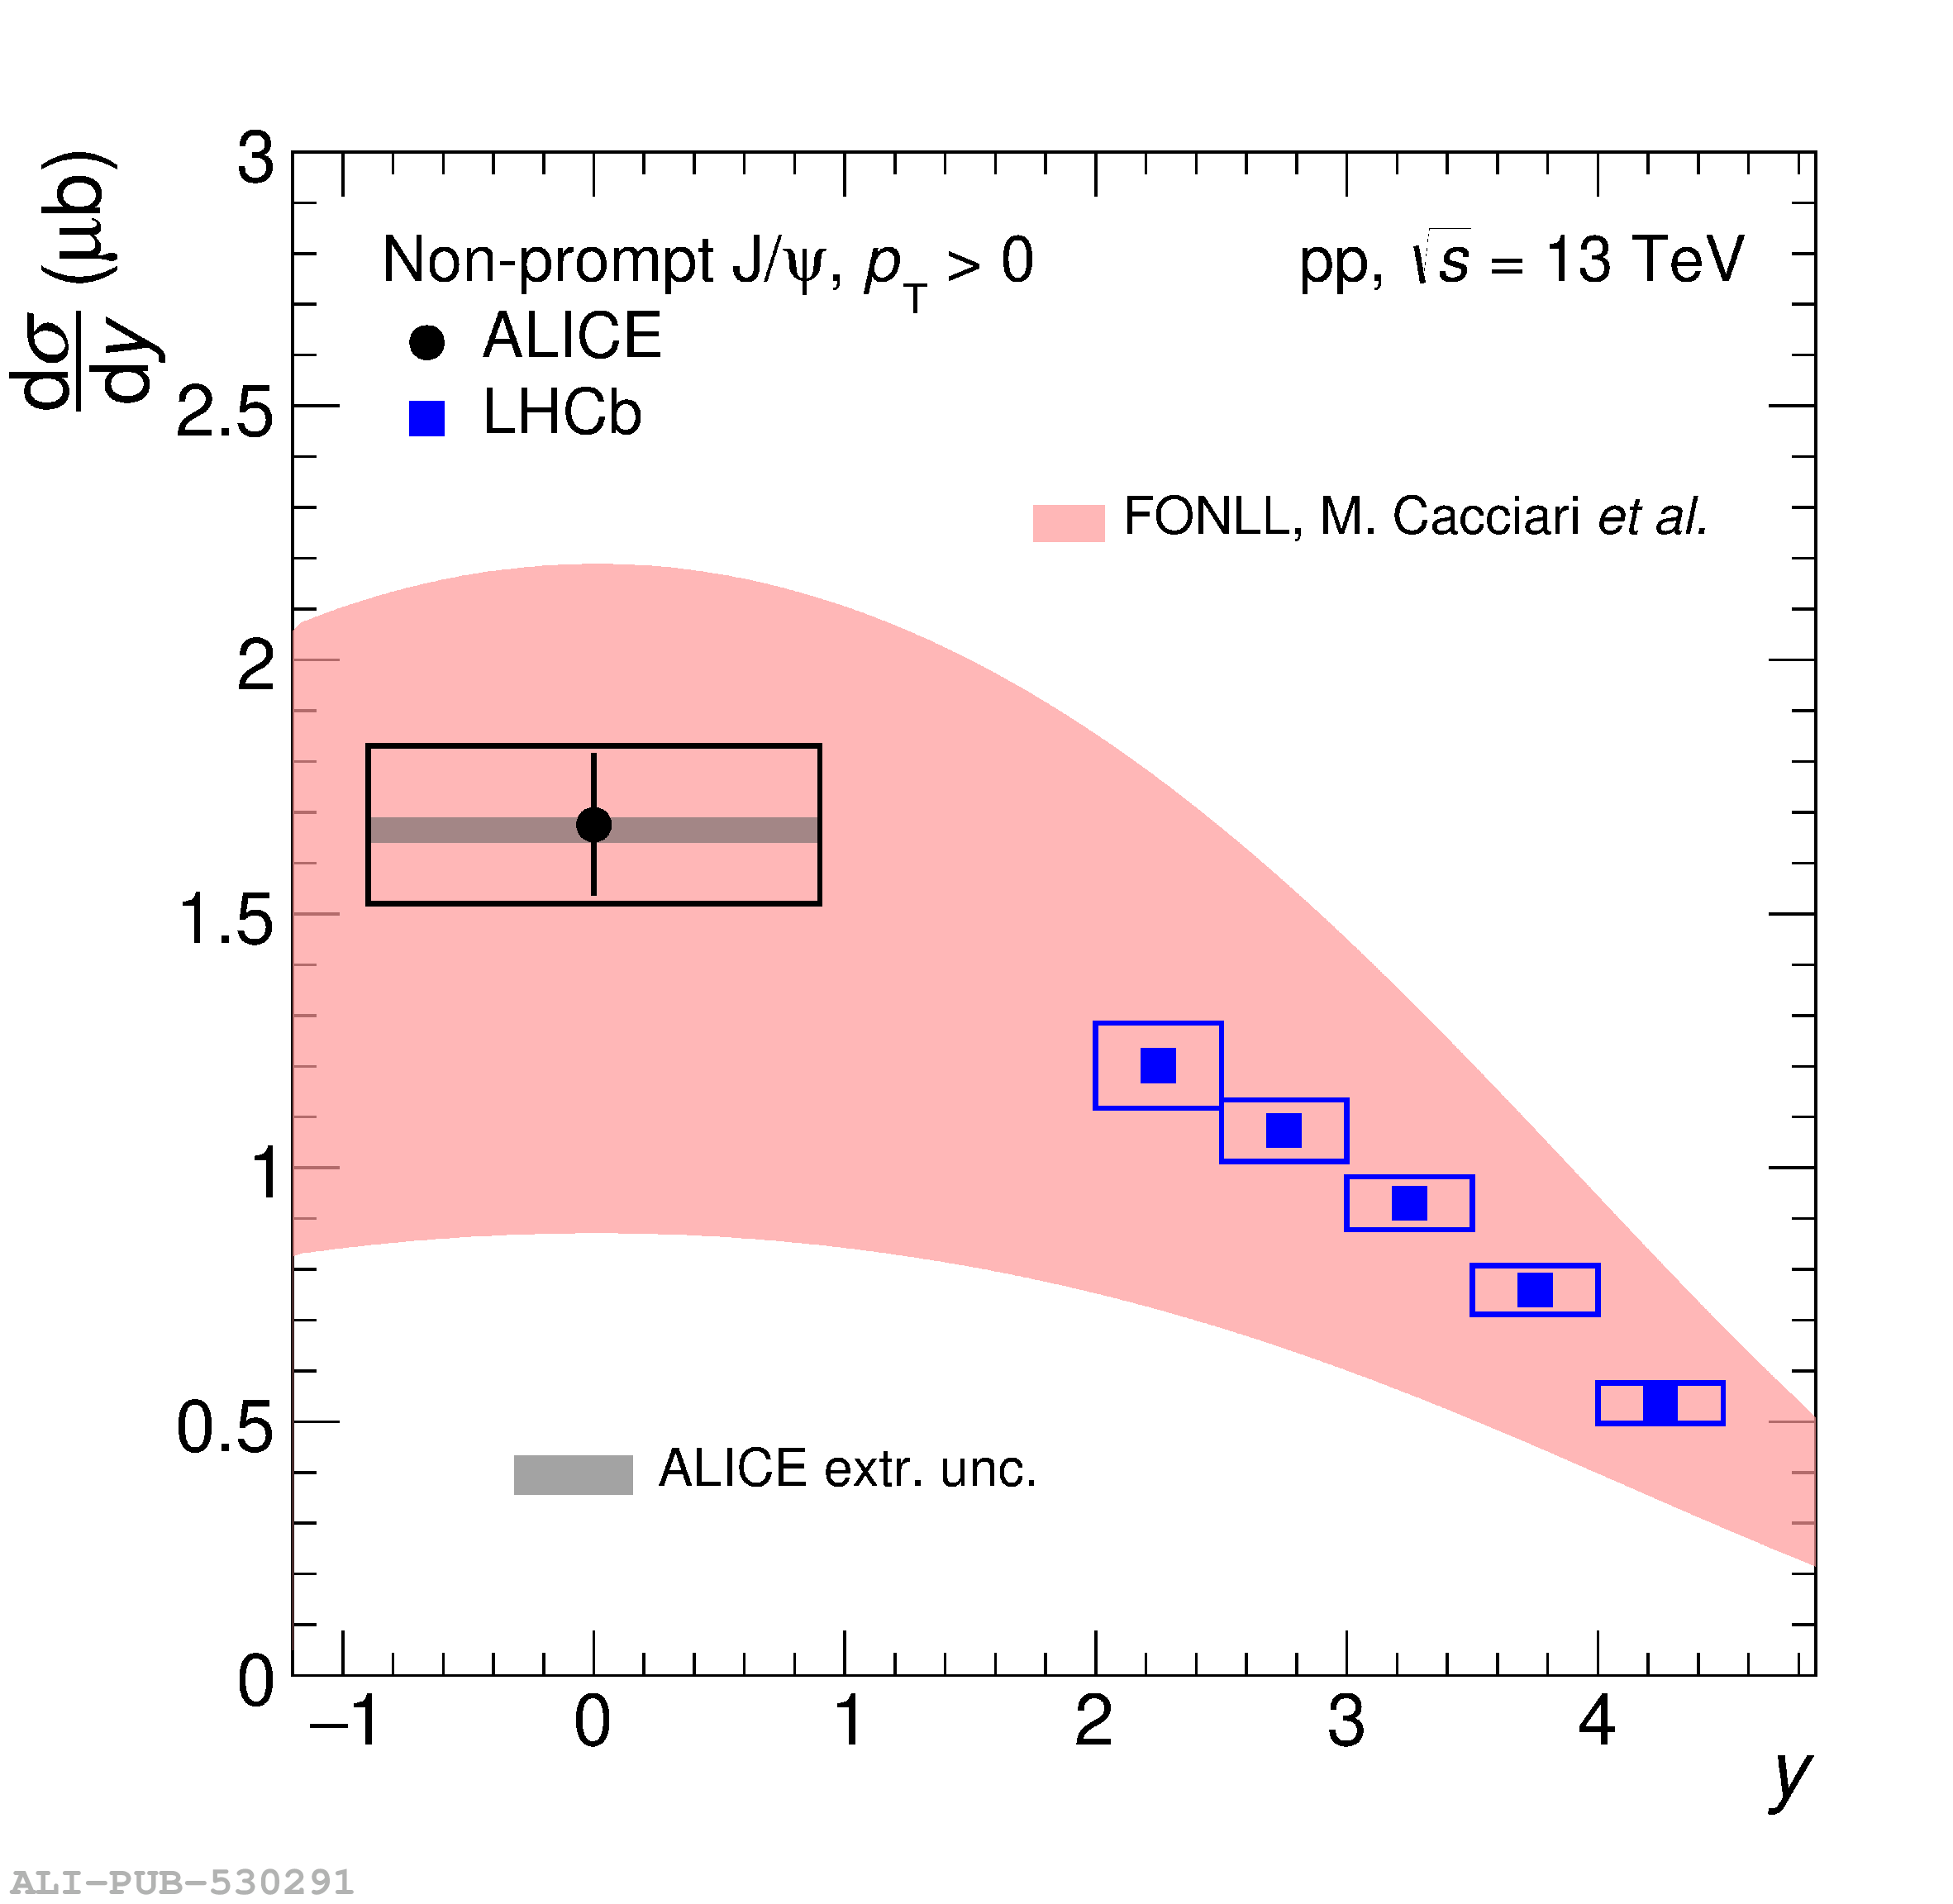 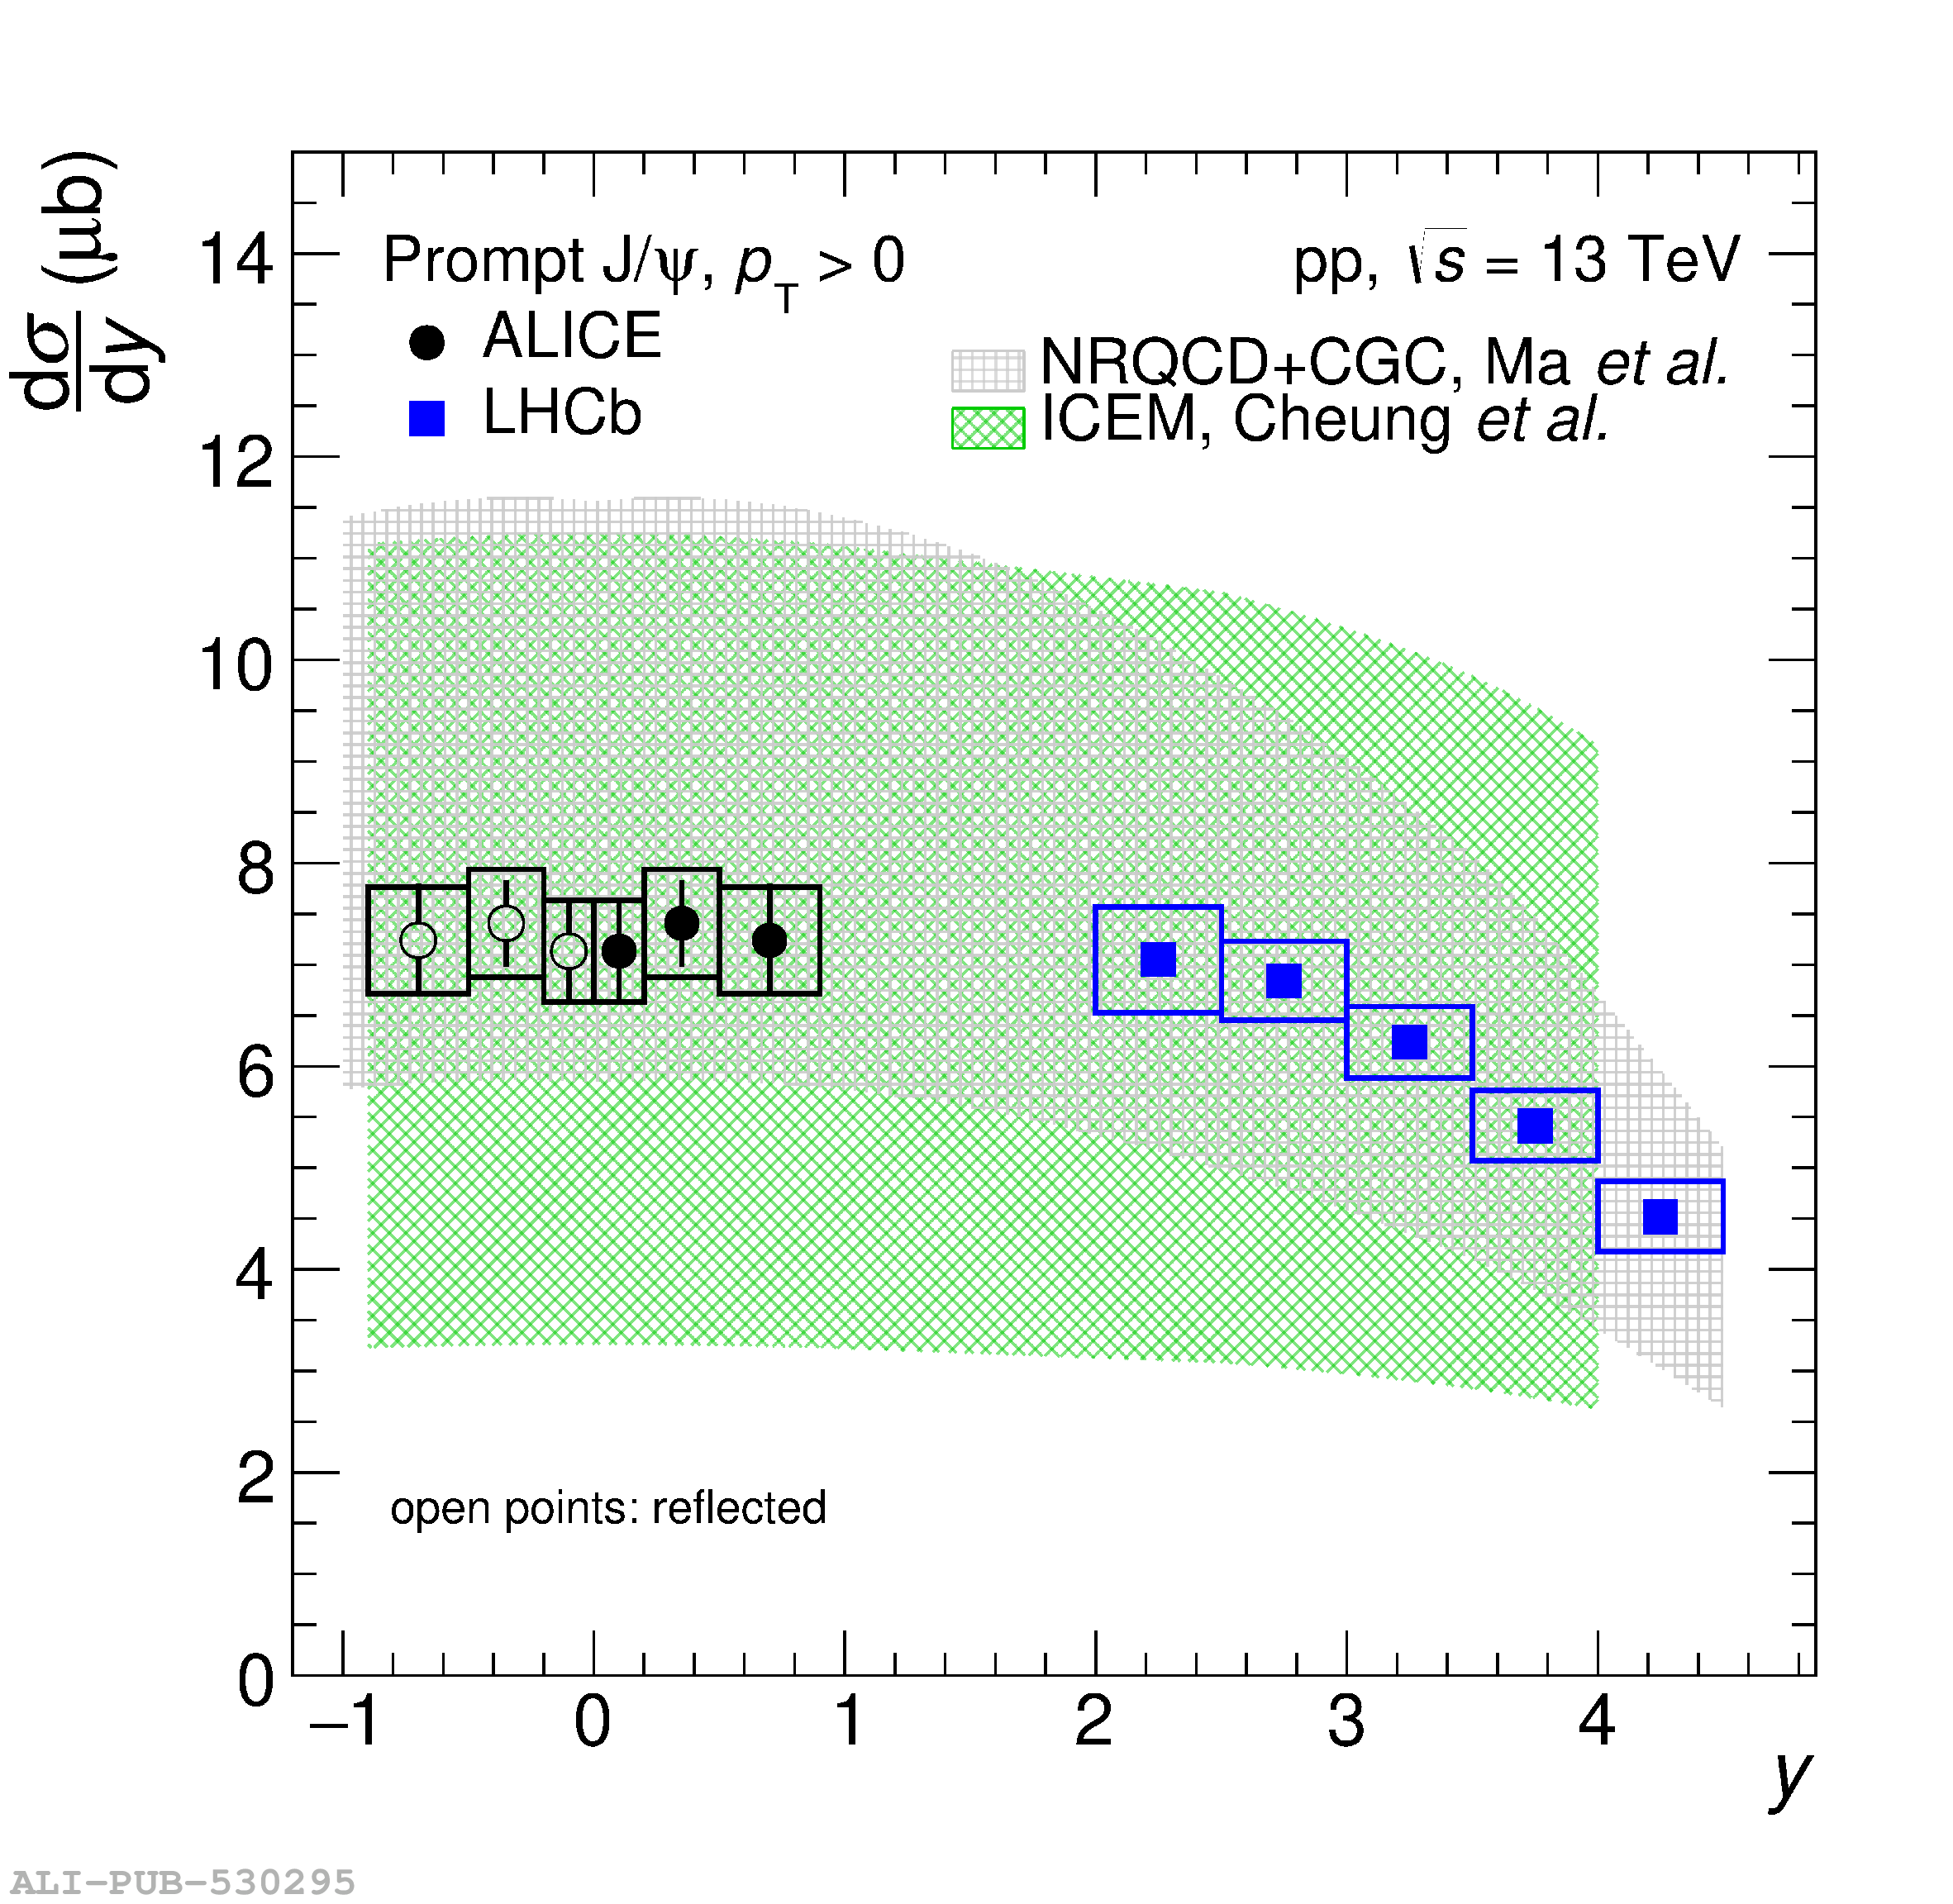 |
Figure 6
The ${\rm d } \sigma_{\rm b \overline{\rm b}}/{\rm d}y$ at midrapidity as a function of the centre-of-mass energy. The ALICE measurement at \s = 5.02 TeV corresponds to the weighted average ofnon-prompt D mesons and non-prompt \pJPsi (see text for details). The ALICE results are compared with existing measurements in pp collisions (PHENIX and ALICE ) and in p$\overline{\rm p}$ collisions (UA1 and CDF ). The shaded area around the ALICE data points represents the extrapolation uncertainty. Results from dielectron measurements from the ALICE collaboration, obtained using either PYTHIA or POWHEG simulations, are also shown FONLL and NNLO calculations in the rapidity range $|y| < 0.9$, with the corresponding uncertainty bands, are superimposed. | 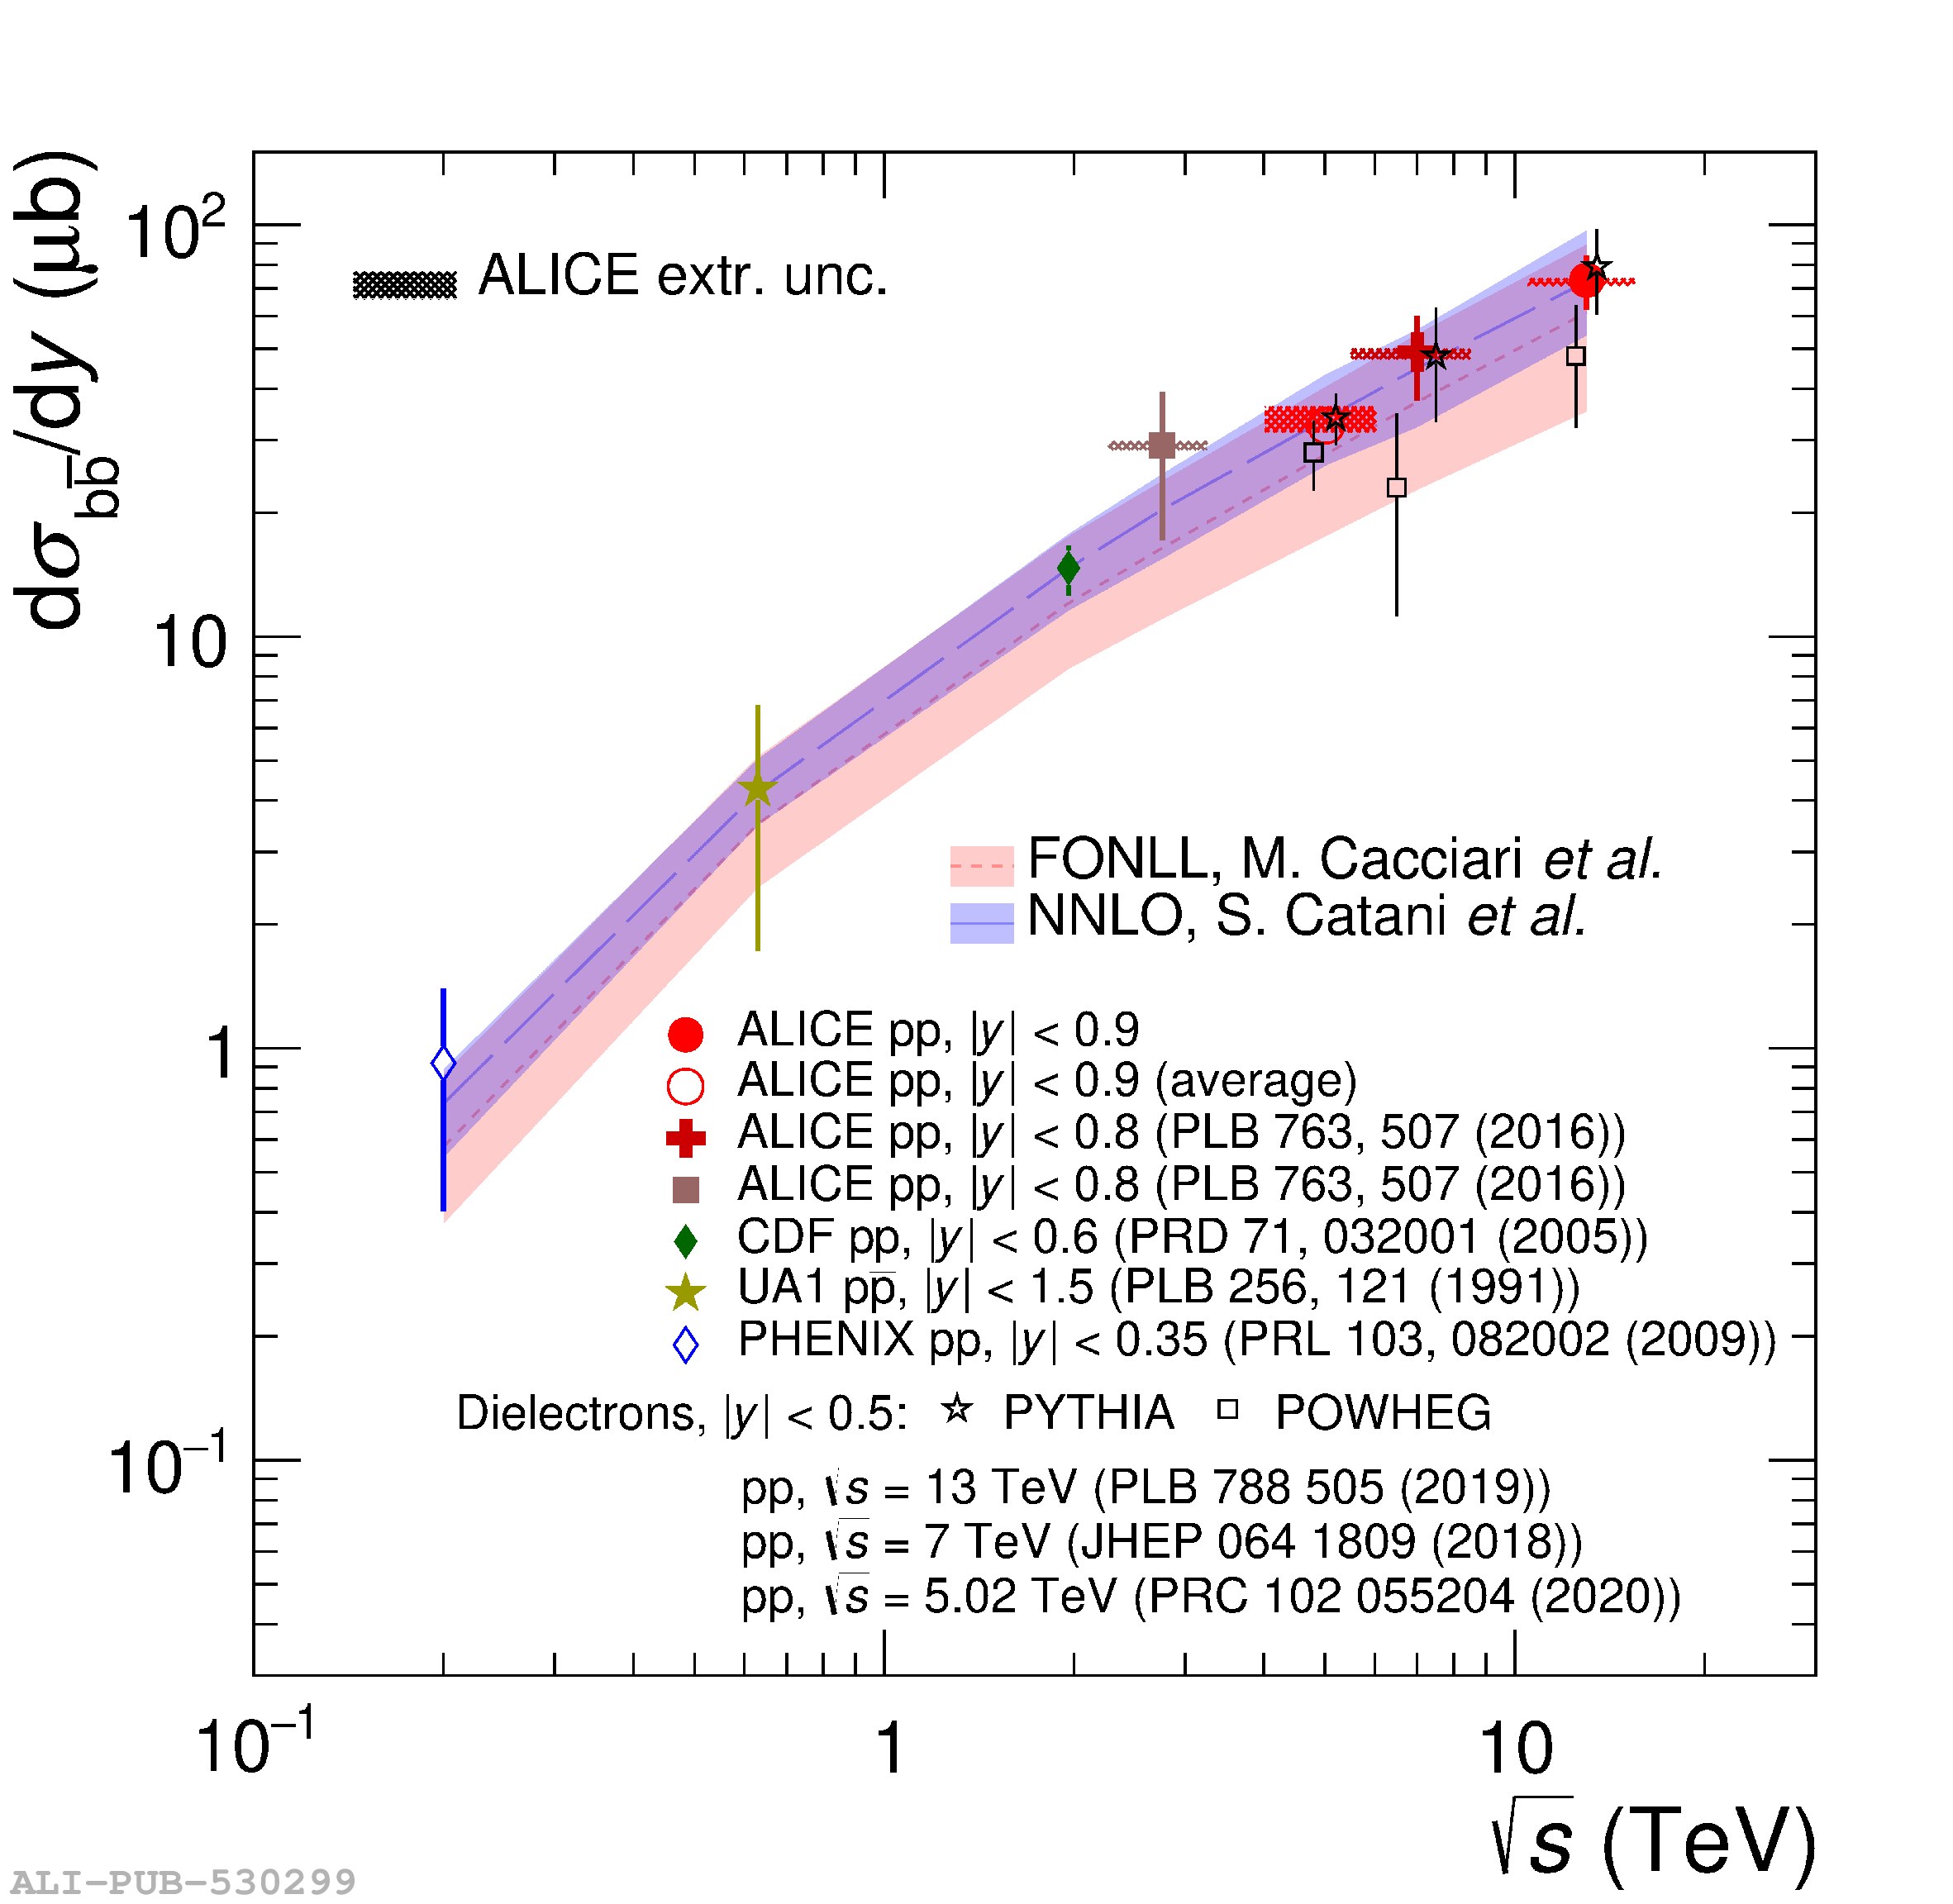 |