The $\frac{{\rm d}^2\sigma}{{\rm d}y {\rm d}\pt}$ of non-prompt \pJPsi\ in pp collisions at $\sqrt{s}$ = 13 TeV (left panel) and 5.02 TeV (right panel) as a function of \pt. The measurement at \s = 5.02 TeV is compared with similar measurements from CMS and ATLAS collaborations at high \pt The error bars (boxes) represent the statistical (systematic) uncertainties. Uncertainties due to the luminosity are not included in the boxes. The results are compared with the FONLL calculations at both energies. Bottom panels show the ratios FONLL to ALICE data. The uncertainty band represents the relative uncertainty from the model whereas the bars and boxes centered around unity refer to relative statistical and systematic uncertainties on ALICE data points, respectively. |  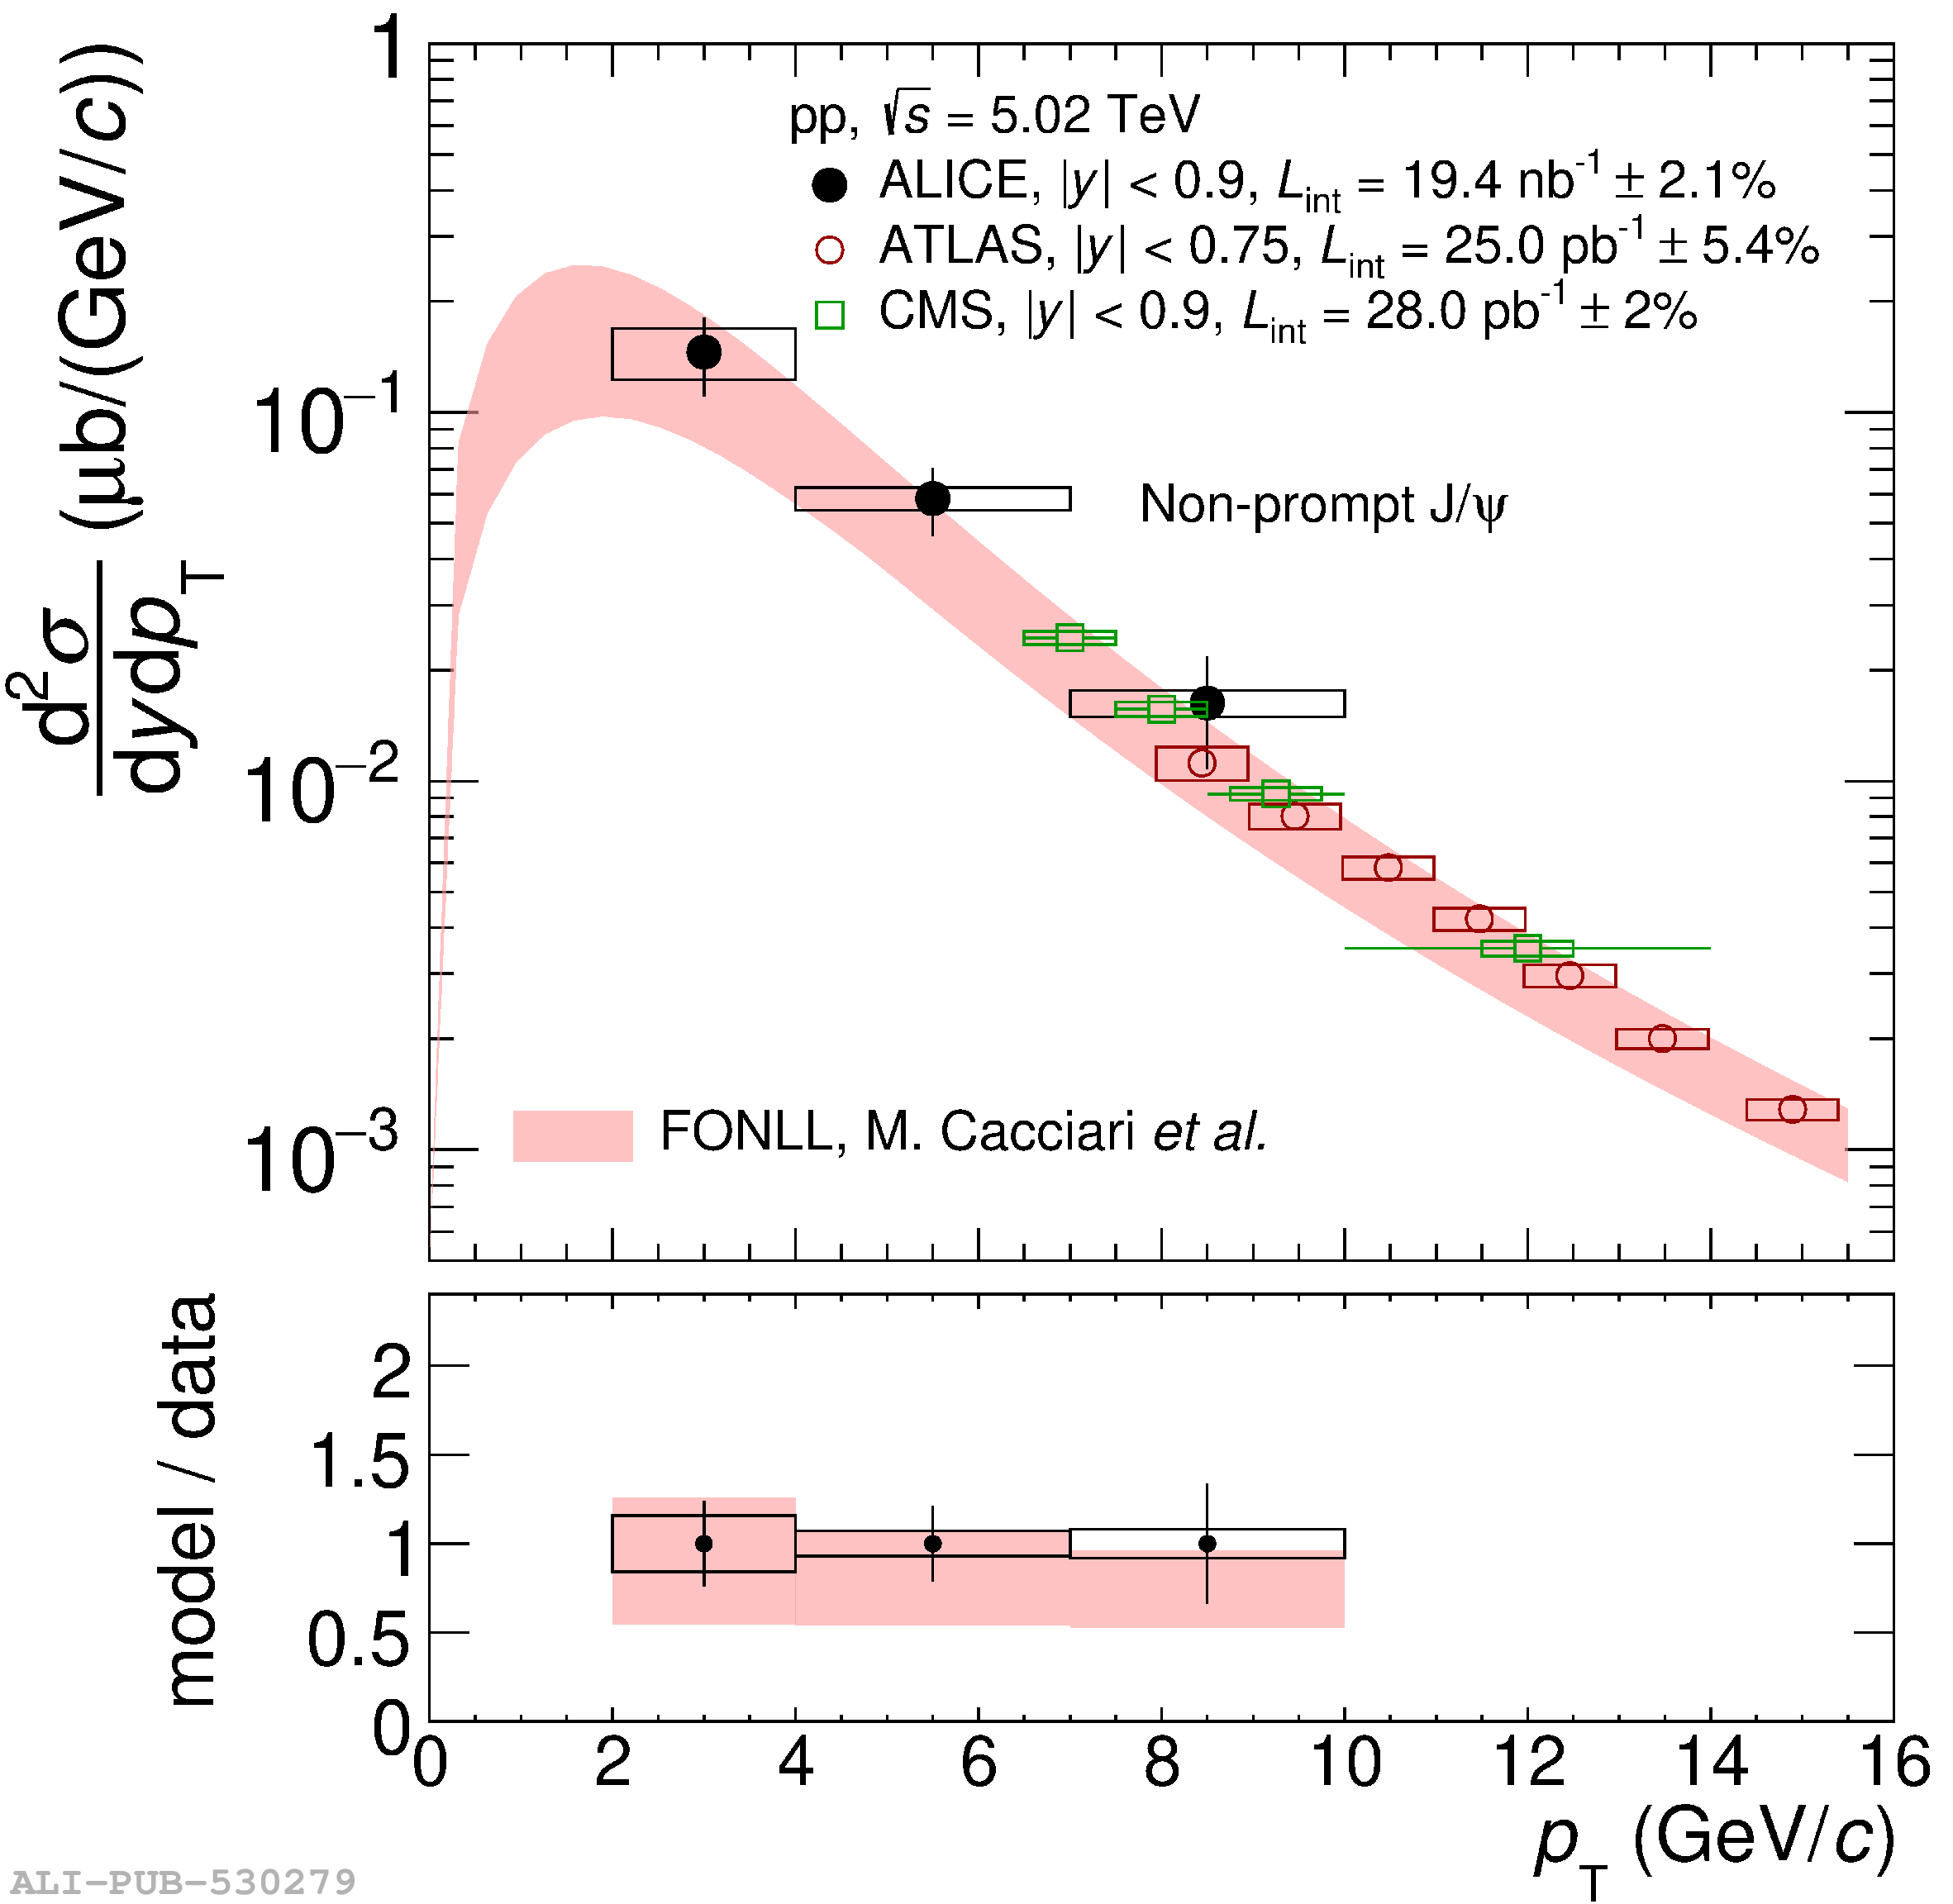 |