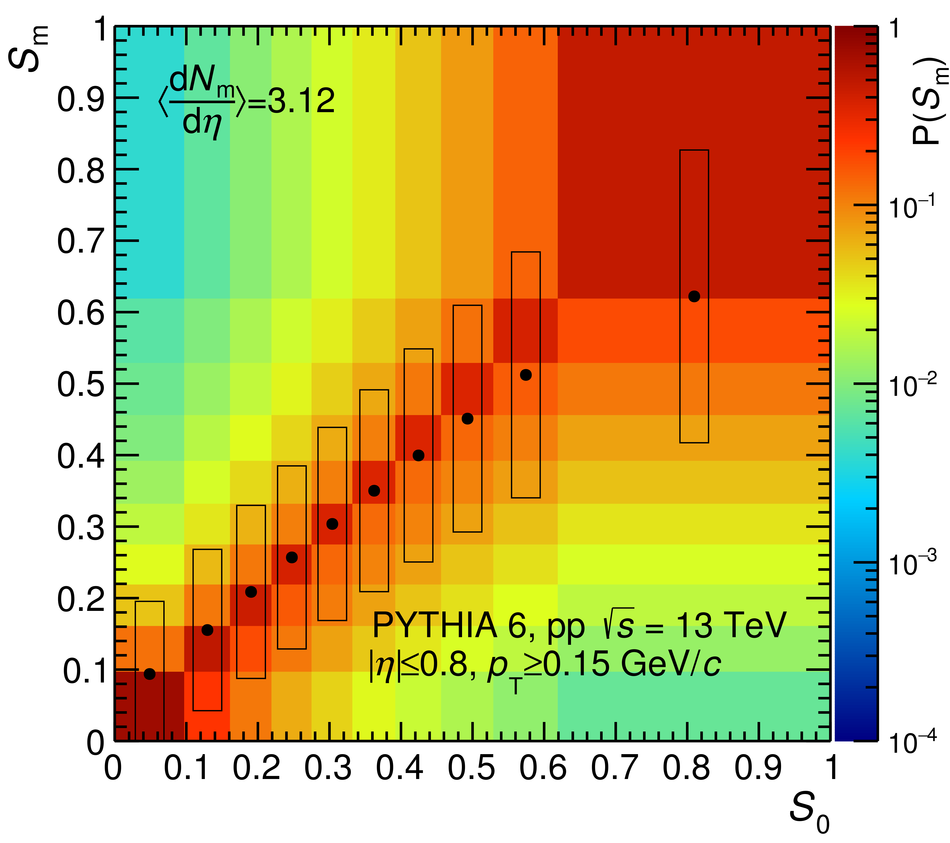
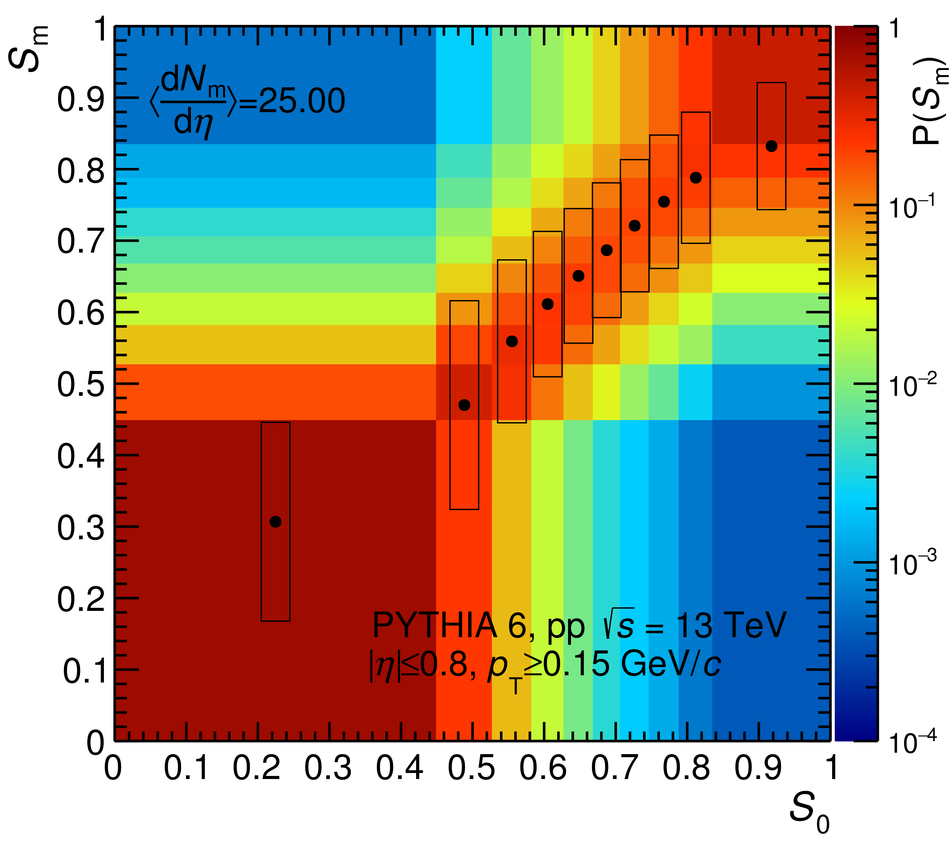
The detector response for spherocity for two track multiplicity classes: $\langle {\rm d}N_{\rm m}/{\rm d}\eta \rangle=3.12$ (left) and $\langle {\rm d}N_{\rm m}/{\rm d}\eta\rangle=25$ (right). Proton-proton collisions were simulated using PYTHIA 6. The simulations include the particle transport performed via a GEANT 3 simulation of the ALICE detector. The markers (boxes around the points) indicate the average (RMS) of the measured spherocity distributions for each bin of spherocity at generator level. The spherocity binning varies with ${\rm d}N_{\rm m}/{\rm d}\eta$, because in this way, it allows the analysis of ten event sub-classes of equal size. The probability that an event with spherocity $S_{0}$ be reconstructed with spherocity $S_{\rm m}$ is represented by ${\rm P}(S_{\rm m})$. |   |