We present a study of the inclusive charged-particle transverse momentum ($p_{\rm T}$) spectra as a function of charged-particle multiplicity density at mid-pseudorapidity, ${\rm d}N_{\rm ch}/{\rm d}\eta$, in pp collisions at $\sqrt{s}$ = 5.02 and 13 TeV covering the kinematic range $|\eta|<~0.8$ and $0.15<~p_{\rm{T}}<~20$ GeV/$c$. The results are presented for events with at least one charged particle in $|\eta|<~1$ (INEL$ >0$). The $p_{\rm T}$ spectra are reported for two multiplicity estimators covering different pseudorapidity regions. The $p_{\rm T}$ spectra normalized to that for INEL $>0$ show little energy dependence. Moreover, the high-$p_{\rm T}$ yields of charged particles increase faster than the charged-particle multiplicity density. The average $\it{p}_{\rm T}$ as a function of multiplicity and transverse spherocity is reported for pp collisions at $\sqrt{s}=13$ TeV. For low- (high-) spherocity events, corresponding to jet-like (isotropic) events, the average $p_{\rm T}$ is higher (smaller) than that measured in INEL $>0$ pp collisions. Within uncertainties, the functional form of $\langle p_{\rm T} \rangle(N_{\rm ch})$ is not affected by the spherocity selection. While EPOS LHC gives a good description of many features of data, PYTHIA overestimates the average $p_{\rm T}$ in jet-like events.
Eur. Phys. J. C 79 (2019) 857
HEP Data
e-Print: arXiv:1905.07208 | PDF | inSPIRE
CERN-EP-2019-094
Figure 1
The detector response for spherocity for two track multiplicity classes: $\langle {\rm d}N_{\rm m}/{\rm d}\eta \rangle=3.12$ (left) and $\langle {\rm d}N_{\rm m}/{\rm d}\eta\rangle=25$ (right). Proton-proton collisions were simulated using PYTHIA 6. The simulations include the particle transport performed via a GEANT 3 simulation of the ALICE detector. The markers (boxes around the points) indicate the average (RMS) of the measured spherocity distributions for each bin of spherocity at generator level. The spherocity binning varies with ${\rm d}N_{\rm m}/{\rm d}\eta$, because in this way, it allows the analysis of ten event sub-classes of equal size. The probability that an event with spherocity $S_{0}$ be reconstructed with spherocity $S_{\rm m}$ is represented by ${\rm P}(S_{\rm m})$. |   |
Figure 2
Transverse momentum distributions of charged particles for multiplicity classes selected using SPD tracklets in $|\eta|< 0.8$. Results for pp collisions at $\sqrt{s}=5.02$ and 13\,TeV are shown in the left and right panels, respectively. Statistical and total systematic uncertainties are shown as error bars and boxes around the data points, respectively. In the middle panels, ratios of multiplicity dependent spectra to INEL$\,>0$ are shown in logarithmic scale. In the bottom panels we show the ratios in a linear scale to illustrate the dramatic behavior of the ratios. The systematic uncertainties on the ratios are obtained by considering only contributions uncorrelated across multiplicity. The spectra are scaled to improve the visibility. | 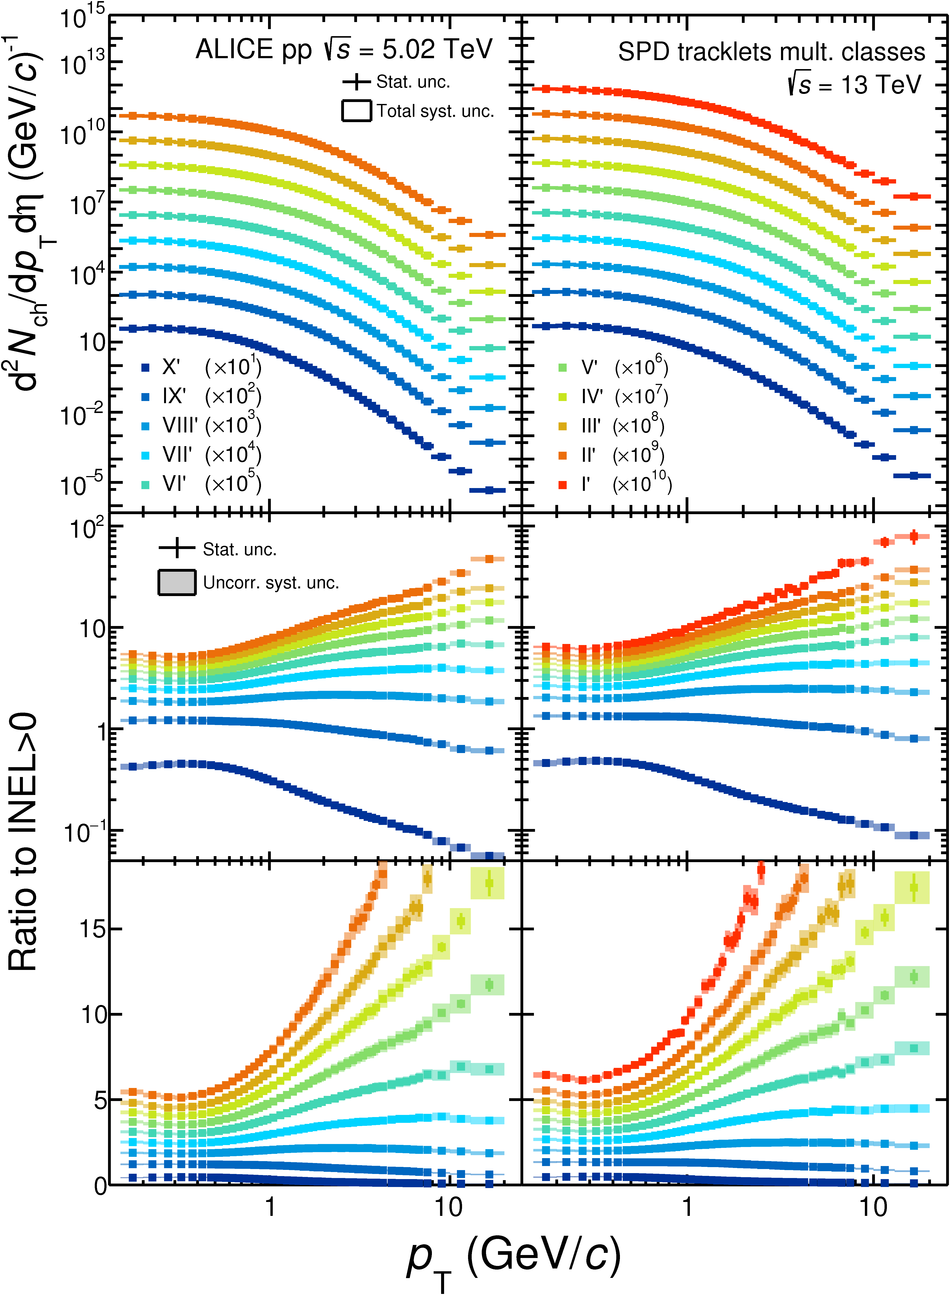 |
Figure 3
Transverse momentum distributions of charged particles for different V0M multiplicity classes. Results for pp collisions at $\sqrt{s}=5.02$ and 13\,TeV are shown in the left and right panels, respectively. Statistical and total systematic uncertainties are shown as error bars and boxes around the data points, respectively. In the middle panels, ratios of multiplicity dependent spectra to INEL$\,>0$ are shown in logarithmic scale. The systematic uncertainties on the ratios are obtained by considering only contributions uncorrelated across multiplicity. The spectra are scaled to improve the visibility. | 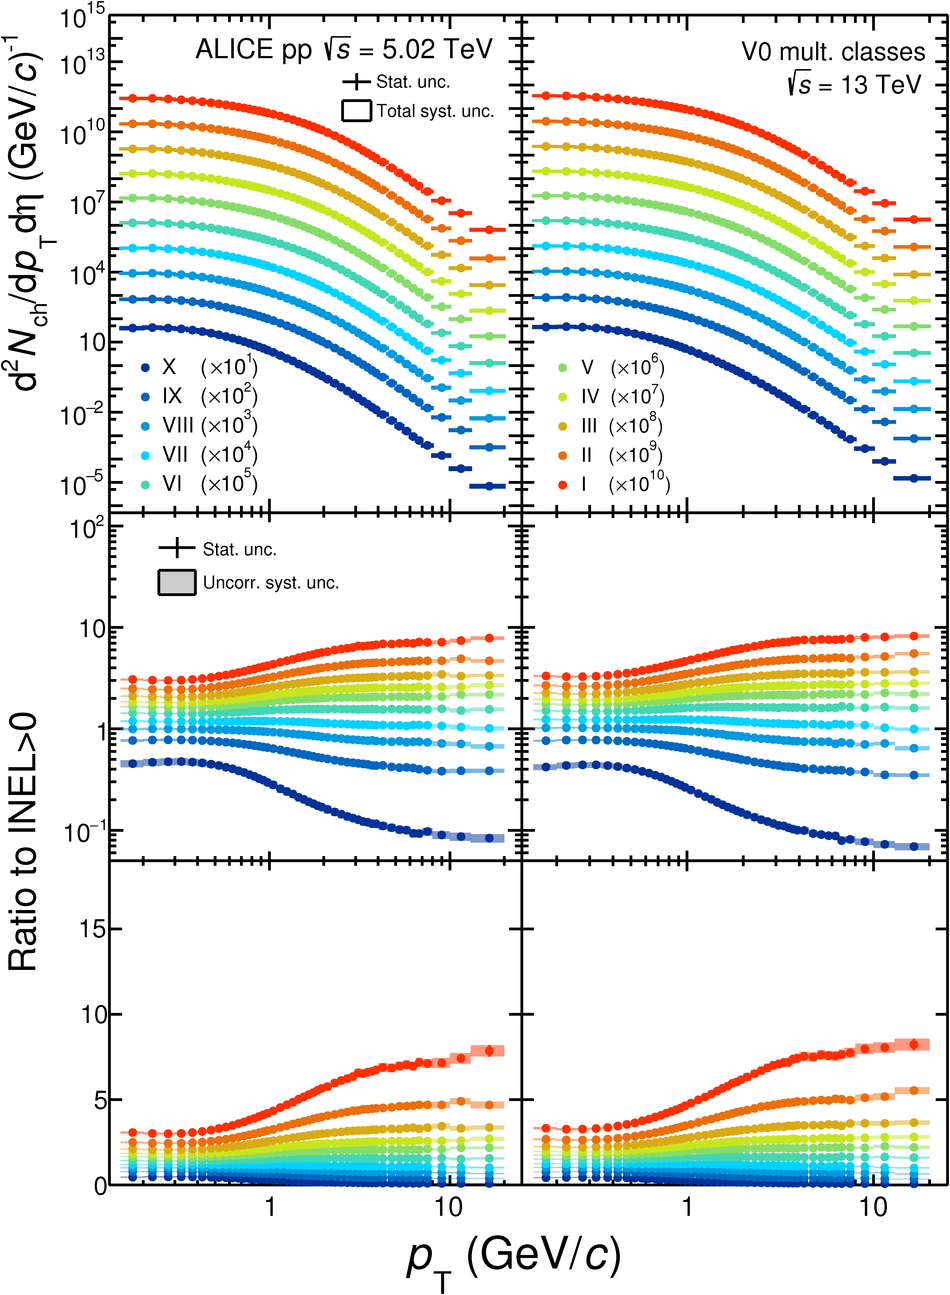 |
Figure 4
Transverse momentum distributions of charged particles for high-multiplicity ($\langle {\rm d}N_{\rm ch}/{\rm d}\eta \rangle \approx20$) pp collisions at $\sqrt{s}=5.02$ (empty markers) and 13\,TeV (full markers). Results for V0-based (squares) and SPD-based (circles) multiplicity estimators are shown. The bottom panel shows the \pt spectrum obtained using the V0-based multiplicity estimator normalized to that using the SPD-based multiplicity estimator. Only statistical uncertainties are shown as error bars. | 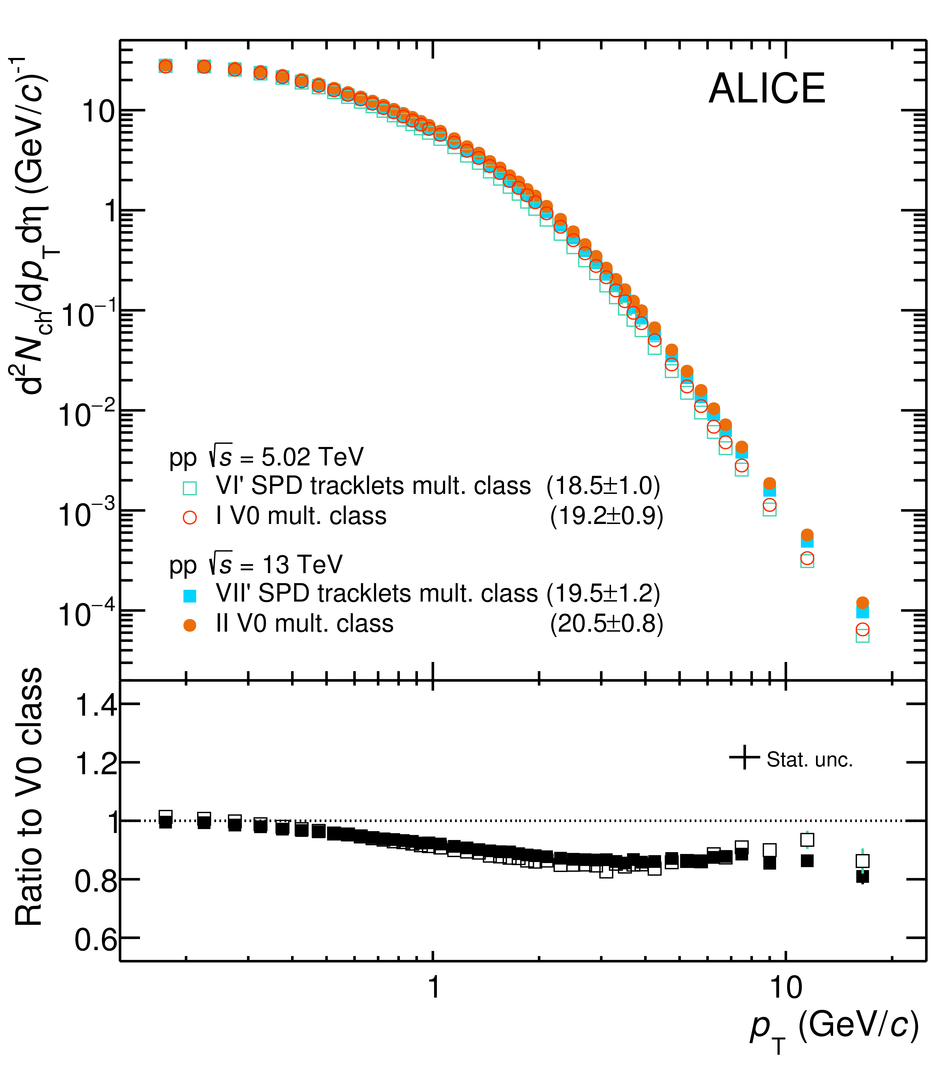 |
Figure 5
Evolution of the spectral shape of the transverse momentum distribution as a function of charged-particle multiplicity. The spectral shape is characterized by the exponent of the power-law function which fits the high-\pt part ($\pt>6$\,GeV/$c$) of the invariant yields. Results for pp collisions at $\sqrt{s}=13$\,TeV are shown. A comparison of the two multiplicity estimators discussed in this paper is shown in the left panel. Comparisons with Monte Carlo generators predictions are shown in the middle and right panels. Statistical and total systematic uncertainties are shown as error bars and boxes around the data points, respectively. | 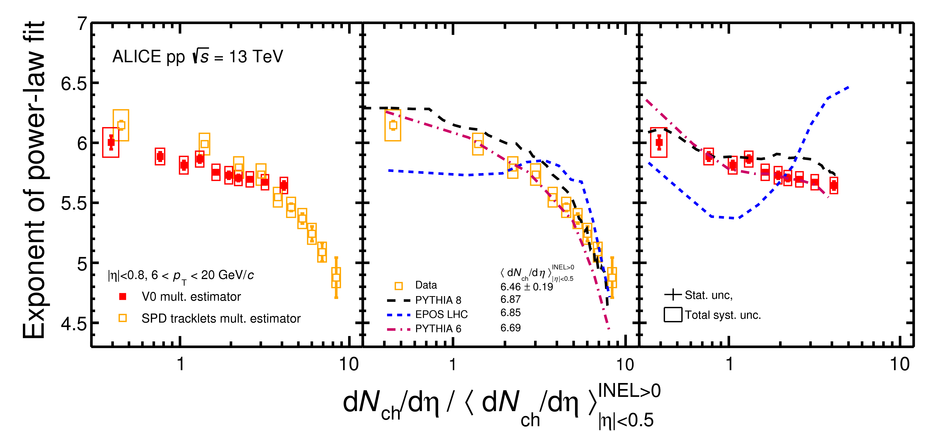 |
Figure 6
Self-normalized yields of charged particles integrated over different \pt intervals: $2< \pt< 4$\,GeV/$c$, $4< \pt< 6$\,GeV/$c$, and $6< \pt< 10$\,GeV/$c$. The integrated yields for pp collisions at $\sqrt{s}=13$\,TeV are shown as a function of charged-particle density at mid-pseudorapidity. Statistical and uncorrelated (across multiplicity) systematic uncertainties are shown as error bars and boxes around the data points, respectively. Statistical uncertainties are negligible compared to systematic uncertainties. Data are compared with PYTHIA 8 (dashed lines) and EPOS LHC (solid lines). The dotted line is drawn to see the differences between data and the linear dependence. Deviations of data from the linear trend are shown in the bottom panel. | 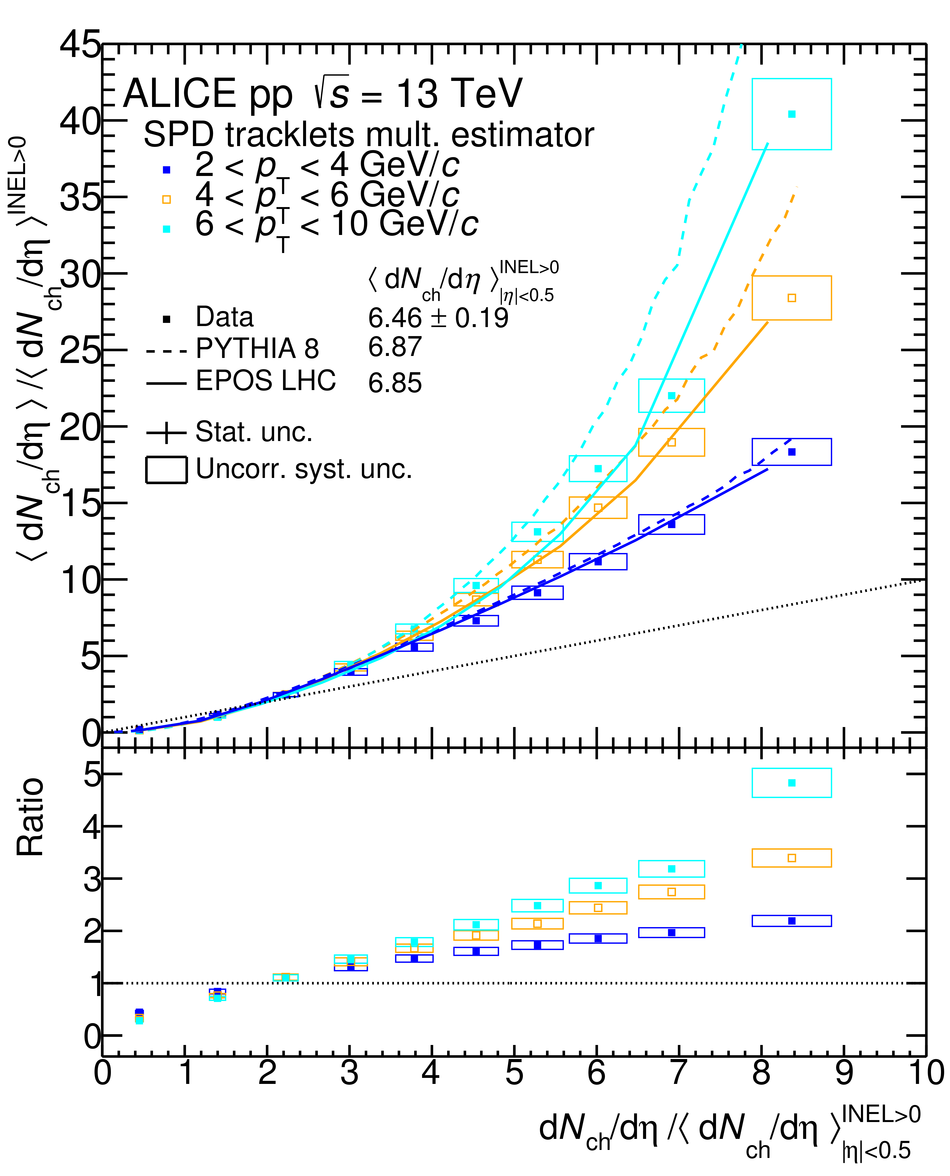 |
Figure 7
Average transverse momentum as a function of event multiplicity in pp collisions at $\sqrt{s}=13$\,TeV. Results for the spherocity-integrated case (0\,--\,100\%) are contrasted with the measurements for the most jet-like (0\,--\,10\%) and isotropic (90\,--\,100\%) events. Statistical uncertainties (error bars) are negligible compared to systematic uncertainties (boxes around the data points). | 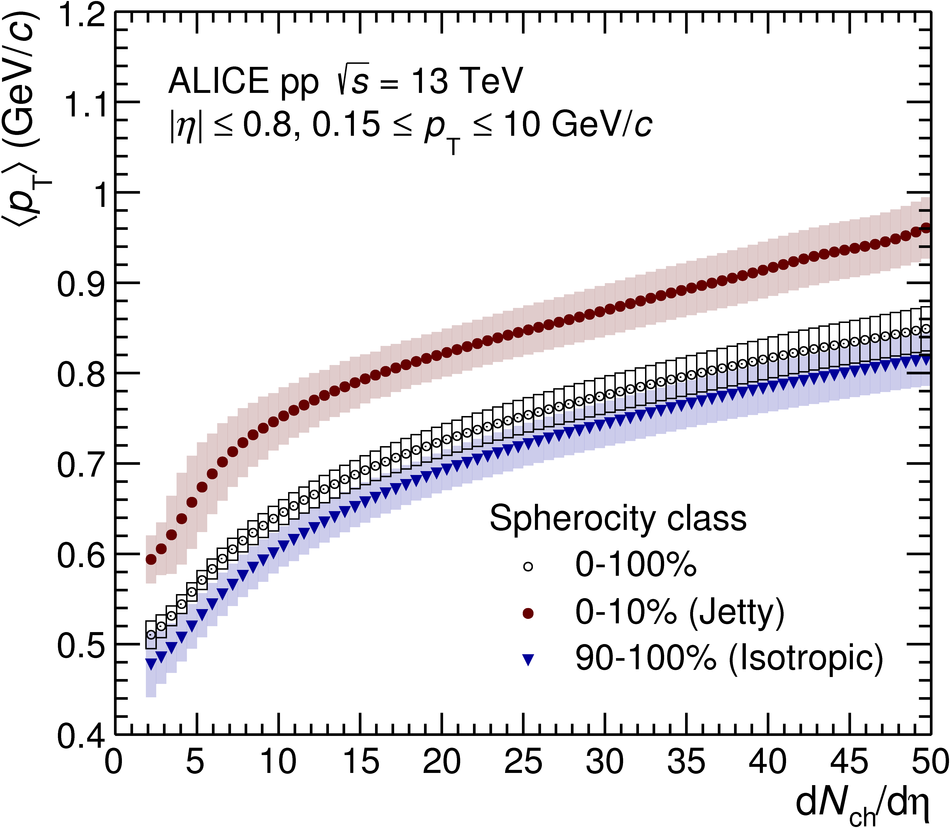 |
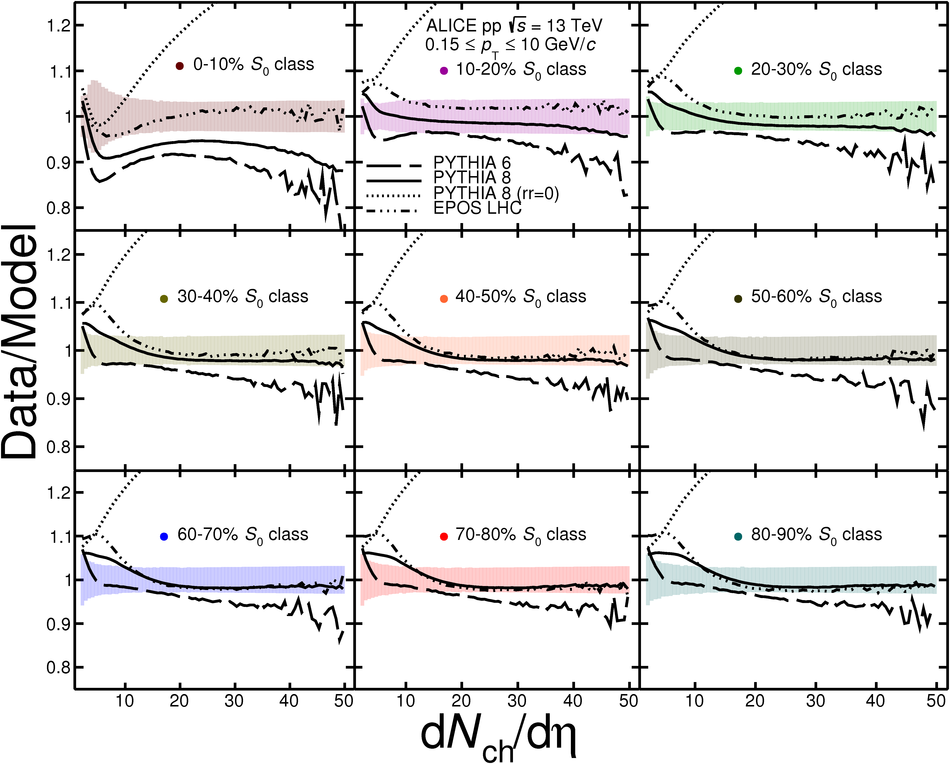
Figure 8
Average transverse momentum as a function of event multiplicity in pp collisions at $\sqrt{s}=13$\,TeV. Results for the spherocity-integrated case (0\,--\,100\%), the most jet-like (0\,--\,10\%) and isotropic (90\,--\,100\%) events are compared with Monte Carlo predictions. Predictions of PYTHIA 8 with and without (null reconnection range, $\rm{rr}=0$) color reconnection, as well as PYTHIA 6 and EPOS LHC are displayed. Statistical uncertainties (error bars) are negligible compared to systematic uncertainties (shaded area around the data points). Data to model ratios are shown in the bottom panel. The color band around unity represents the systematic uncertainty. | 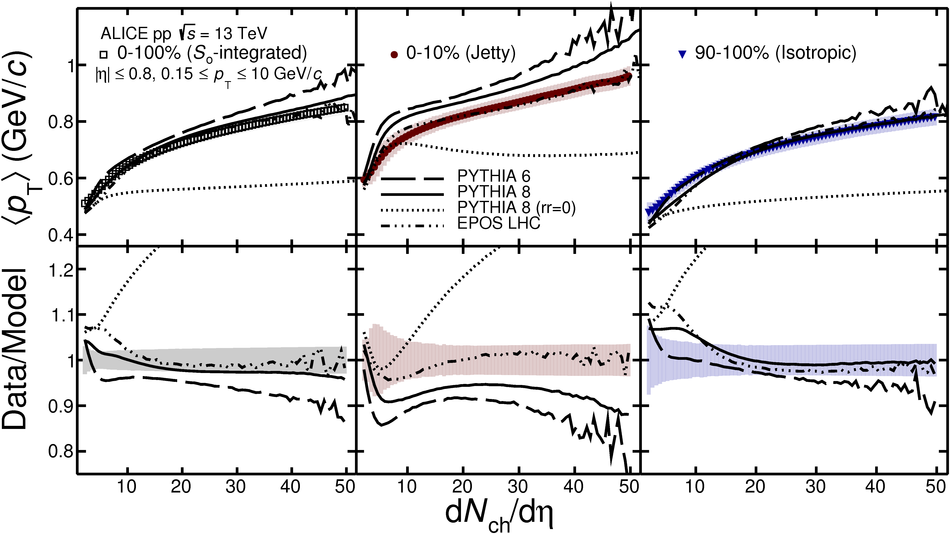 |
Figure 9
Average \pt of jet-like (circles) and isotropic (triangles) events normalized to that for the spherocity-integrated event class. The measurements are compared with different Monte Carlo generators. Statistical uncertainties (error bars) are negligible compared to systematic uncertainties (boxes around the data points). | 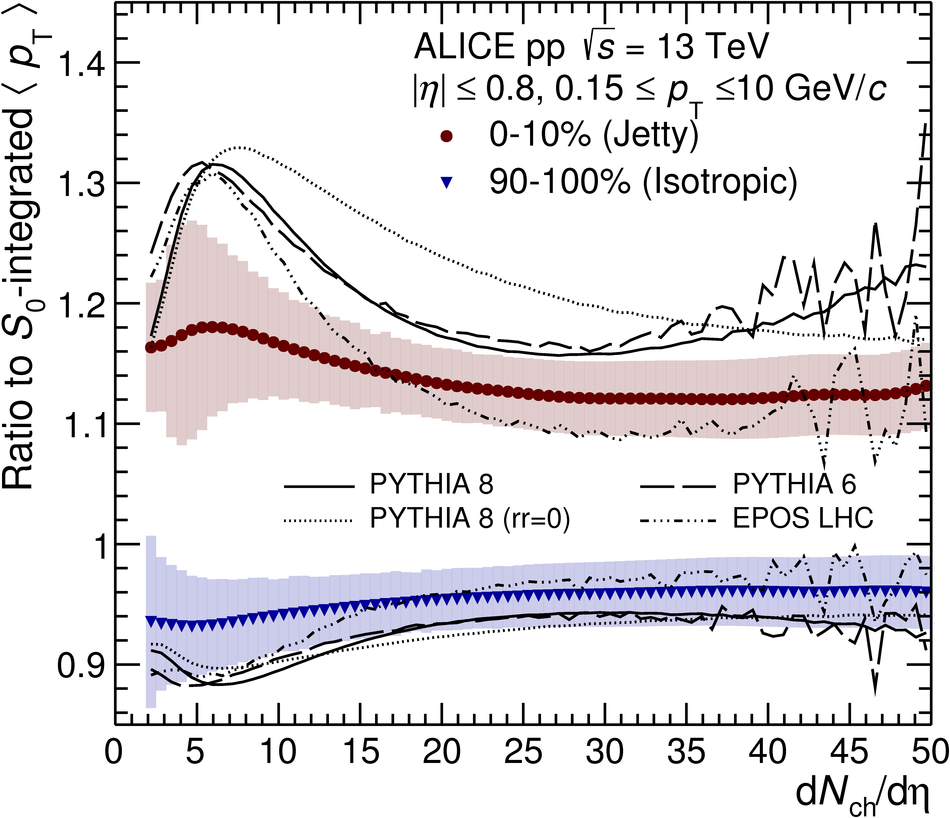 |
Figure 10
Average transverse momentum as a function of event multiplicity in pp collisions at $\sqrt{s}=13$\,TeV. Results for nine spherocity classes are compared with Monte Carlo predictions. Statistical uncertainties (error bars) are negligible compared to systematic uncertainties (shaded area around the data points). | 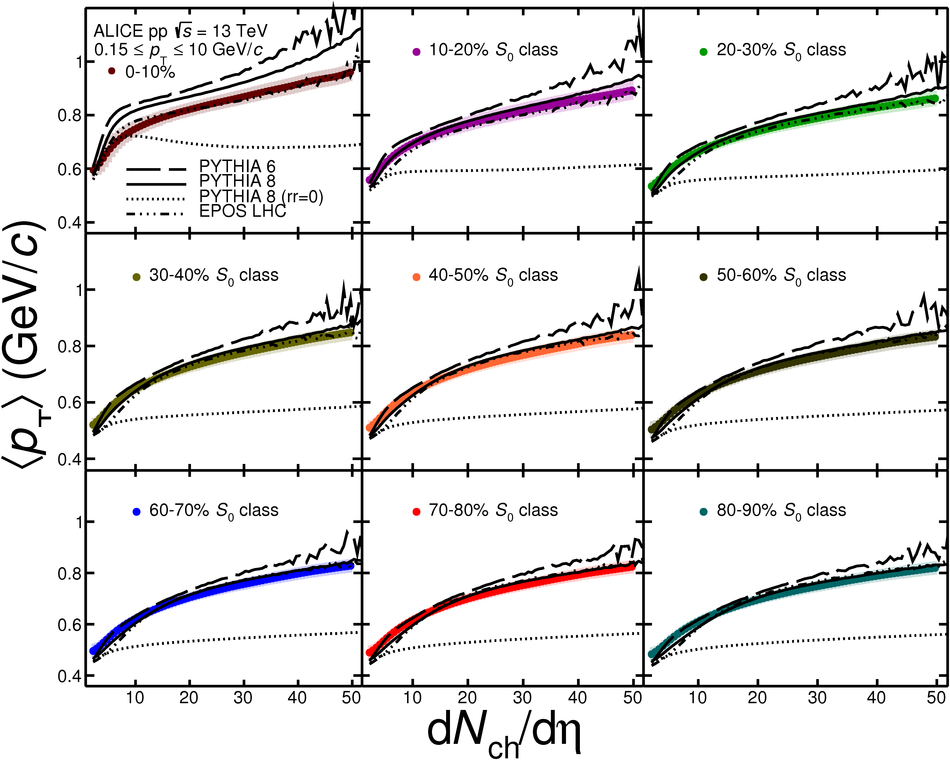 |