The $\pt$-differential $v_2$ (top), $v_3$ (middle), and $v_4$ (bottom) of p+\pbar{} for the 0--5\%, 10--20\%, and 40--50\% centrality classes compared to hydrodynamical calculations from MUSIC model using IP-Glasma initial conditions (magenta) and the iEBE-VISHNU hybrid model using AMPT (orange) or \protect\trento{} (cyan) initial conditions . Statistical and systematic uncertainties of the data points are shown as bars and boxes, respectively. The uncertainties of the hydrodynamical calculations are depicted by the thickness of the curves. The ratios of the measured $v_{\rm n}$ to a fit to the hydrodynamical calculations are also presented for clarity. | 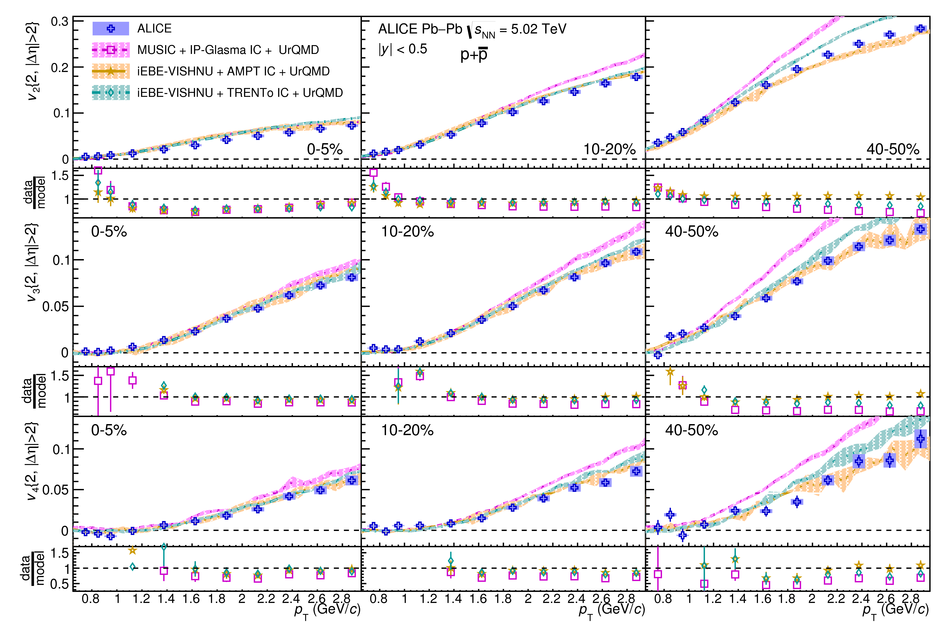 |