The elliptic ($v_2$), triangular ($v_3$), and quadrangular ($v_4$) flow coefficients of $\pi^{\pm}$, ${\rm K}^{\pm}$, ${\rm p+\overline{p}}$, ${\Lambda+\overline{\Lambda}}$, ${\rm K}^{\rm 0}_{\rm S}$, and the $\phi$-meson are measured in Pb-Pb collisions at $\sqrt{s_{\rm NN}}=5.02$ TeV. Results obtained with the scalar product method are reported for the rapidity range $\vert y \vert <~$ 0.5 as a function of transverse momentum, $p_\text{T}$, at different collision centrality intervals between 0-70%, including ultra-central (0-1%) collisions for $\pi^{\pm}$, ${\rm K}^{\pm}$, and ${\rm p+\overline{p}}$. For $p_\text{T} <~ 3$ GeV$\kern-0.05em/\kern-0.02em c$, the flow coefficients exhibit a particle mass dependence. At intermediate transverse momenta ($3<~p_\text{T}<~$~8-10 GeV$\kern-0.05em/\kern-0.02em c$), particles show an approximate grouping according to their type (i.e., mesons and baryons). The $\phi$-meson $v_2$, which tests both particle mass dependence and type scaling, follows ${\rm p+\overline{p}}$ $v_2$ at low $p_\text{T}$ and $\pi^{\pm}$ $v_2$ at intermediate $p_\text{T}$. The evolution of the shape of $v_{\rm n}(p_{\mathrm{T}})$ as a function of centrality and harmonic number $n$ is studied for the various particle species. Flow coefficients of $\pi^{\pm}$, ${\rm K}^{\pm}$, and ${\rm p+\overline{p}}$ for $p_\text{T}<~3$ GeV$\kern-0.05em/\kern-0.02em c$ are compared to iEBE-VISHNU and MUSIC hydrodynamical calculations coupled to a hadronic cascade model (UrQMD). The iEBE-VISHNU calculations describe the results fairly well for $p_\text{T} <~ 2.5$ GeV$\kern-0.05em/\kern-0.02em c$, while MUSIC calculations reproduce the measurements for $p_\text{T} <~ 1$ GeV$\kern-0.05em/\kern-0.02em c$. A comparison to $v_{\rm n}$ coefficients measured in Pb-Pb collisions at $\sqrt{s_{\rm NN}}$ = 2.76 TeV is also provided.
JHEP09 (2018) 006
HEP Data
e-Print: arXiv:1805.04390 | PDF | inSPIRE

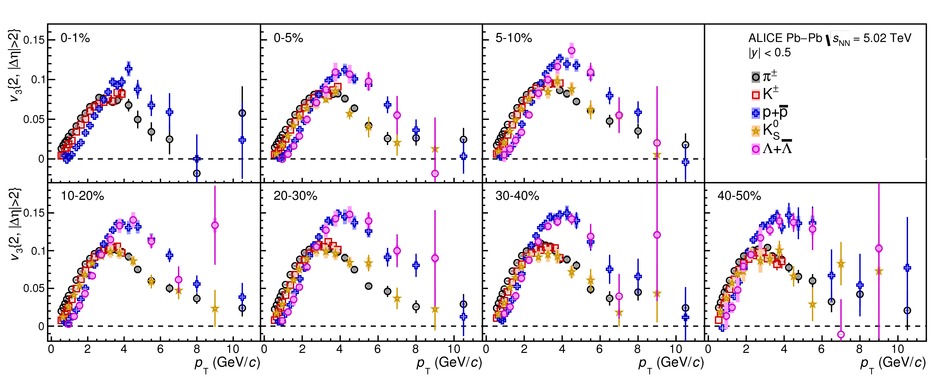
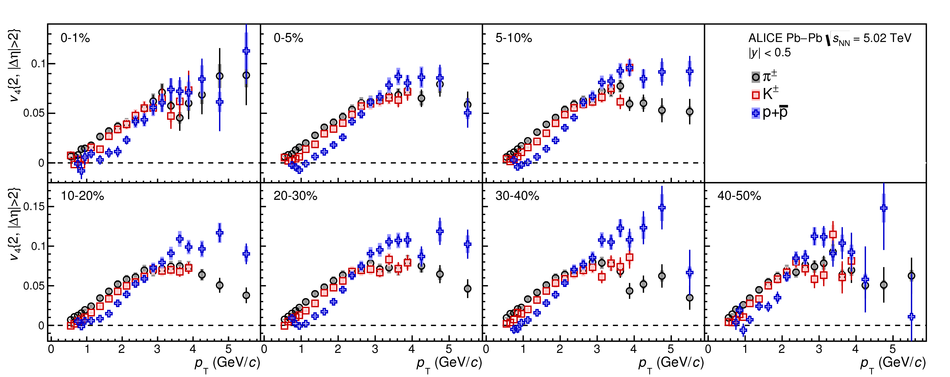
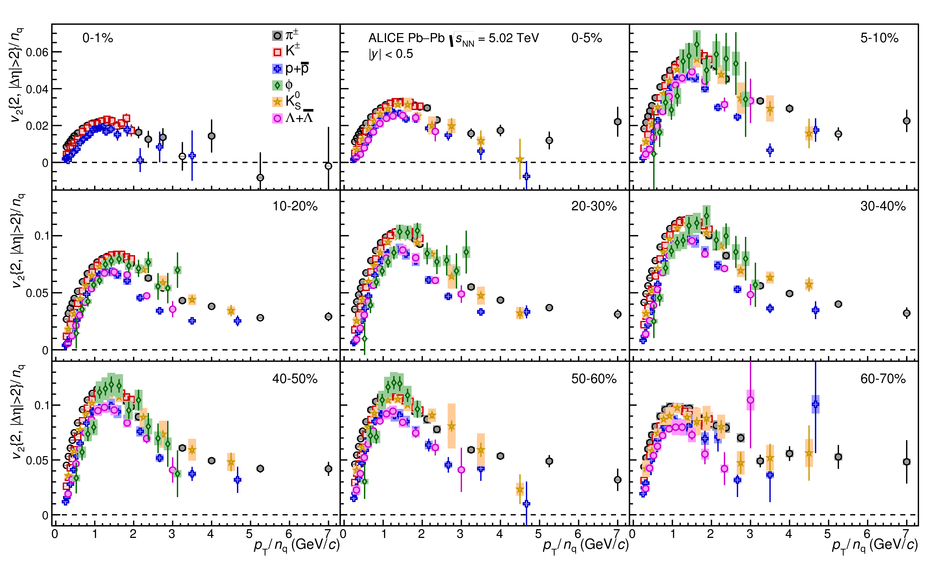

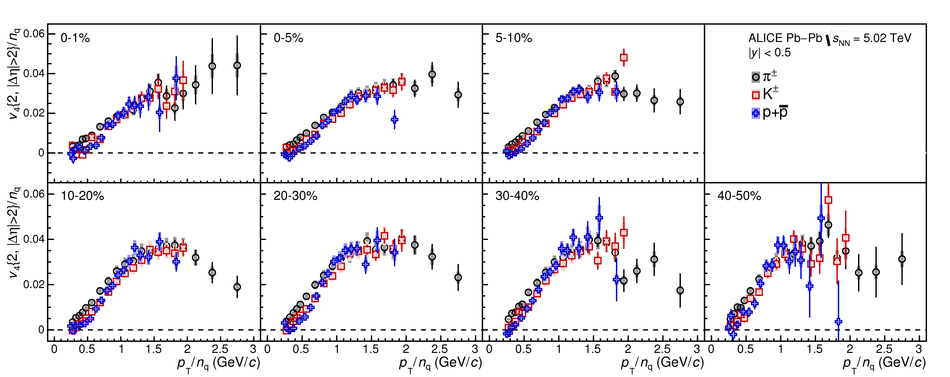
Figure 11
The $\pt$-differential $v_2$ (top), $v_3$ (middle), and $v_4$ (bottom) of \pipm{} for the 0--5\%, 10--20\%, and 40--50\% centrality classes compared to hydrodynamical calculations from MUSIC model using IP-Glasma initial conditions (magenta) and the iEBE-VISHNU hybrid model using AMPT (orange) or \protect\trento{} (cyan) initial conditions . Statistical and systematic uncertainties of the data points are shown as bars and boxes, respectively. The uncertainties of the hydrodynamical calculations are depicted by the thickness of the curves. The ratios of the measured $v_{\rm n}$ to a fit to the hydrodynamical calculations are also presented for clarity. |  |
Figure 12
The $\pt$-differential $v_2$ (top), $v_3$ (middle), and $v_4$ (bottom) of \kapm{} for the 0--5\%, 10--20\%, and 40--50\% centrality classes compared to hydrodynamical calculations from MUSIC model using IP-Glasma initial conditions (magenta) and the iEBE-VISHNU hybrid model using AMPT (orange) or \protect\trento{} (cyan) initial conditions . Statistical and systematic uncertainties of the data points are shown as bars and boxes, respectively. The uncertainties of the hydrodynamical calculations are depicted by the thickness of the curves. The ratios of the measured $v_{\rm n}$ to a fit to the hydrodynamical calculations are also presented for clarity. | 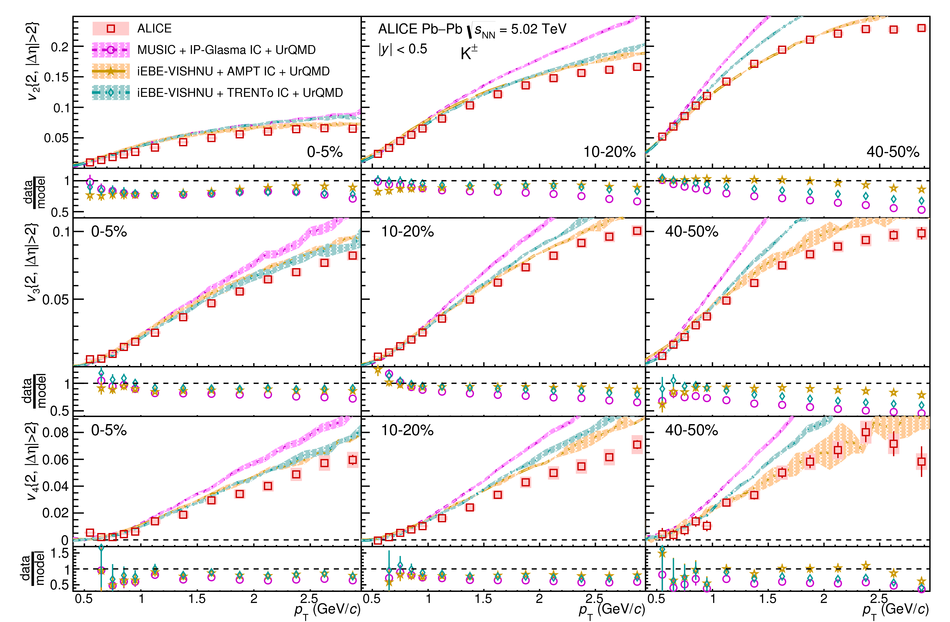 |
Figure 13
The $\pt$-differential $v_2$ (top), $v_3$ (middle), and $v_4$ (bottom) of p+\pbar{} for the 0--5\%, 10--20\%, and 40--50\% centrality classes compared to hydrodynamical calculations from MUSIC model using IP-Glasma initial conditions (magenta) and the iEBE-VISHNU hybrid model using AMPT (orange) or \protect\trento{} (cyan) initial conditions . Statistical and systematic uncertainties of the data points are shown as bars and boxes, respectively. The uncertainties of the hydrodynamical calculations are depicted by the thickness of the curves. The ratios of the measured $v_{\rm n}$ to a fit to the hydrodynamical calculations are also presented for clarity. | 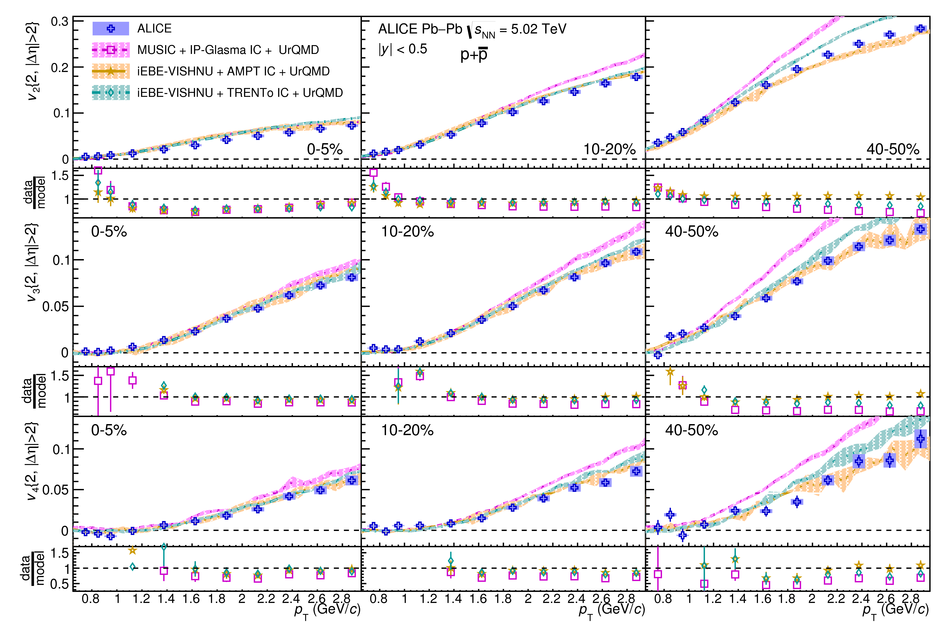 |
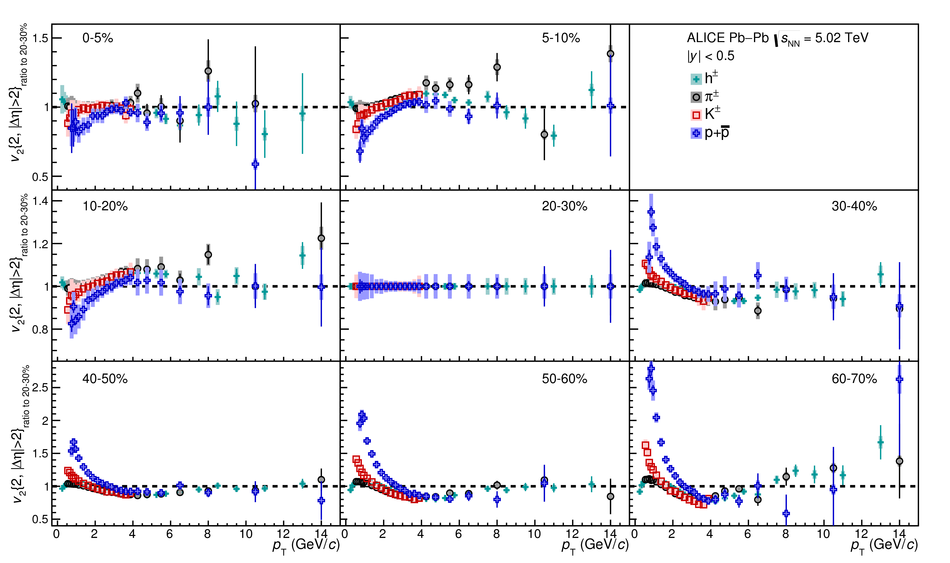
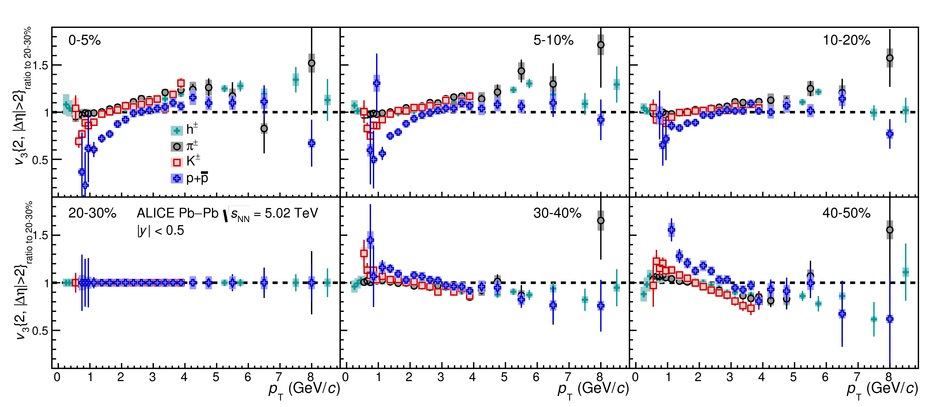
Figure 16
Centrality dependence of $\vtwopt{}_{\rm ratio to 20-30\%}$ for \pipm{} (upper panels), \kapm{} (middle panels), and p+\pbar{} (lower panels) compared to hydrodynamical calculations from the MUSIC model using IP-Glasma initial conditions (magenta) , the iEBE-VISHNU hybrid model using AMPT (orange) or \protect\trento{} (cyan) initial conditions . Statistical and systematic uncertainties of the data points are shown as bars and boxes, respectively. | 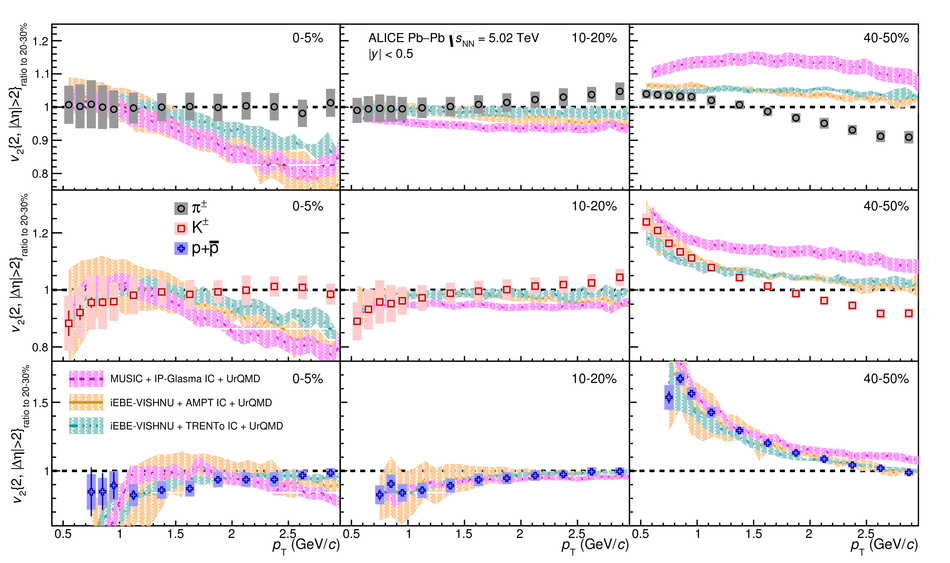 |
Figure 17
Centrality dependence of \vtwomax{} (left) and \vthreemax{} (right) divided by number of constituent quarks, $n_{\rm q}$, for \pipm{}, p+\pbar{}, \lambdas{}, and \kanull{}. Points are slightly shifted along the horizontal axis for better visibility in both panels. Statistical and systematic uncertainties are shown as bars and boxes, respectively. |  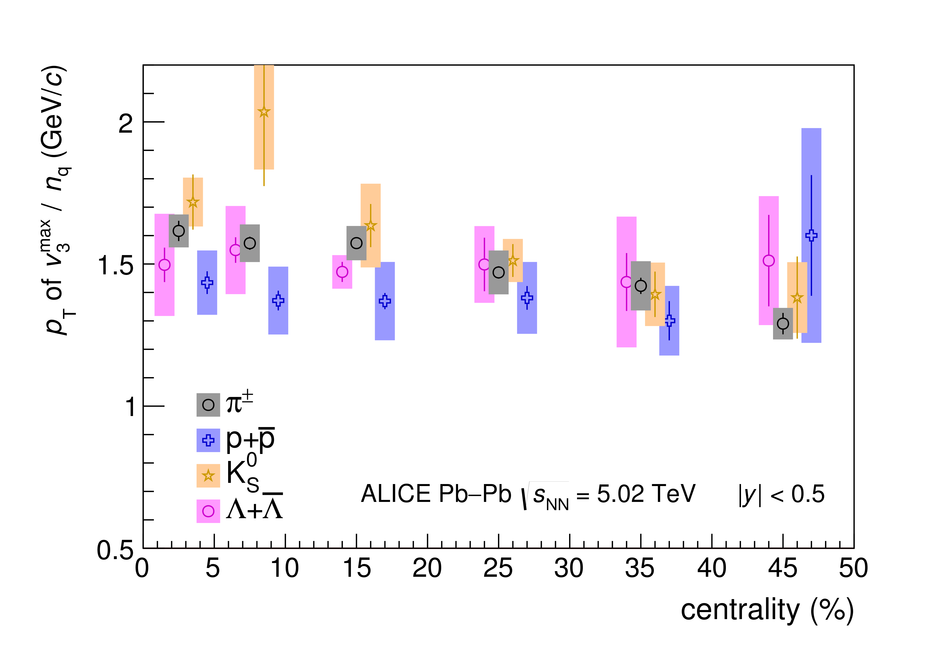 |
Figure 18
Centrality dependence of $|v_{\rm n}|^{1/{\rm n}} / \pt{}$ of inclusive charged particles , \pipm{}, \kapm{}, p+\pbar{}, \lambdas{}, \kanull{}, and the $\phi$-meson for $n=2$ (upper panels) and $n=3$ (lower panels). Statistical and systematic uncertainties are shown as bars and boxes, respectively. | 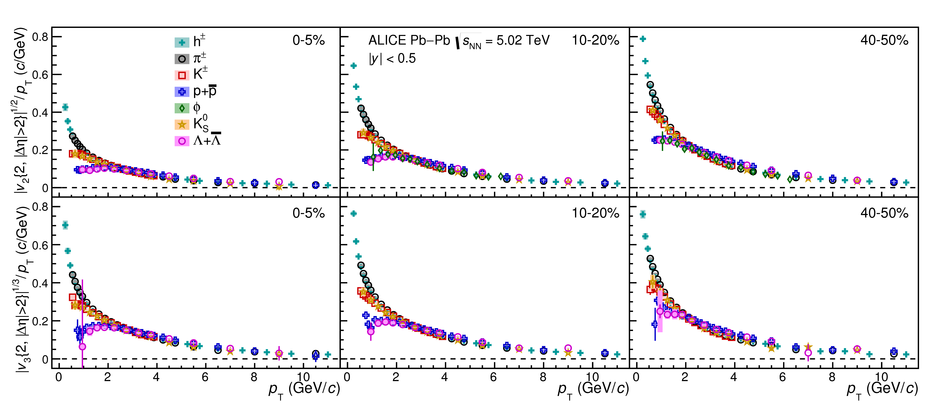 |

Figure 22
The $\pt$-differential $v_2$ (top), $v_3$ (middle), and $v_4$ (bottom) of \pipm{}, \kapm{}, and p+\pbar{} compared to ALICE measurements performed in Pb--Pb collisions at \sqrtSnn{} = 2.76 TeV (coloured bands) for the 0--5\%, 10--20\%, and 40--50\% centrality classes. For the measurements at \sqrtSnn{} = 5.02 TeV, statistical and systematic uncertainties are shown as bars and boxes, respectively. For the measurements at \sqrtSnn{} = 2.76 TeV, the thickness of the bands corresponds to the quadratic sum of statistical and systematic uncertainties. The ratios of measurements at \sqrtSnn{} = 5.02 TeV to a cubic spline fit to the measurements at \sqrtSnn{} = 2.76 TeV are also presented for clarity. |  |
Figure 23
The $\pt$-differential $v_2$ of \lambdas{}, \kanull{}, and the $\phi$-meson compared to ALICE measurements performed in Pb--Pb collisions at \sqrtSnn{} = 2.76 TeV (coloured bands) for the 0--5\%, 10--20\%, and 40--50\% centrality classes. For the measurements at \sqrtSnn{} = 5.02 TeV, statistical and systematic uncertainties are shown as bars and boxes, respectively. For the measurements at \sqrtSnn{} = 2.76 TeV, the thickness of the bands corresponds to the quadratic sum of statistical and systematic uncertainties. The ratios of measurements at \sqrtSnn{} = 5.02 TeV to a cubic spline fit to the measurements at \sqrtSnn{} = 2.76 TeV are also presented for clarity. |  |