Uncorrected semi-inclusive distributions of charged jets recoiling from a high-\pT\ hadron trigger in \pPb\ collisions at $\sqrtsNN = 5.02$\,TeV with the EA selection of 50--100\% in ZNA for $\rr = 0.4$ (top panels), and with the EA selection of 0-20\% in ZNA for $ \rr = 0.2$ (middle panels) and $\rr = 0.4$ (bottom panels). The acceptance for TT and recoil jets in the CM frame are denoted \ystarTT\ and \ystarjet, respectively. Left panels: raw distributions for TT\{12,50\} (red circles) and TT\{6,7\} (blue boxes), and the corresponding \Drecoil\ distribution (Eq. \ref{eq:Drecoil}, black circles). Right panels: ratio of yields for TT\{12,50\}/TT\{6,7\} measured by ALICE in \pPb\ collisions and calculated using detector level PYTHIA Perugia 11 simulation of \pp\ collisions at $\sqrts = 5.02$\,TeV. The PYTHIA-generated ratios in the top right and bottom right panels are the same. The arrow indicates the 0--1\,\gev\ bin which is used to calculate \cRef. The uncertainties are statistical only | 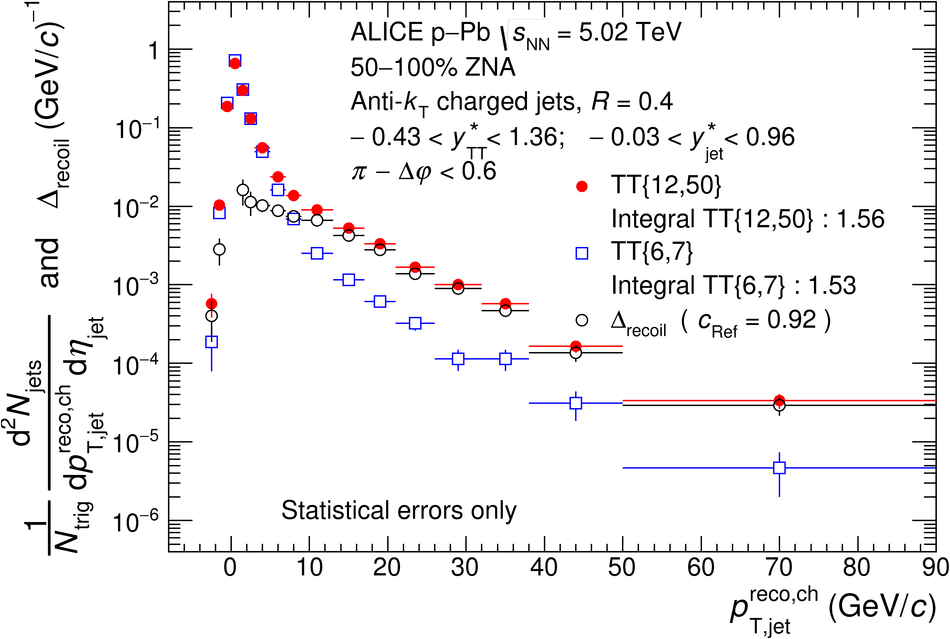  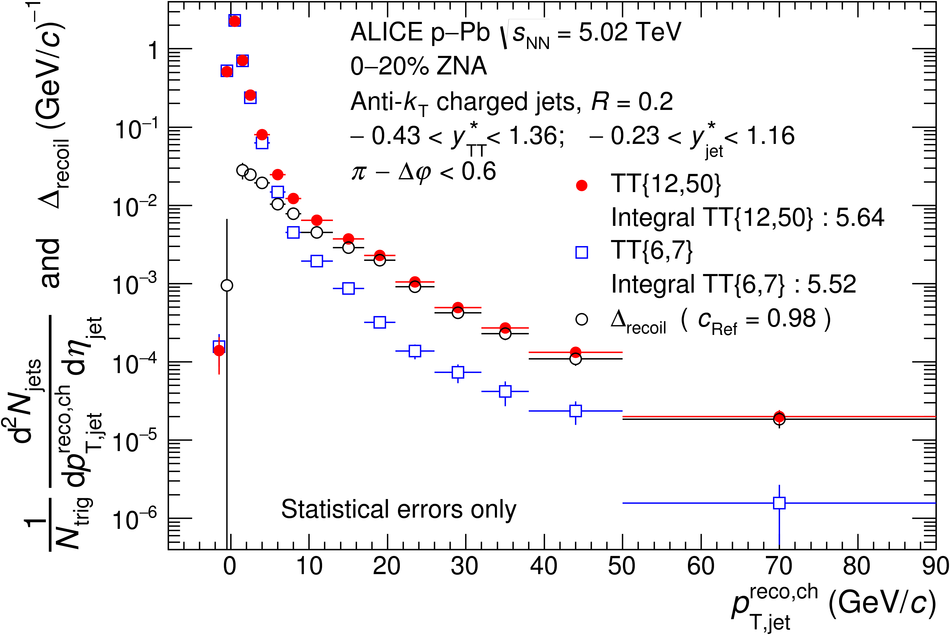  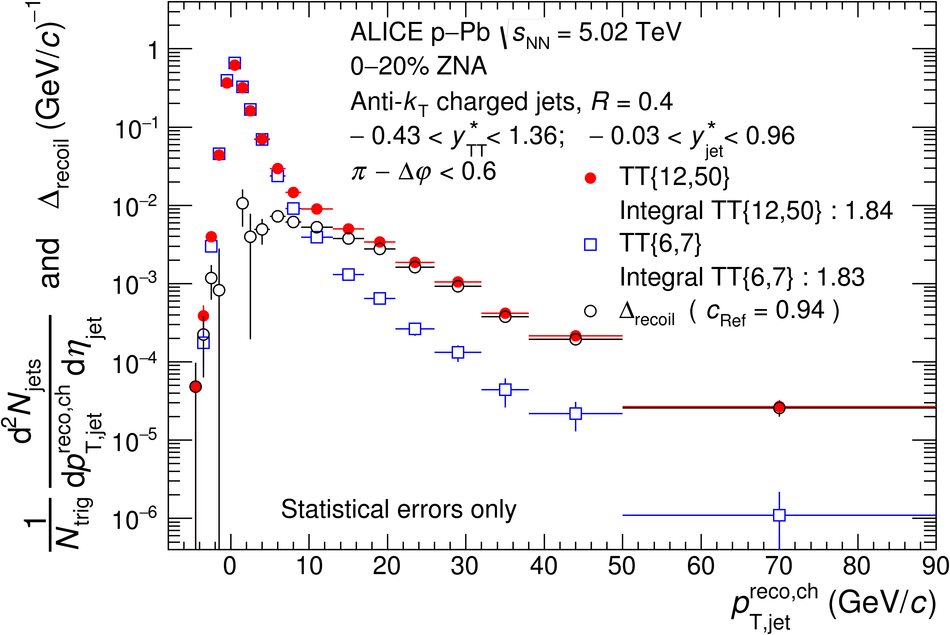 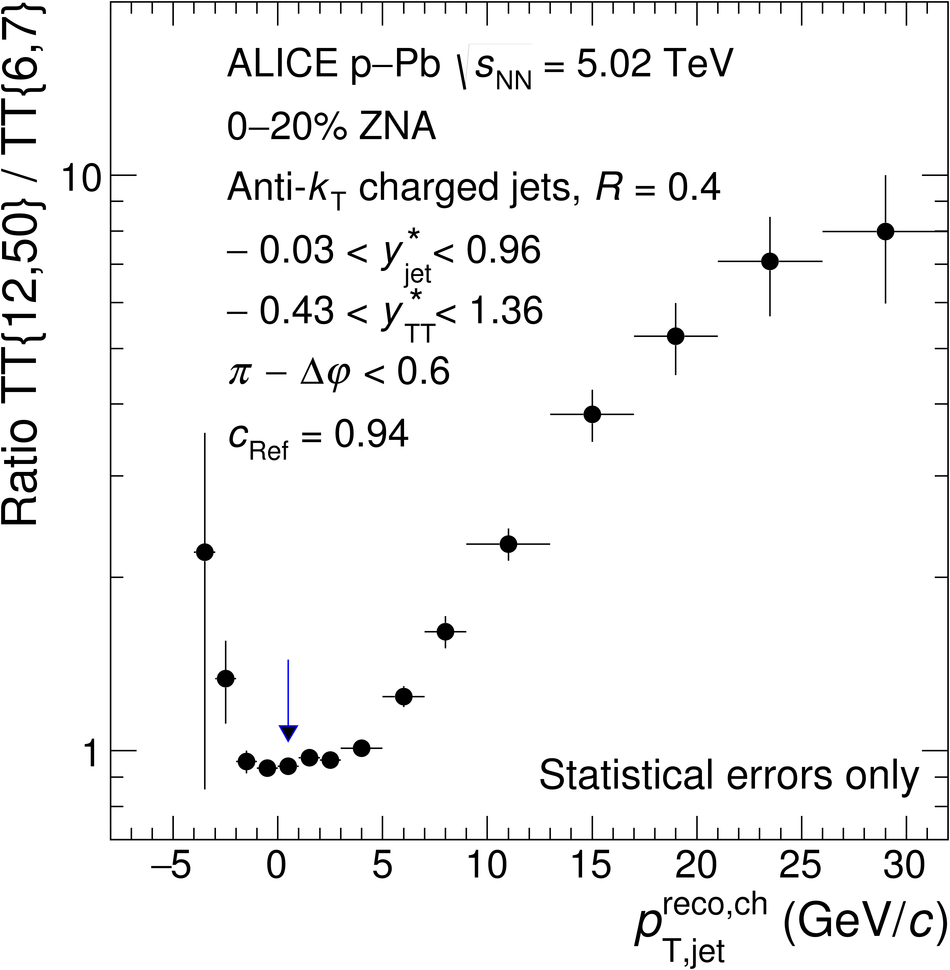 |