Distributions of the ionisation energy loss of pions and electrons with momenta of 2\gevc. The symbols represent the measurements obtained at the CERN PS with prototype read-out chambers that were smaller in overall size (active area \SI{25}{\centi\meter} $\times$ \SI{32}{\centi\meter}) but otherwise similar in construction to that of the final detector. The lines are simulations accounting (continuous line) or not (dashed line) for the long range of $\delta$-electrons as compared to the chamber dimensions. Figure taken from . \TBD{(Replace with GEANT4 once available M.Voelkl)} | 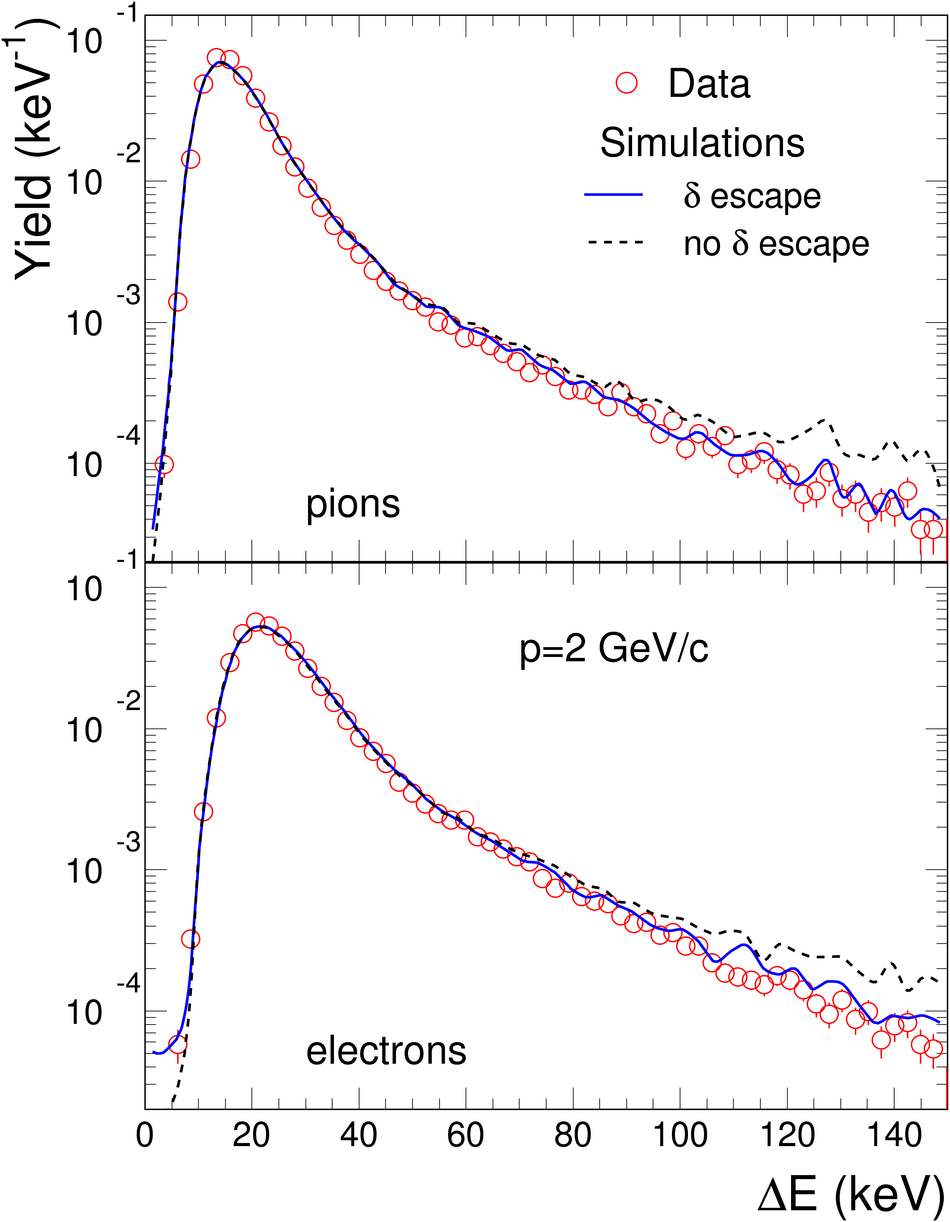 |