Azimuthally-differential pion femtoscopy relative to the third harmonic event plane in Pb-Pb collisions at $\sqrt{\textit{s}_{_{\rm NN}}}$ = 2.76 TeV

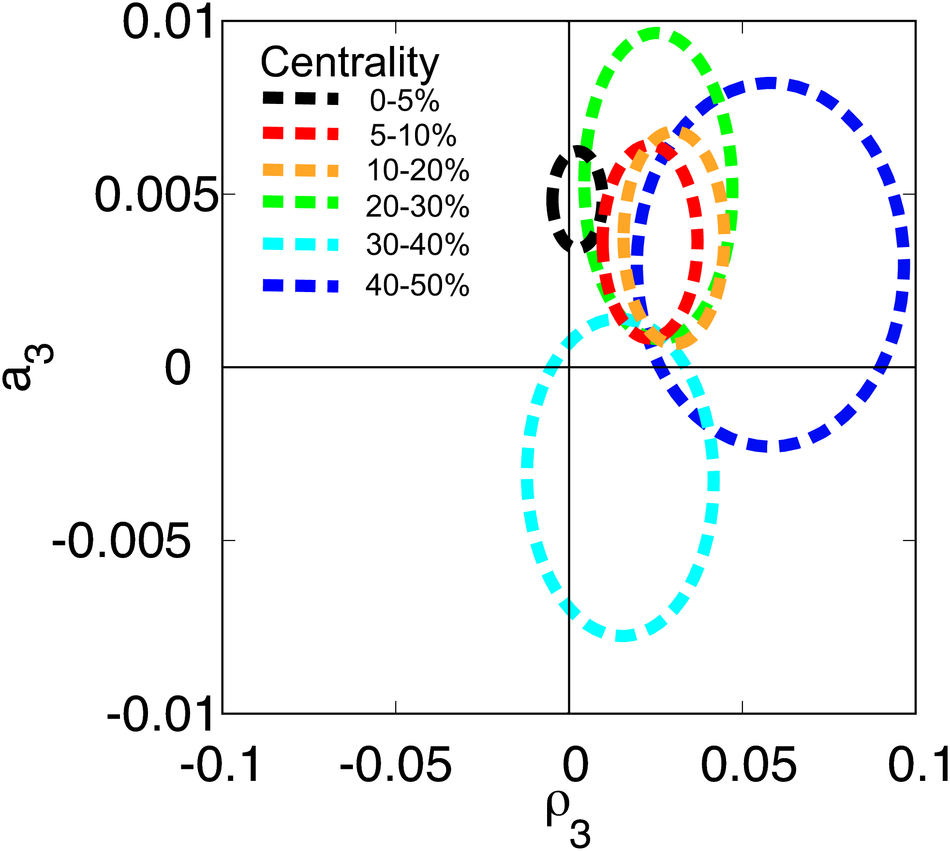
Azimuthally-differential femtoscopic measurements, being sensitive to spatio-temporal characteristics of the source as well as to the collective velocity fields at freeze out, provide very important information on the nature and dynamics of the system evolution. While the HBT radii oscillations relative to the second harmonic event plane measured recently reflect mostly the spatial geometry of the source, model studies have shown that the HBT radii oscillations relative to the third harmonic event plane are predominantly defined by the velocity fields. In this Letter, we present the first results on azimuthally-differential pion femtoscopy relative to the third harmonic event plane as a function of the pion pair transverse momentum $k_{\rm T}$ for different collision centralities in Pb-Pb collisions at $\sqrt{s_{\rm NN}}=2.76$ TeV. We find that the $R_{\rm side}$ and $R_{\rm out}$ radii, which characterize the pion source size in the directions perpendicular and parallel to the pion transverse momentum, oscillate in phase relative to the third harmonic event plane, similar to the results from 3+1D hydrodynamical calculations. The observed radii oscillations unambiguously signal a collective expansion and anisotropy in the velocity fields. A comparison of the measured radii oscillations with the Blast-Wave model calculations indicate that the initial state triangularity is washed-out at freeze out.


Phys. Lett. B 785 (2018) 320
HEP Data
e-Print: arXiv:1803.10594 | PDF | inSPIRE
CERN-EP-2018-035

Figure 1

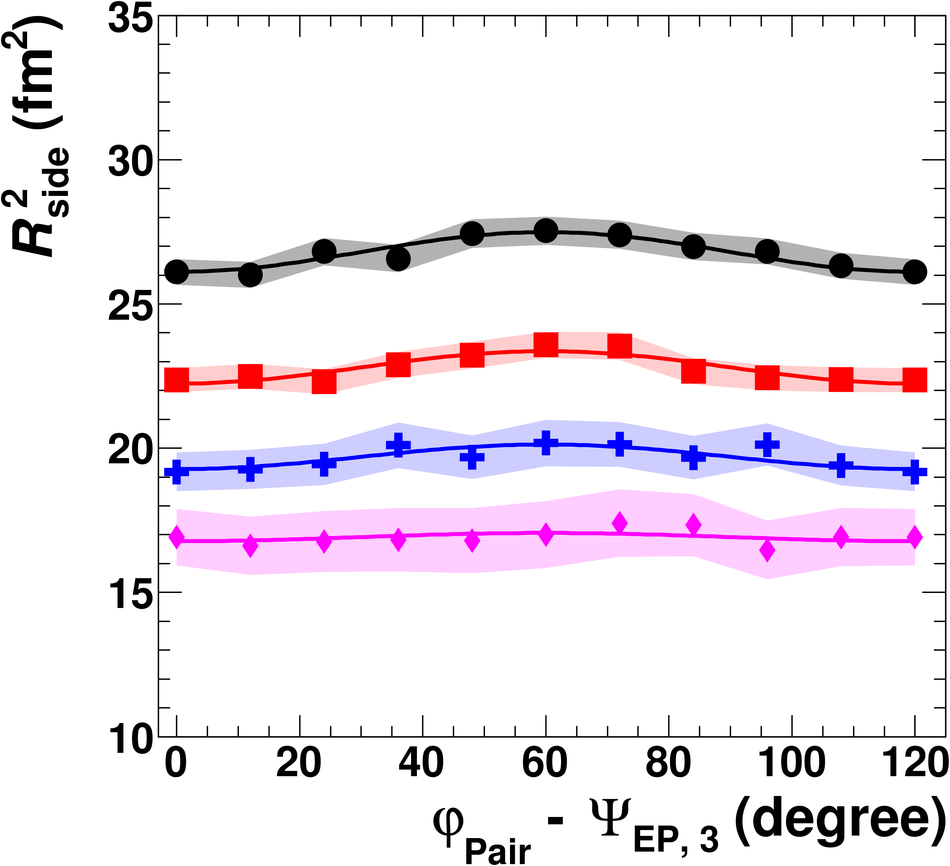
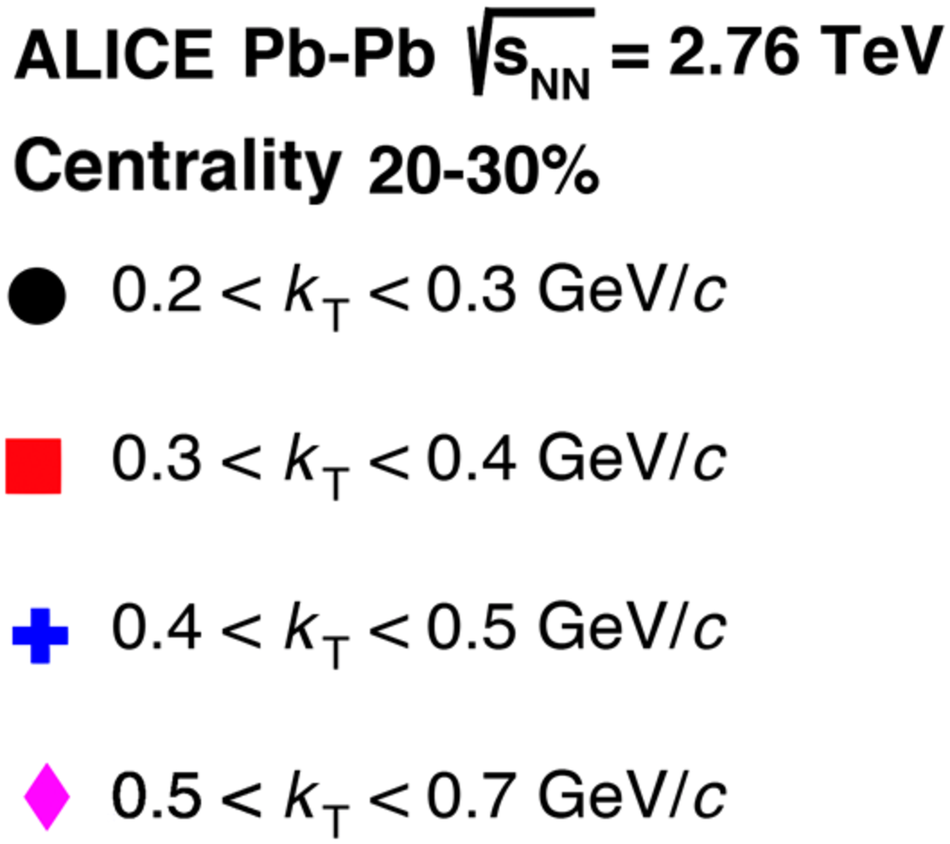
The azimuthal dependence of $R^{2}_{\rm out}$, $R^{2}_{\rm side}$, and $R^{2}_{\rm long}$ as a function of $\dphi=\mathrm{\varphi_{pair}}-\Psi_{3}$ for centrality percentile 20--30\% and four different $\kt$ ranges. Solid lines represent the fit to the functional forms of Eq. \ref{eq:radii_osc}. The shaded bands show the systematic uncertainty.

Figure 2

The amplitudes of radii oscillations $R^{2}_{\rm out,3}$, $R^{2}_{\rm side,3}$, $R^{2}_{\rm long,3}$, and $R^{2}_{\rm os,3}$ versus centrality percentiles for four $\kt$ ranges. Square brackets indicate systematic uncertainties

Figure 3

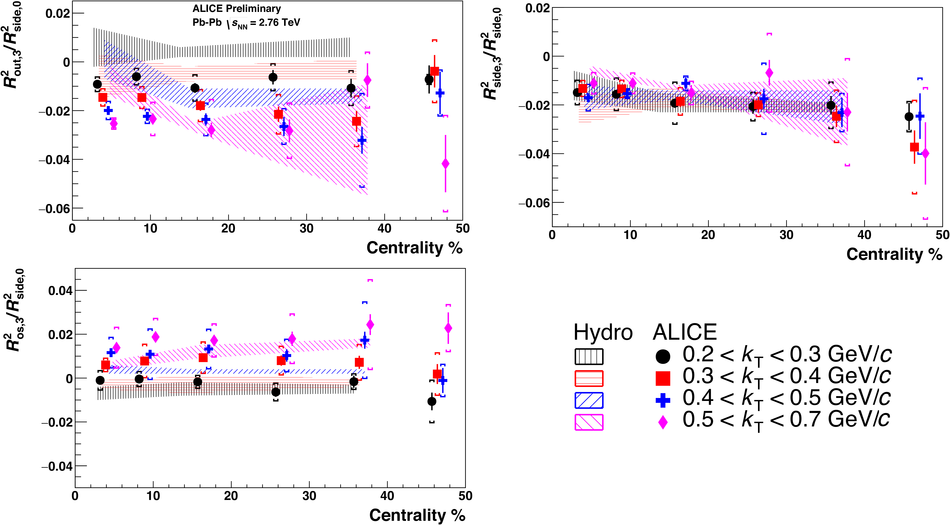
Amplitudes of the relative radii oscillations $R^{2}_{\rm out,3}/R^{2}_{\rm side,0}$, $R^{2}_{\rm side,3}/R^{2}_{\rm side,0}$, and $R^{2}_{\rm os,2}/R^{2}_{\rm side,0}$ versus centrality for four $\kt$ ranges. Square brackets indicate systematic uncertainties. The shaded bands are the 3+1D hydrodynamical calculations  and the width of the bands represent the uncertainties in the model calculations

Figure 4

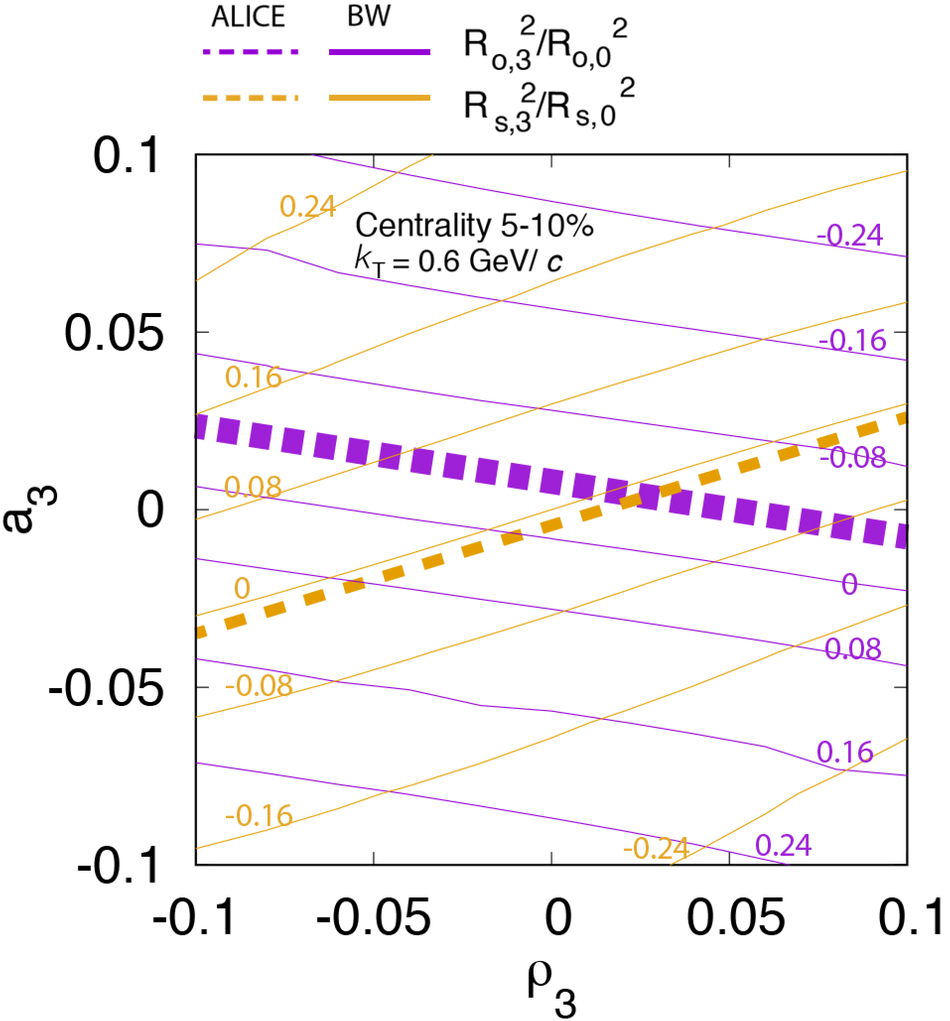
The relative amplitudes of the radius oscillations $R^{2}_{{\rm out},3}/R^{2}_{{\rm out},0}$, and $R^{2}_{{\rm side},3}/R^{2}_{{\rm side},0}$ on the third-order anisotropies in space ($a_{3}$) and transverse flow ($\rho_{3}$) for the centrality range 5--10\% and $\kt$ = 0.6 \gevc from the Blast-Wave model . The thin dashed lines show the lines of a constant relative amplitude, in magenta for $R^{2}_{{\rm out},3}/R^{2}_{{\rm out},0}$ and in dark yellow for  $R^{2}_{{\rm side},3}/R^{2}_{{\rm side},0}$. The thick lines show the corresponding ALICE results, with width of the lines representing the experimental uncertainties.

Figure 5

Blast-Wave model  source parameters, final spatial ($a_{3}$) and transverse flow ($\rho_{3}$) anisotropies, for different centrality ranges, as obtained from the fit to ALICE radii oscillation parameters. The contours represent the one sigma uncertainty.