The multiplicity dependence of the pseudorapidity density of charged particles in proton-proton (pp) collisions at centre-of-mass energies $\sqrt{s}$ = 5.02, 7 and 13 TeV measured by ALICE is reported. The analysis relies on track segments measured in the midrapidity range ($|\eta| <~ 1.5$). Results are presented for inelastic events having at least one charged particle produced in the pseudorapidity interval $|\eta|<~1$ ($\mathrm{INEL}_{>0}$). The multiplicity dependence of the pseudorapidy density of charged particles is measured with mid and forward rapidity multiplicity estimators, the latter being less affected by autocorrelations. A detailed comparison with predictions from the PYTHIA 8 and EPOS LHC event generators is also presented. Both generators provide a good description of the data.
Eur. Phys. J. C 81 (2021) 630
HEP Data
e-Print: arXiv:2009.09434 | PDF | inSPIRE
CERN-EP-2020-170

Figure 4
The panels in the first and third row show the normalised pseudorapidity density distributions of charged particles in pp collisions at \s = 5.02, 7 and \unit[13]{TeV} compared with different models for the 0--1\% and 70--100\% multiplicity classes by the forward rapidity multiplicity estimator, respectively. The panels in the second and fourth row report the corresponding model/data ratio. Note that the multiplicity classes of the models correspond to \multcc, which is slightly different from the \multc\ of the ALICE data. | 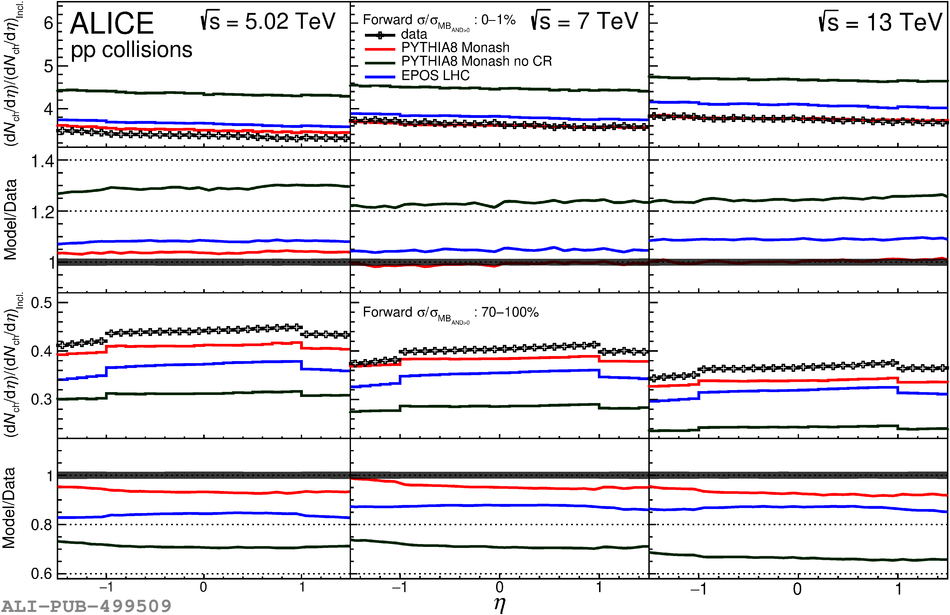 |
Figure 5
The panels in the first and third row show the normalised pseudorapidity density distributions of charged particles in pp collisions at \s = 5.02, 7 and \unit[13]{TeV} compared with different models for the 0--1\% and 70--100\% multiplicity classes by the midrapidity multiplicity estimator, respectively. The panels in the second and fourth row report the corresponding model/data ratio. The multiplicity classes of the models correspond to \multcc, which is slightly different from the \multc\ of the ALICE data. | 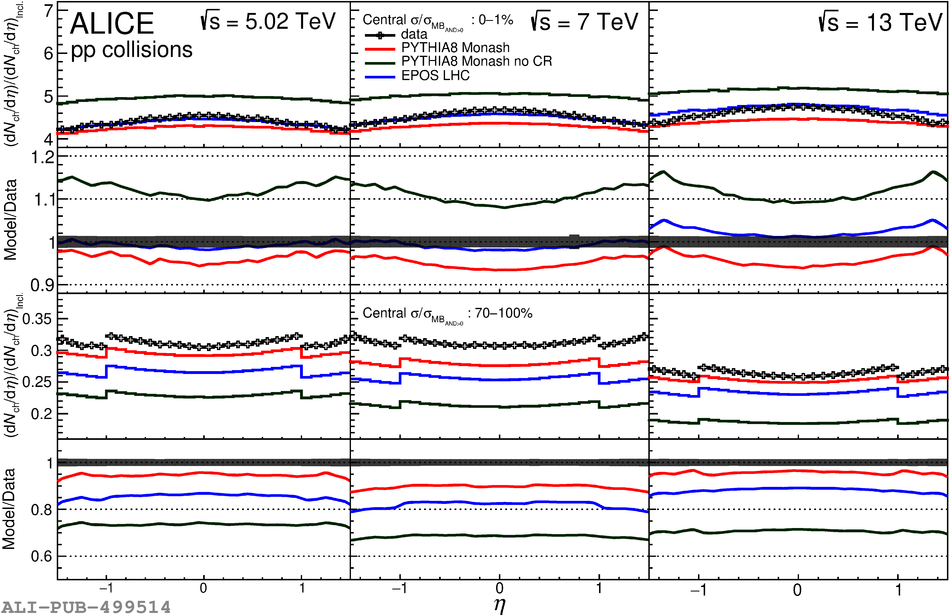 |
Figure 6
Energy dependence of \avdndeta\ (upper) and \avdndeta\ scaled by the inclusive \dndeta\ (lower) for the multiplicity classes by the forward multiplicity estimator in pp collisions. Lines show fits with a power-law function $s^\alpha$. Corresponding bands indicate one standard deviation of the fit. Exponents and corresponding uncertainties of the fit are listed in the legend. | 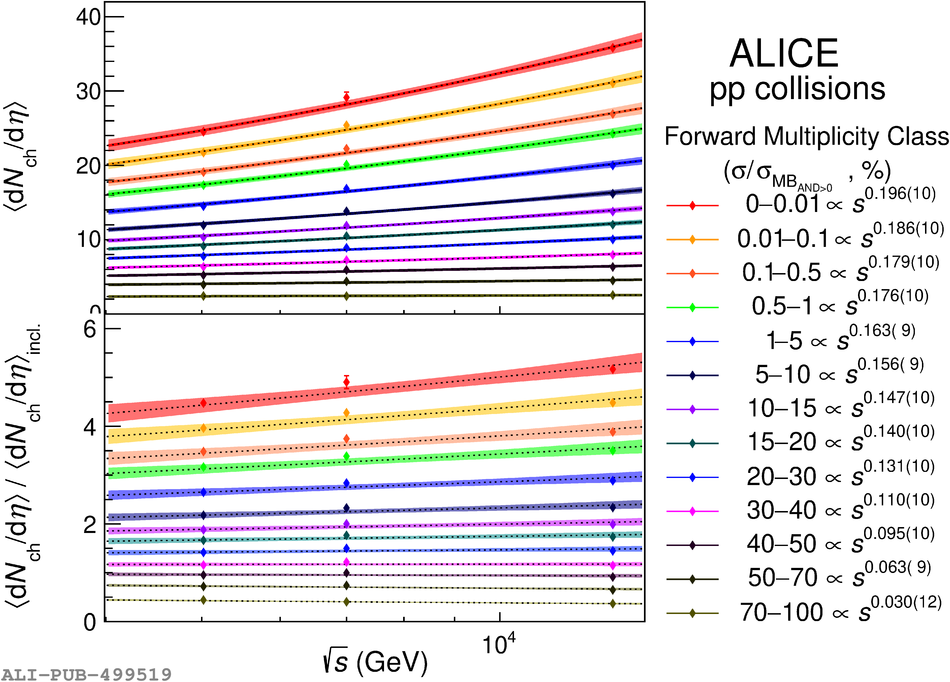 |