The panels in the first and third row show the normalised pseudorapidity density distributions of charged particles in pp collisions at \s = 5.02, 7 and \unit[13]{TeV} compared with different models for the 0--1\% and 70--100\% multiplicity classes by the midrapidity multiplicity estimator, respectively. The panels in the second and fourth row report the corresponding model/data ratio. The multiplicity classes of the models correspond to \multcc, which is slightly different from the \multc\ of the ALICE data. | 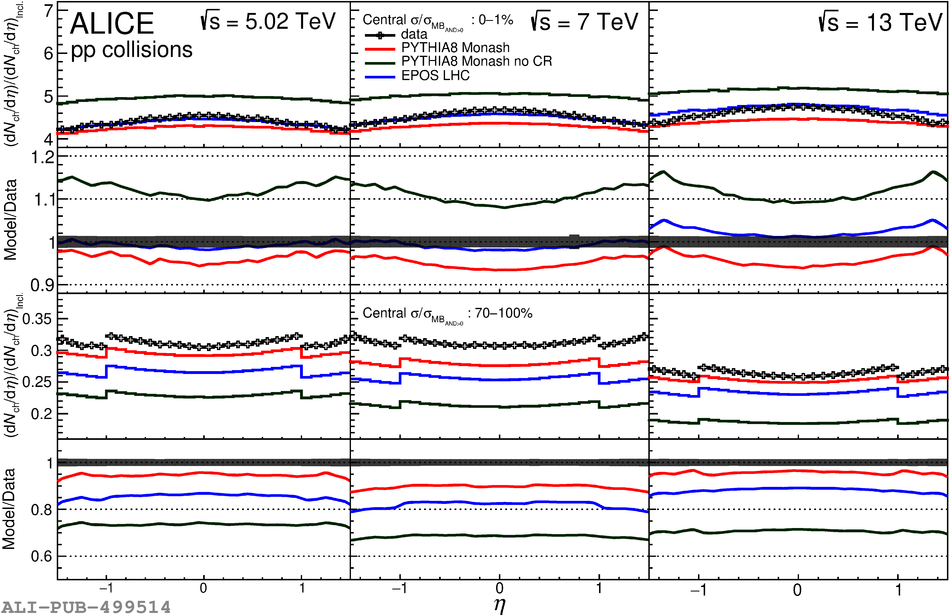 |