KNO-scaled distribution $\left< \nch\right>\mathrm{P}\left(\nch\right)$ versus the KNO variable ${\nch}/{\left< \nch\right>}$ at $\sqrt{s} =$ 0.9, 2.76, 7 and 8 TeV, for three pseudorapidity intervals: $|\eta| < $ 0.5 (top), 1.0 (middle) and 1.5 (bottom). In each case, ratios to the distribution at $\sqrt{s} = 0.9$ TeV are shown, on the right-hand side parts of the figures. As ${\nch}/{\left< \nch\right>}$ takes different values at different centre-of-mass energies, ratios were obtained by interpolating the KNO-scaled distributions, and uncertainties were taken from the nearest data point. Bands represent the total uncertainties. | 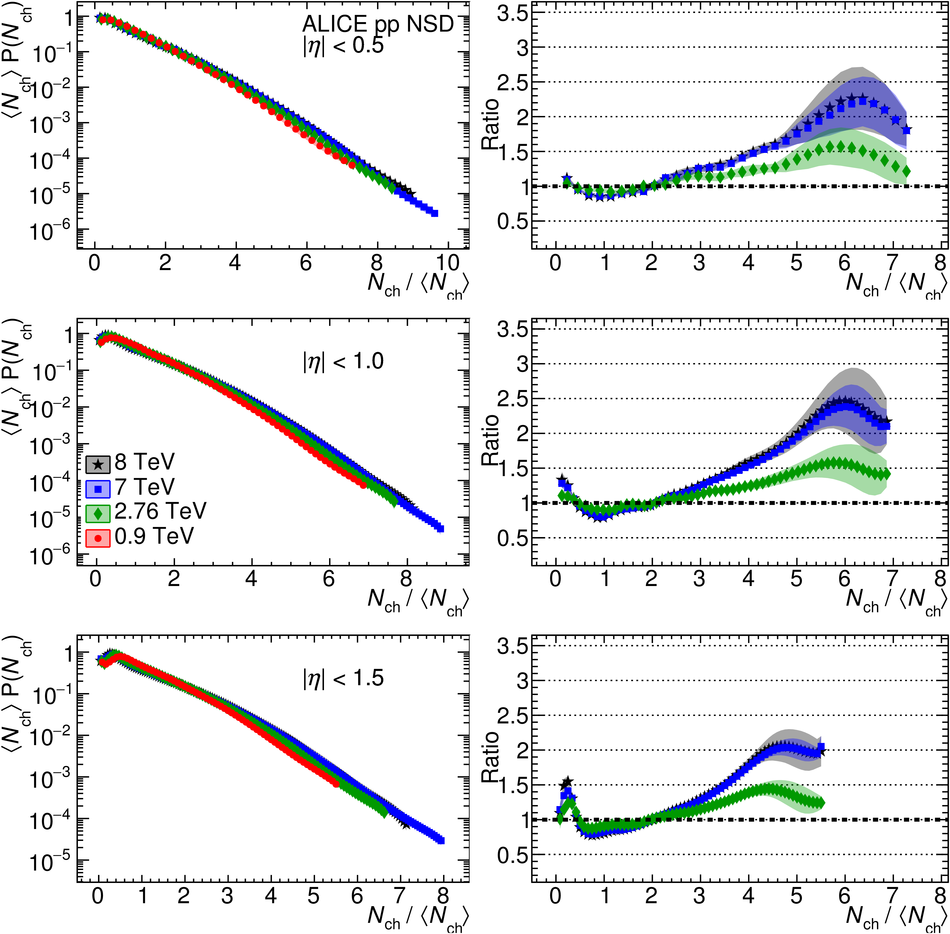 |