Charged-particle multiplicities in proton-proton collisions at $\sqrt{s}$ = 0.9 to 8 TeV

A detailed study of pseudorapidity densities and multiplicity distributions of primary charged particles produced in proton-proton collisions, at $\sqrt{s} =$ 0.9, 2.36, 2.76, 7 and 8 TeV, in the pseudorapidity range $|\eta|<~2$, was carried out using the ALICE detector. Measurements were obtained for three event classes: inelastic, non-single diffractive and events with at least one charged particle in the pseudorapidity interval $|\eta|<~1$. The use of an improved track-counting algorithm combined with ALICE's measurements of diffractive processes allows a higher precision compared to our previous publications. A KNO scaling study was performed in the pseudorapidity intervals $|\eta|<~$ 0.5, 1.0 and 1.5. The data are compared to other experimental results and to models as implemented in Monte Carlo event generators PHOJET and recent tunes of PYTHIA6, PYTHIA8 and EPOS.


Eur. Phys. J. C 77 (2017) 33
HEP Data
e-Print: arXiv:1509.07541 | PDF | inSPIRE
CERN-PH-EP-2015-259

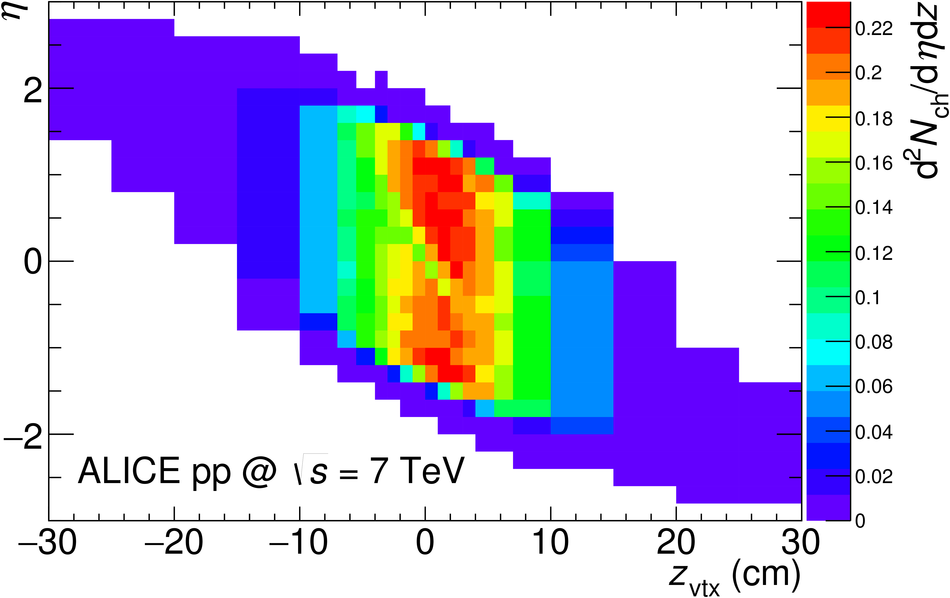
Figure 1

For a data sample of events fulfilling the MB$_{\rm{OR}}$ trigger selection, at $\sqrt{s} = 7$ TeV, the distribution of the quantity ${\rm d}^2\nch$/${\rm d}\eta{\rm d}z$ is plotted for tracklets, in the plane pseudorapidity ($\eta$) vs. $z$ position of the SPD vertex ($z_{\rm vtx}$), showing the dependence of the $\eta$ acceptance on $z_{\rm vtx}$.

Figure 2

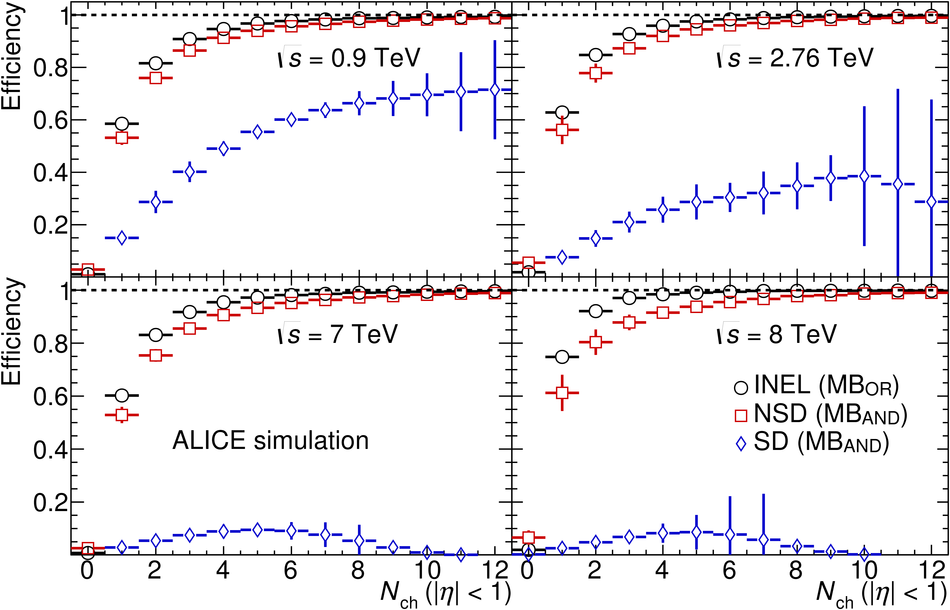
Charged-particle multiplicity ($\nch =$ number of primary charged particles generated in $|\eta| < 1$) dependence of the efficiency of the event selection described in Section 4, obtained as the average between PYTHIA6 Perugia0 and PHOJET, both tuned for single diffraction defined for $M_X < 200$ GeV/$c^2$ (see [47]). Efficiencies are given for INEL events with MB$_{\rm{OR}}$ trigger (open circles), NSD events with \mband trigger (open squares), and SD events with MB$_{\rm{AND}}$ trigger (open diamonds), at $\sqrt{s} = $ 0.9 TeV (top left), 2.76 TeV (top right), 7 TeV (bottom left) and 8 TeV (bottom right). Error bars correspond to the difference between the two event generators and statistical uncertainty added in quadrature (non-negligible only for the SD events selection efficiency).

Figure 3

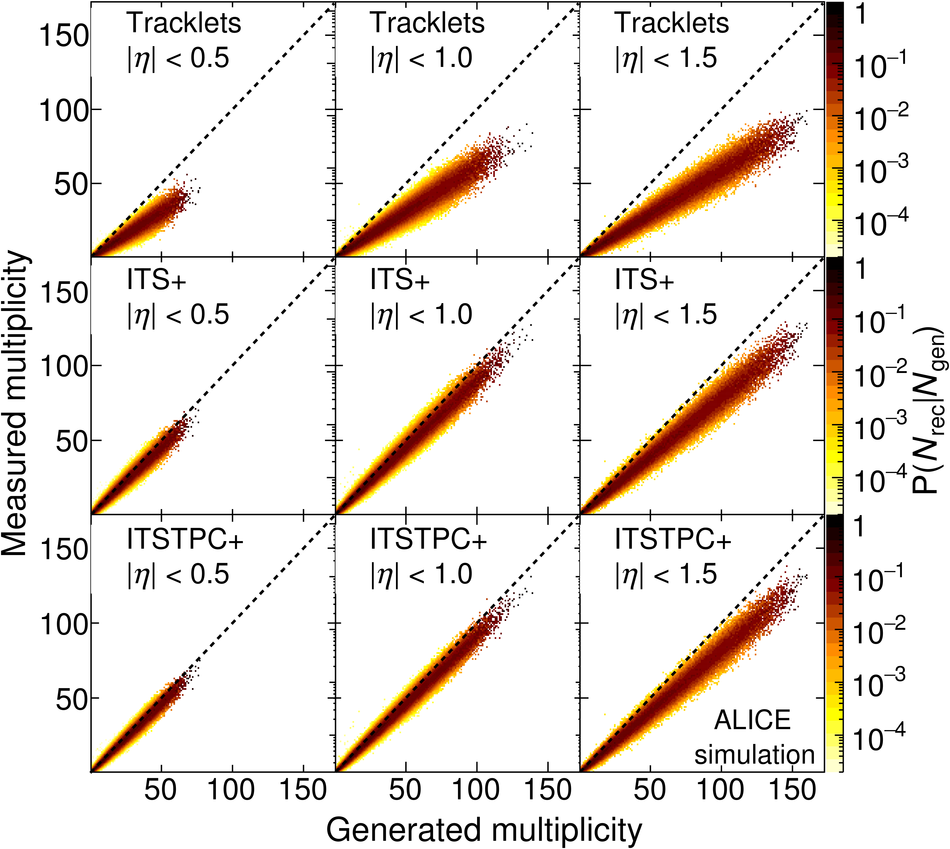
Graphical representation of the detector response matrices obtained with PYTHIA6 CSC combined with a simulation of the ALICE detector, at $\sqrt{s} = 7$ TeV, for three pseudorapidity intervals ($|\eta| < $ 0.5, 1.0, and 1.5 from left to right, respectively), and for the three track counting algorithms, Tracklet, ITS$+$ and ITSTPC$+$, from top to bottom, respectively. Horizontal axes show generated primary charged-particle multiplicities and vertical axes measured multiplicities.

Figure 4

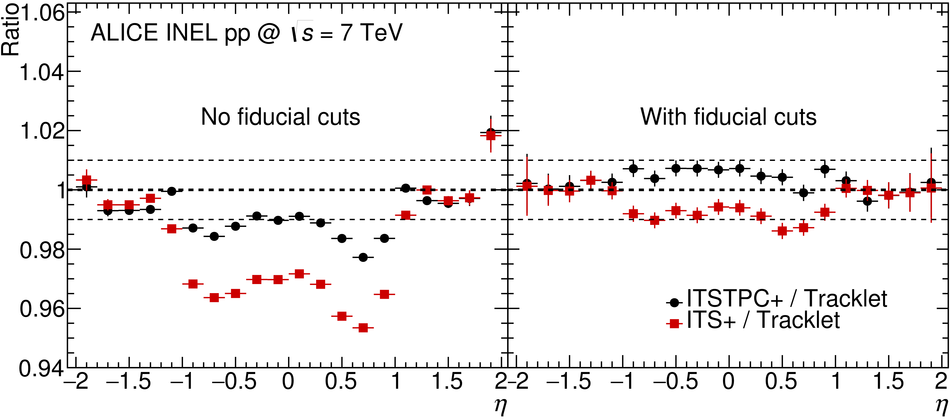
The three multiplicity algorithms are compared, after full correction, (left) without and (right) with fiducial cuts in azimuthal angles. Ratios of ${\rm d}\nch$/${\rm d}\eta$ measurements with different algorithms are shown: ITSTPC$+$ over Tracklet (black circles) and ITS$+$ over Tracklet (red squares).

Figure 5

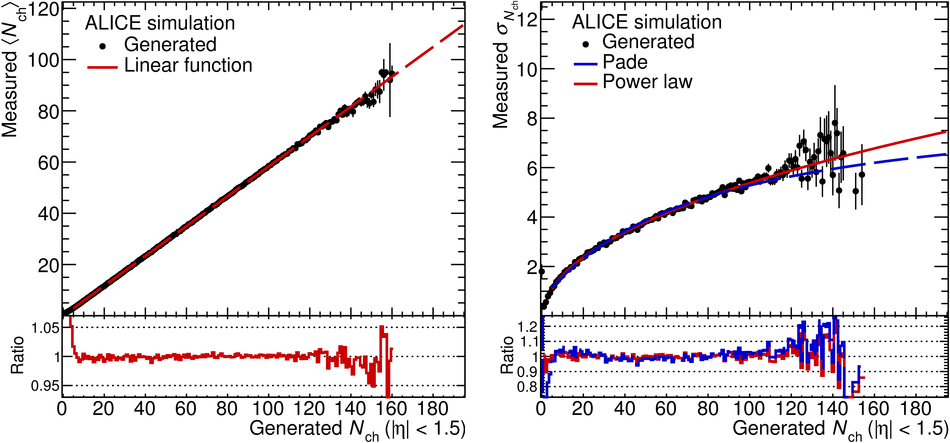
Example of Gaussian parameterization of the response matrix, at $\sqrt{s} =$ 7 TeV, for $|\eta| < 1$: (left) parameterization of the mean values, with a linear function (red dashed line); (right) parameterization of the widths, with a Padé function (red solid line) and a power law function (blue dashed line). The bottom parts of the figures show the ratios between data and fits.

Figure 6

(left) At $\sqrt{s} = 7$ TeV, average raw $\pt$ vs. raw charged track multiplicity in $|\eta| < 1$, for data (black circles), PYTHIA6 Perugia0 (blue dashed line) and ATLAS-CSC (red dotted line). The bottom part of the figure shows the ratios of the two simulated distributions to the data; (right) Comparison of ${\rm d}\nch$/${\rm d}\eta$ evaluations, as a function of $\eta$, using correction maps obtained with (a) PYTHIA6 Perugia0 (blue dashed line), (b) PYTHIA6 ATLAS-CSC (red dotted line) and (c) the average between (a) and (b); The bottom part of the figure shows the ratios of corrected distributions from (a) and (b) to the average.

Figure 7

Total relative systematic uncertainty on ${\rm d}\nch$/${\rm d}\eta$ (thick black lines), as a function of pseudorapidity, compared to run-to-run fluctuations (thin red dashed lines) at $\sqrt{s} = 0.9$ TeV (top row), 2.76 TeV (second row), 7 TeV (third row) and 8 TeV (bottom row), for the INEL, NSD and INEL$>$0 event classes, as indicated.

Figure 8

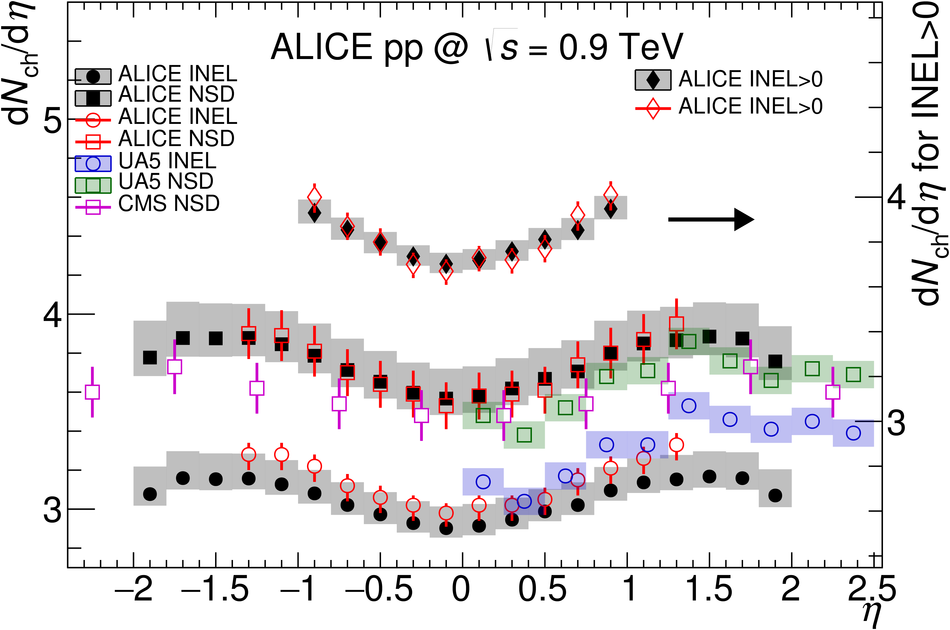
${\rm d}\nch$/${\rm d}\eta$ vs. $\eta$ at $\sqrt{s} = 0.9$ TeV, for the three normalizations defined in the text, and a comparison with ALICE previous measurements , UA5 and CMS . Note that to avoid overlap of data points on the figure, the INEL$>$0 data were displaced vertically, and for these data the scale is to be read off the right-hand side vertical axis. Systematic uncertainties on previous data are shown as error bars (except for UA5, with coloured bands), while they are shown as grey bands for the data from this publication.

Figure 9

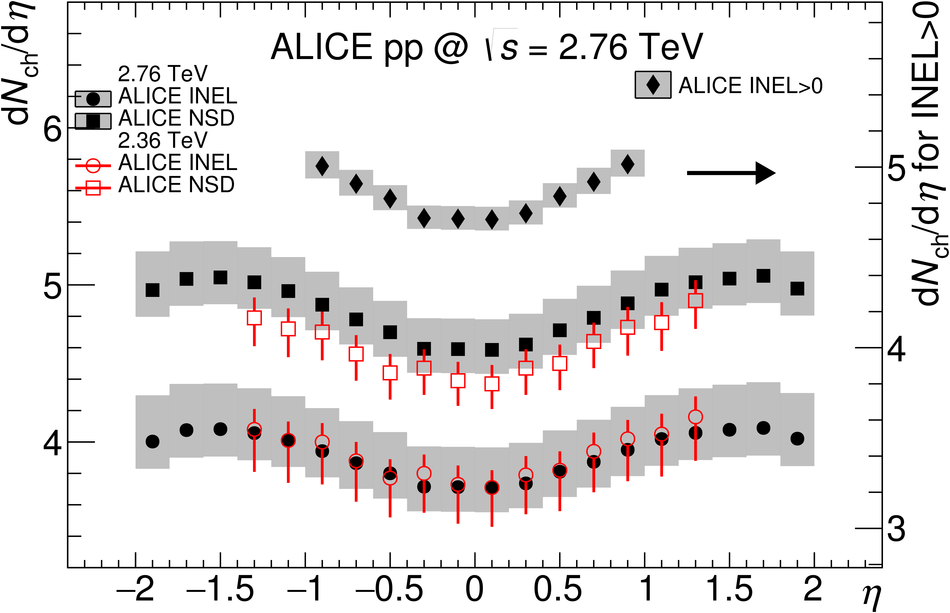
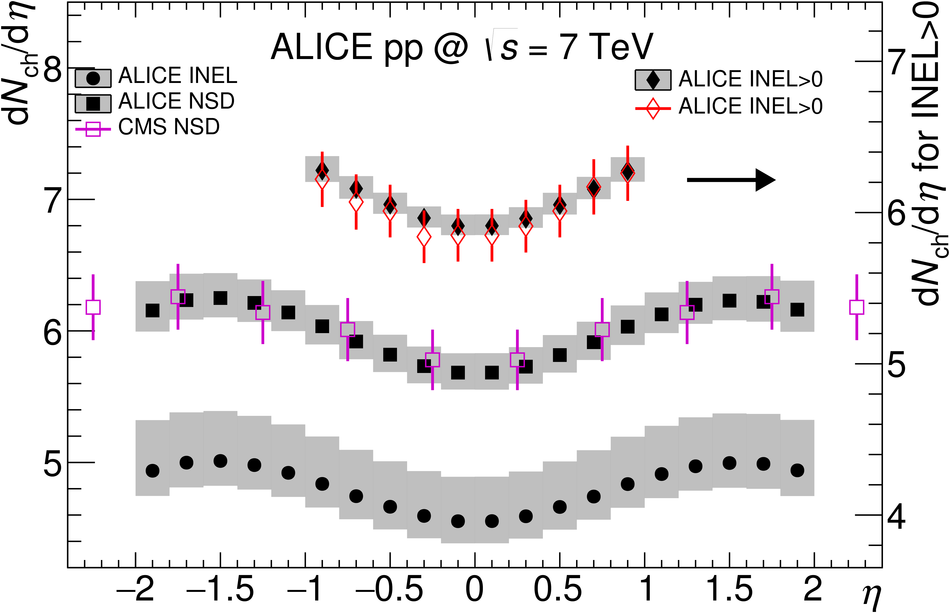
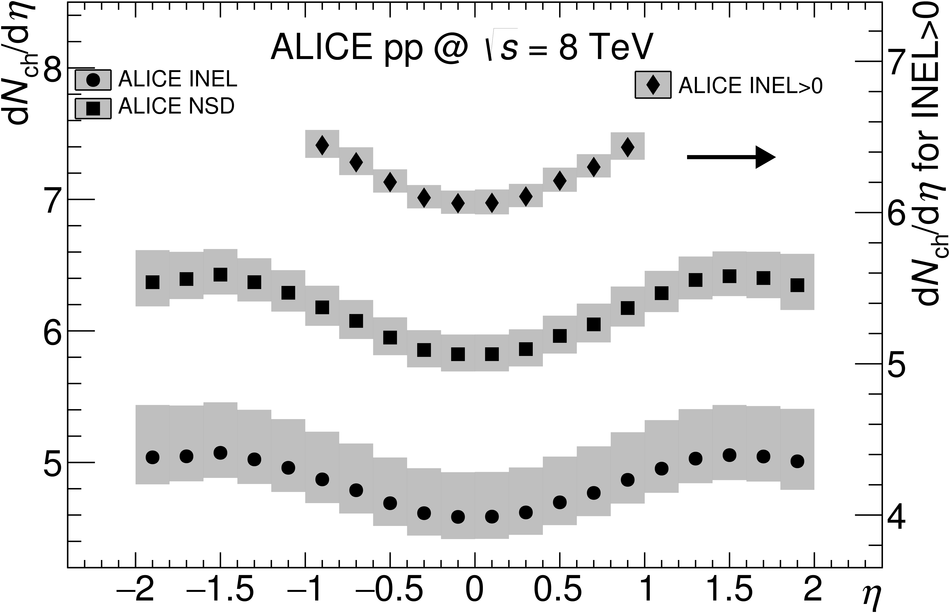
${\rm d}\nch$/${\rm d}\eta$ vs. $\eta$ measurements: $\sqrt{s} = 2.76$ TeV compared with $\sqrt{s} = 2.36$ TeV taken from ALICE (top); $\sqrt{s}=$ 7 TeV and comparison with CMS and ALICE data (middle); $\sqrt{s} = 8$ TeV (bottom). Systematic uncertainties are shown as error bars for the previous data and as grey bands for the data from this publication. The scale is to be read off the right-hand side axis for INEL$>$0.

Figure 10

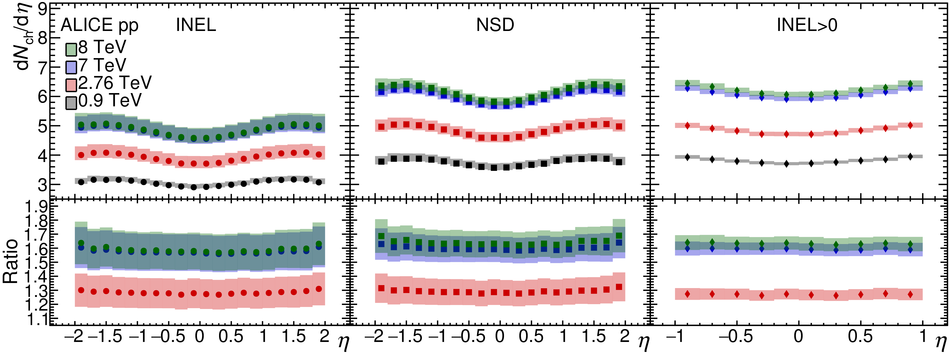
Comparison of ${\rm d}\nch$/${\rm d}\eta$ vs. $\eta$ measurements between the various centre-of-mass energies considered in this study: INEL (left), NSD (middle), and INEL$>$0 (right). The lower parts of the figures show the ratios of data at energies indicated to the data at 0.9 TeV, with corresponding colours. Systematic uncertainties are indicated as coloured bands.

Figure 11

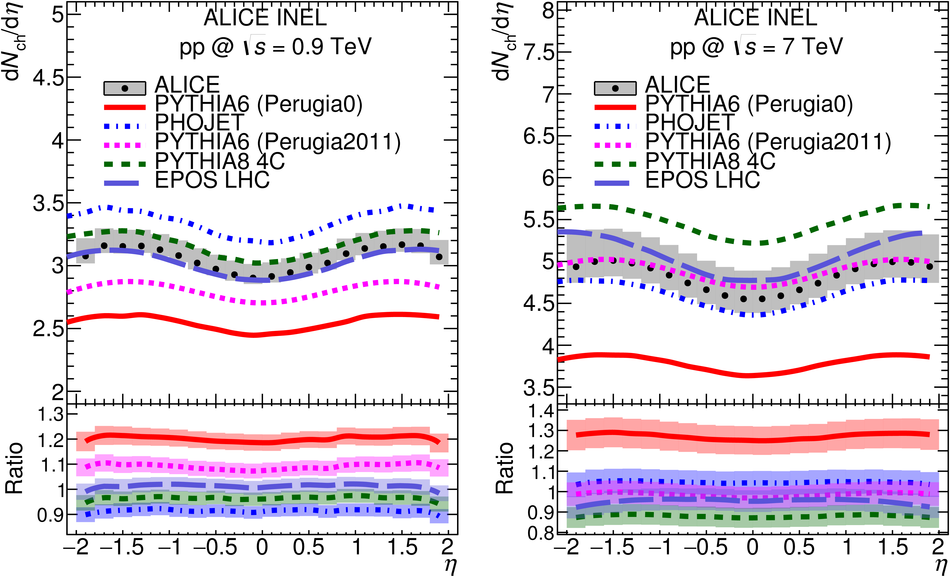
Comparison with models of ALICE measurements of ${\rm d}\nch$/${\rm d}\eta$ versus $\eta$ for the INEL event class, at $\sqrt{s} = 0.9$ (left) and 7 TeV (right): ALICE data (black circles with grey band), PYTHIA6 tune Perugia0 (red continuous line), PHOJET (blue dot-dashed line), PYTHIA6 tune Perugia 2011 (pink dashed line), PYTHIA8 4C (green dashed line), EPOS LHC (long dashed light blue line). The lower parts of the figures show ratios of data to simulation. Systematic uncertainties on ratios are indicated by coloured bands.

Figure 12

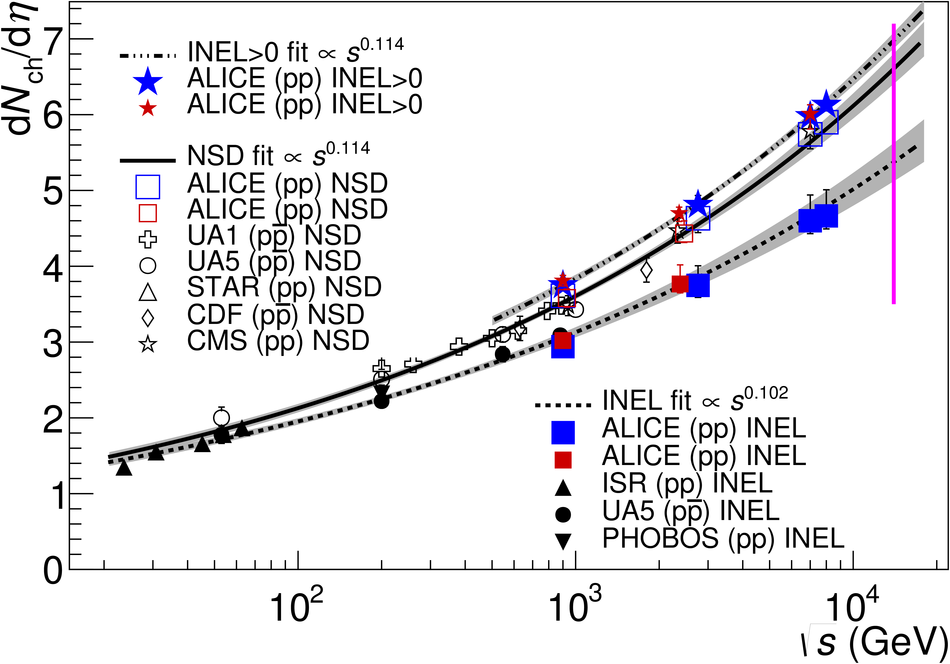
Charged-particle pseudorapidity density in the pseudorapidity region $|\eta| < 0.5$ (${\rm d}\nch$/${\rm d}\eta$ at $\eta = 0$ calculated as the integral of the data over $|\eta| < 0.5$) for INEL, NSD, and INEL$>$0 collisions, as a function of the centre-of-mass energy. Lines indicate fits with a power-law dependence on $\sqrt{s}$. Grey bands represent the one standard deviation range. Data points at the same energy have been shifted horizontally for visibility. The LHC nominal centre-of-mass energy is indicated by a vertical line. Data other than from ALICE used in this figure are taken from references [25, 33, 66, 68–75].

Figure 13

Measured multiplicity distributions in three pseudorapidity ranges for INEL events. The dashed and solid lines show the single and double NBD fits (see Section 9.5). Shaded areas represent statistical and systematic uncertainties combined: (a) data at $\sqrt{s} = 0.9$ TeV (top left); (b) data at $\sqrt{s} = 2.76$ TeV (top right); (c) data at $\sqrt{s} = 7$ TeV (bottom left); (d) data at $\sqrt{s} = 8$ TeV (bottom right). Ratios of data to the fits are also shown, with shaded areas representing combined systematic and statistical uncertainties.

Figure 14

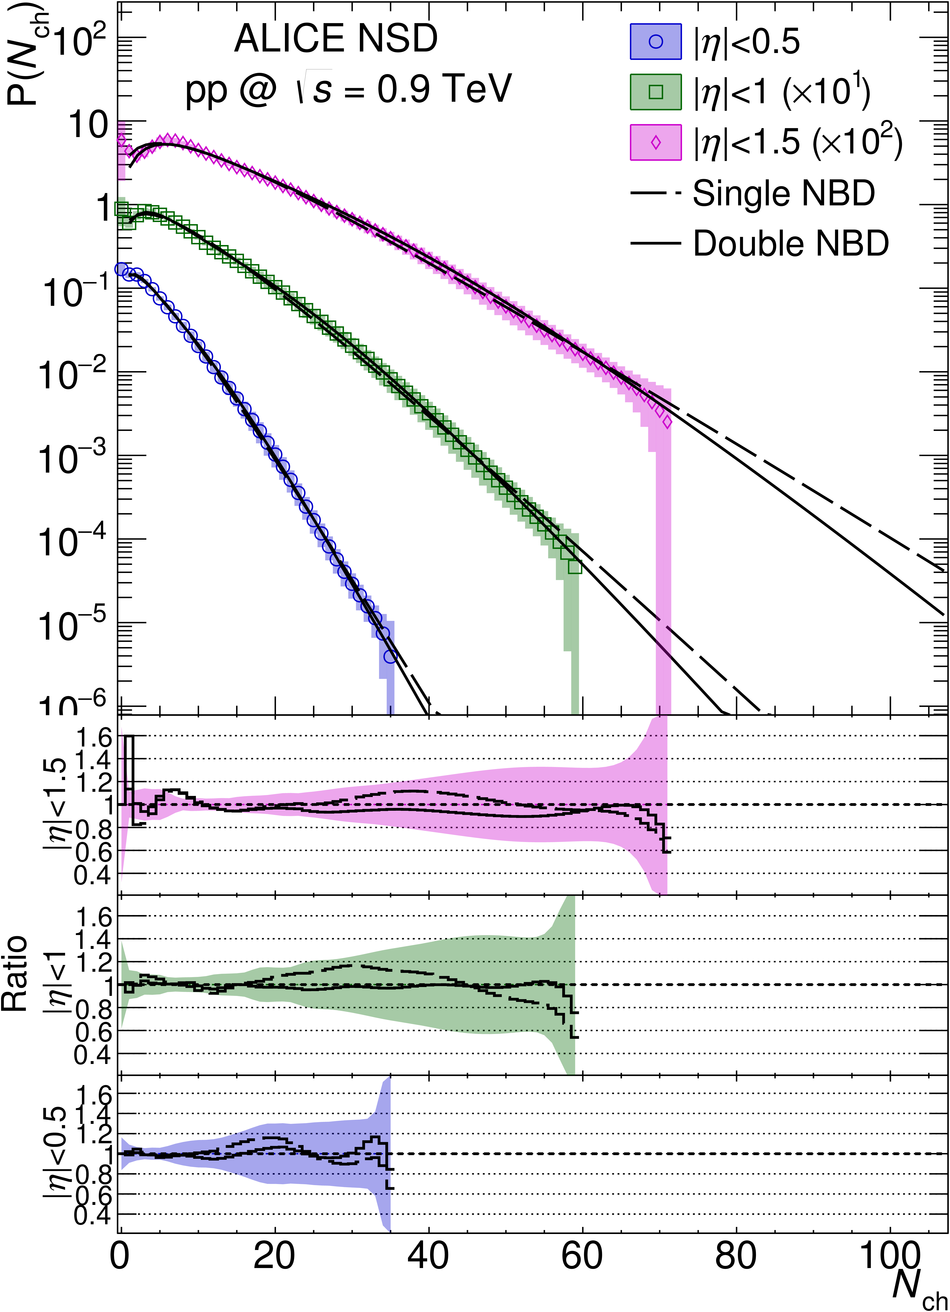
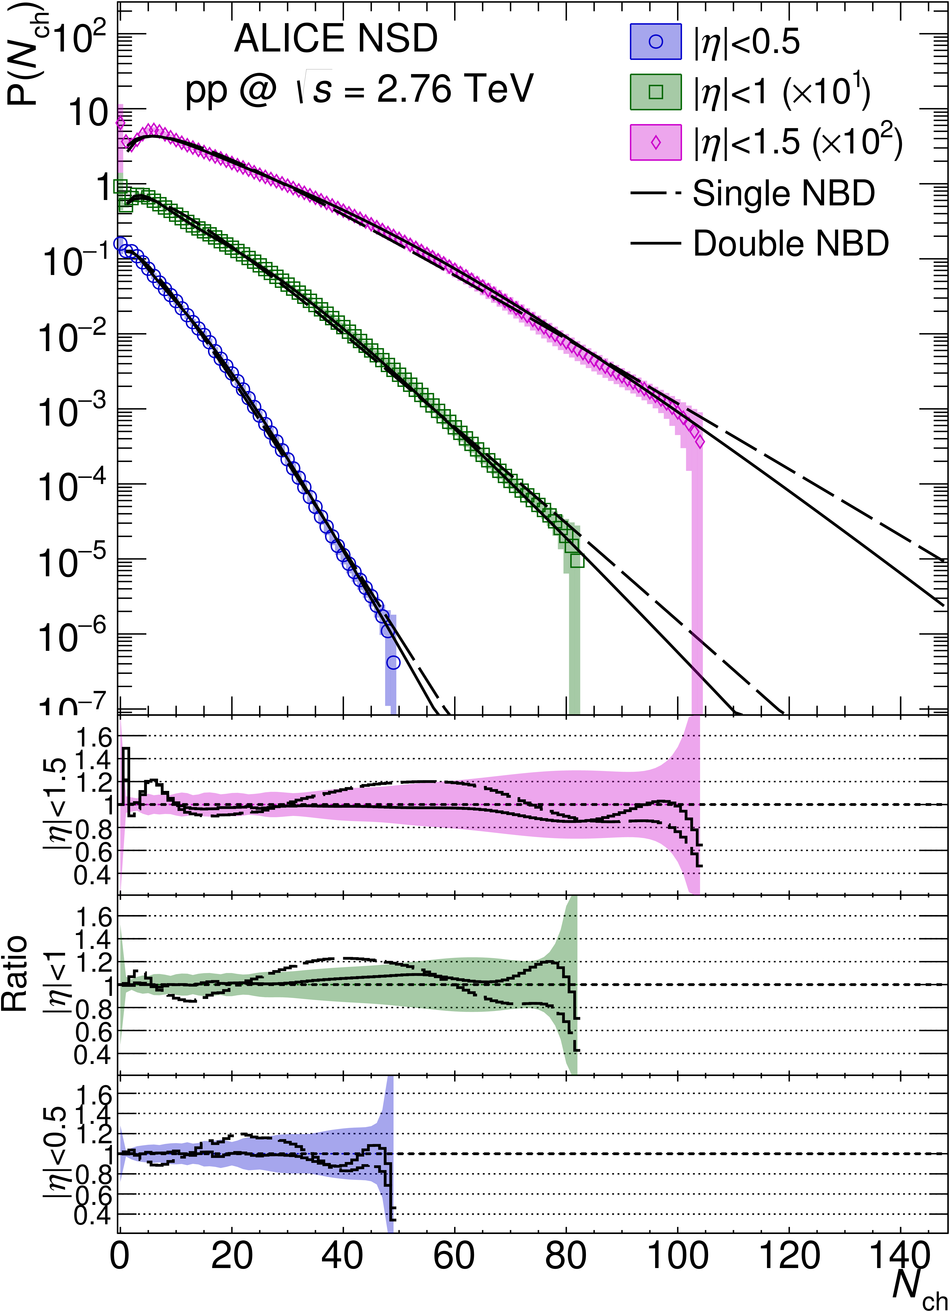
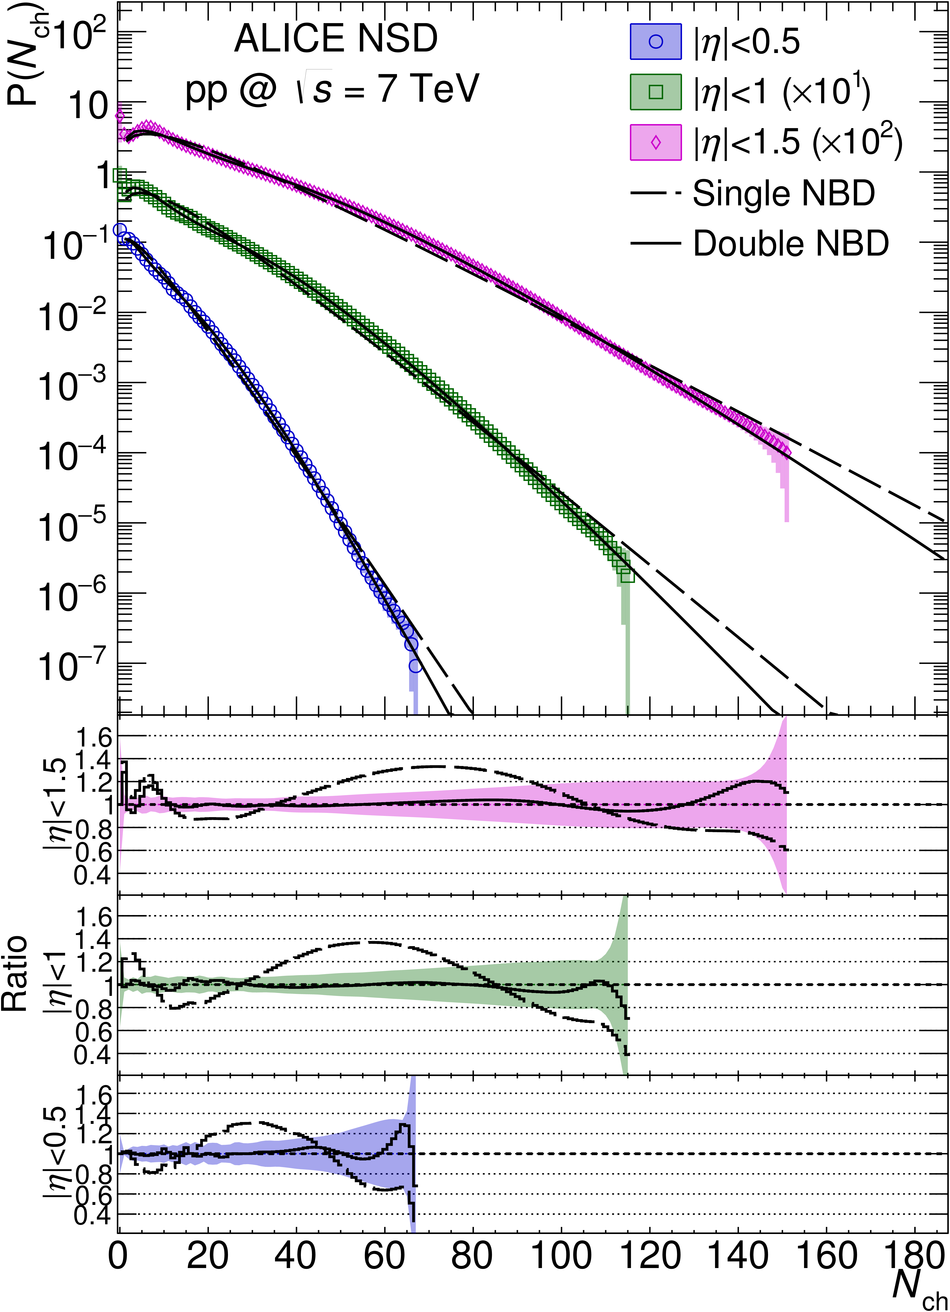
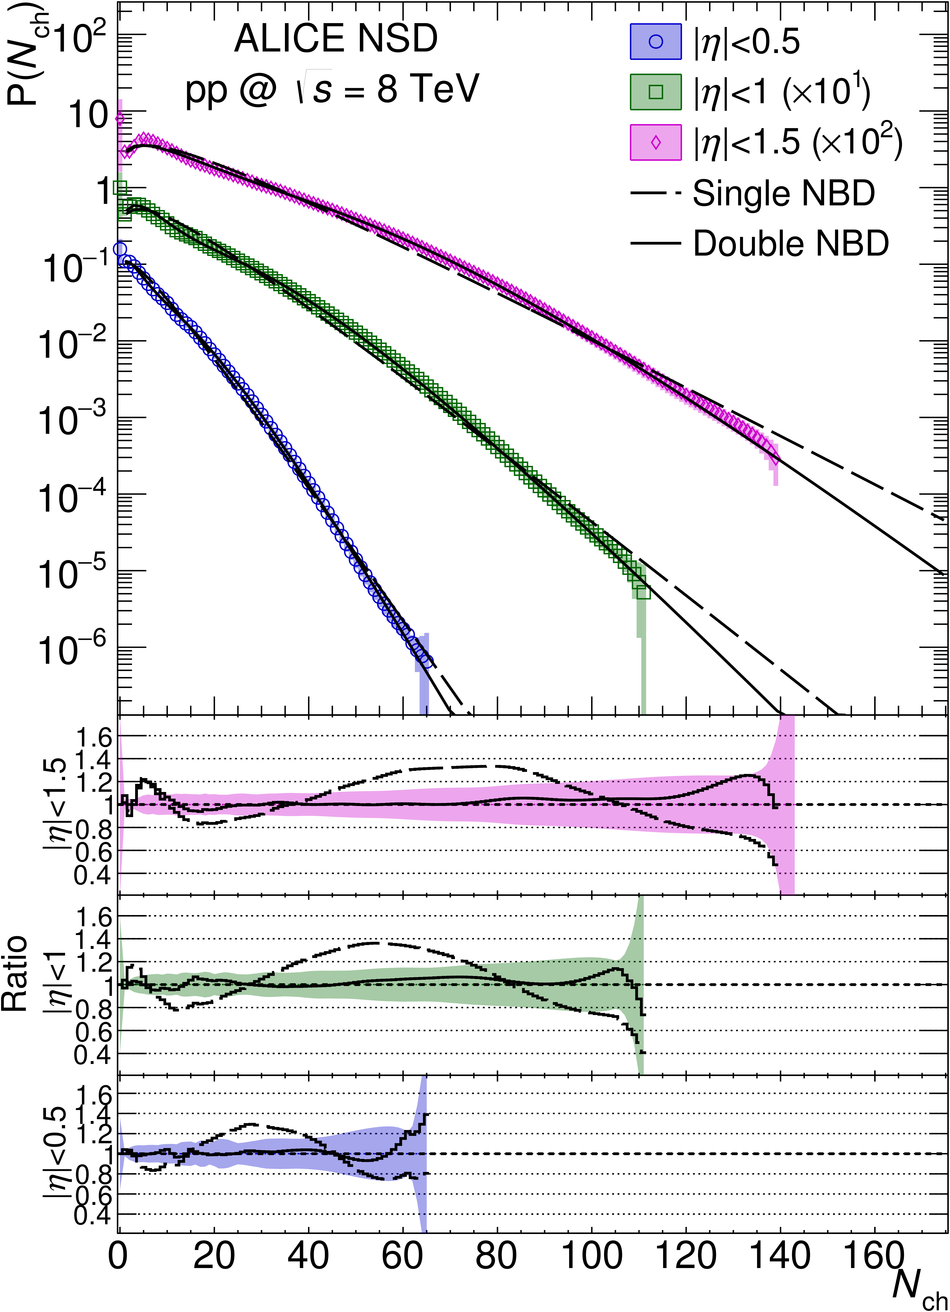
Measured multiplicity distributions in three pseudorapidity ranges for NSD events. The dashed and solid lines show the single and double NBD fits (see Section 9.5). Shaded areas represent statistical and systematic uncertainties combined: (a) data at $\sqrt{s} = 0.9$ TeV (top left); (b) data at $\sqrt{s} = 2.76$ TeV (top right); (c) data at $\sqrt{s} = 7$ TeV (bottom left); (d) data at $\sqrt{s} = 8$ TeV (bottom right). Ratios of data to the fits are also shown, with shaded areas representing combined systematic and statistical uncertainties.

Figure 15

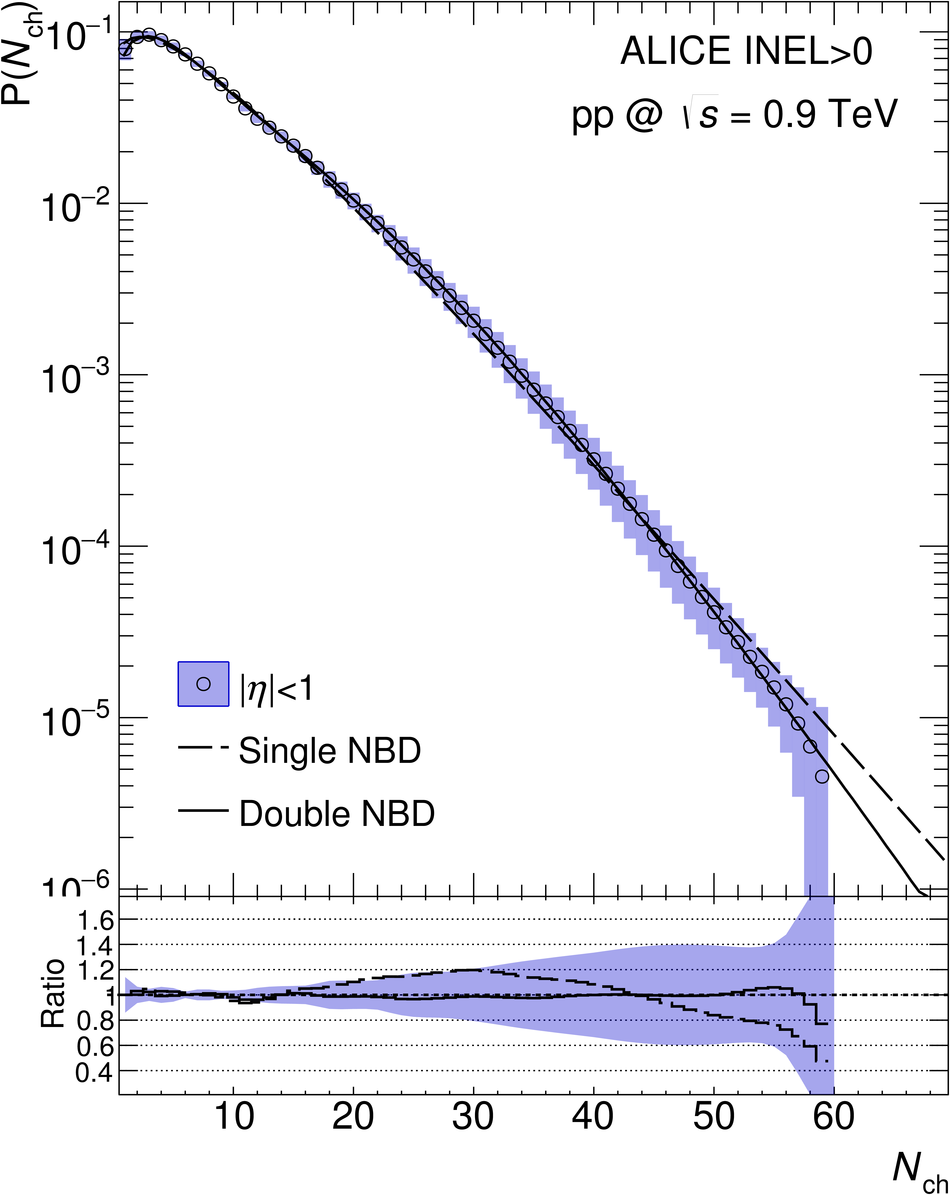
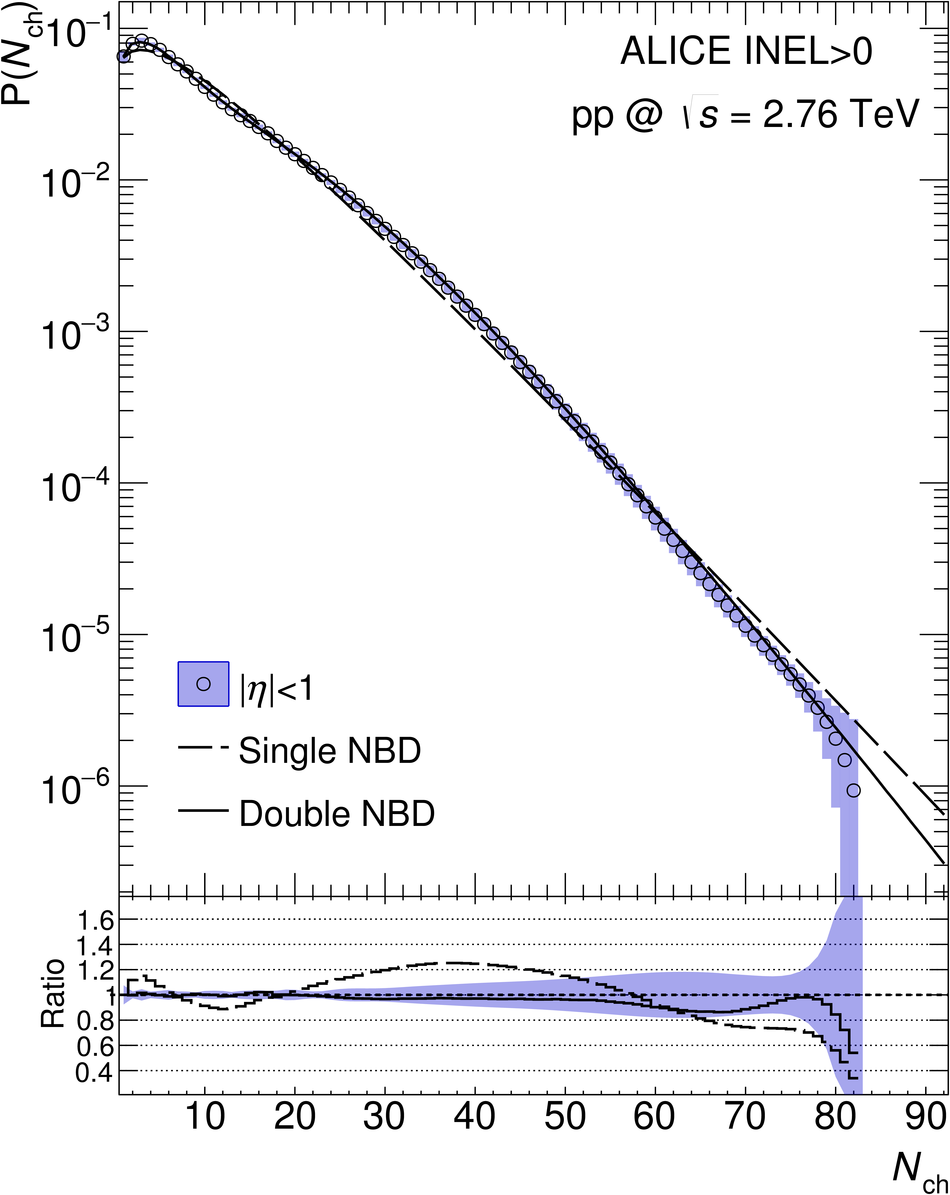
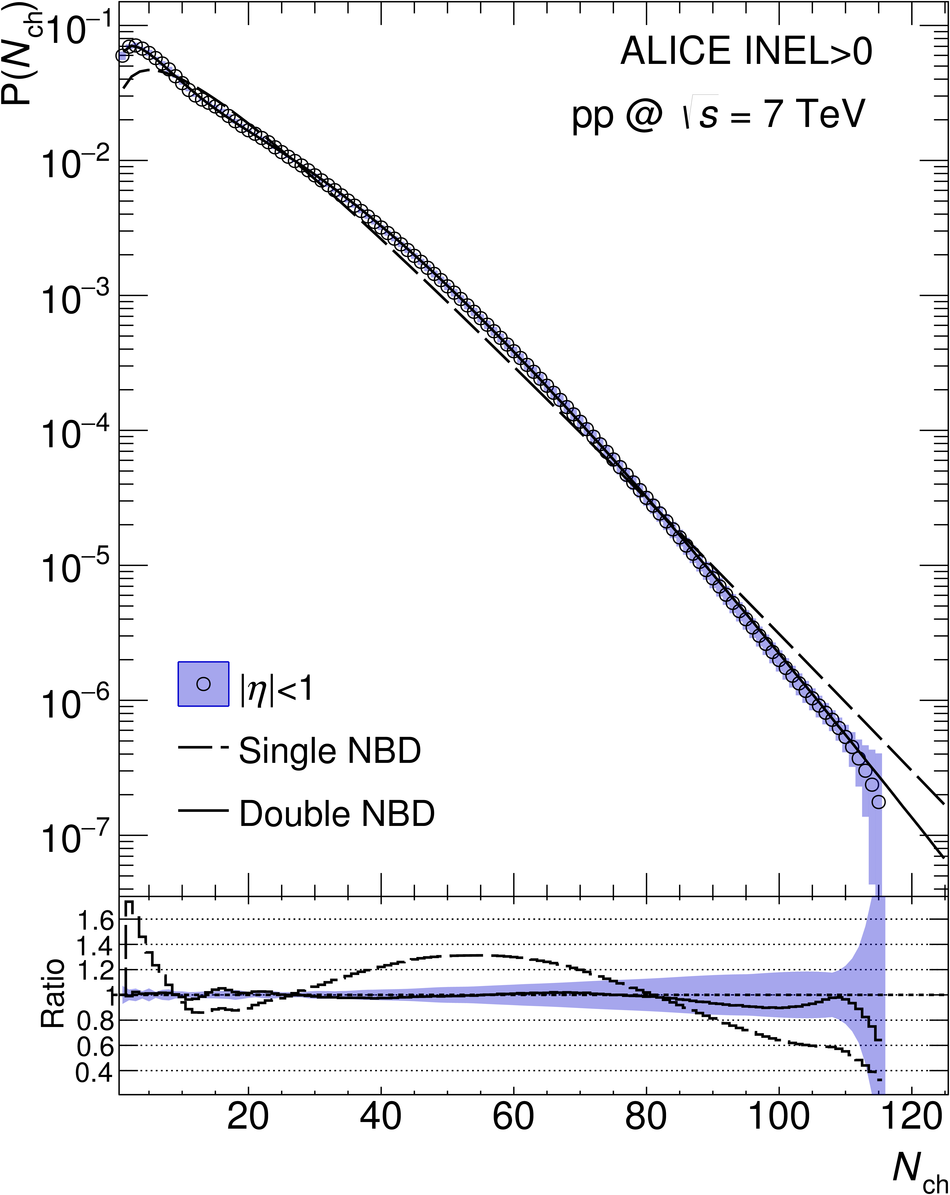
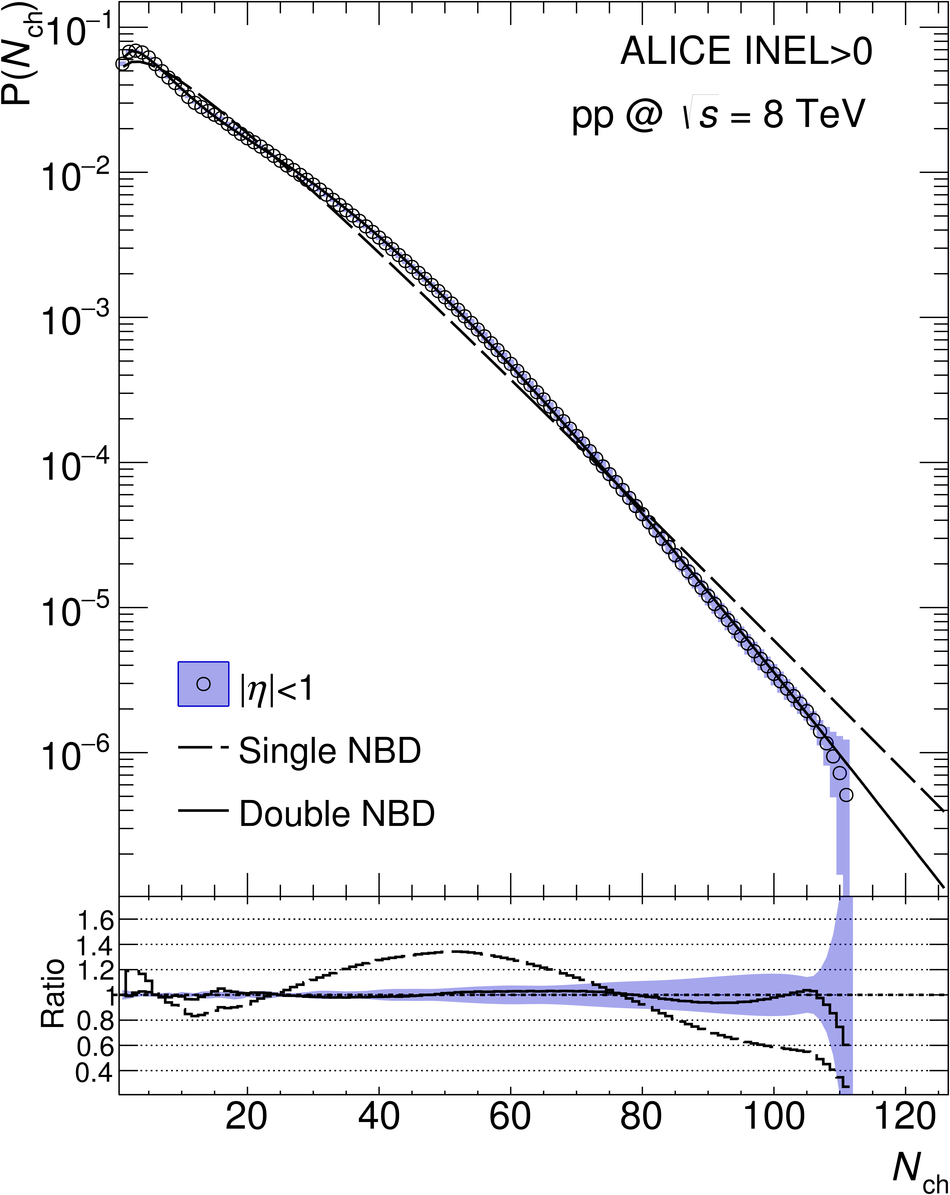
Measured multiplicity distributions in three pseudorapidity ranges for \inelgt events. The dashed and solid lines show the single and double NBD fits (see Section 9.5). Shaded areas represent statistical and systematic uncertainties combined: (a) data at $\sqrt{s} = 0.9$ TeV (top left); (b) data at $\sqrt{s} = 2.76$ TeV (top right); (c) data at $\sqrt{s} = 7$ TeV (bottom left); (d) data at $\sqrt{s} = 8$ TeV (bottom right). Ratios of data to the fits are also shown, with shaded areas representing combined systematic and statistical uncertainties.

Figure 16

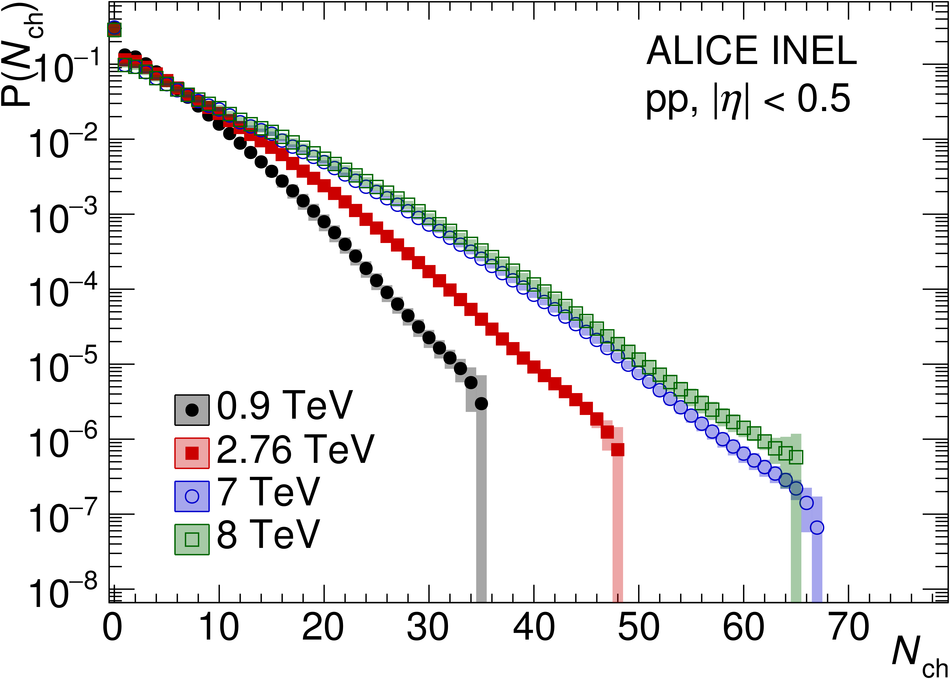
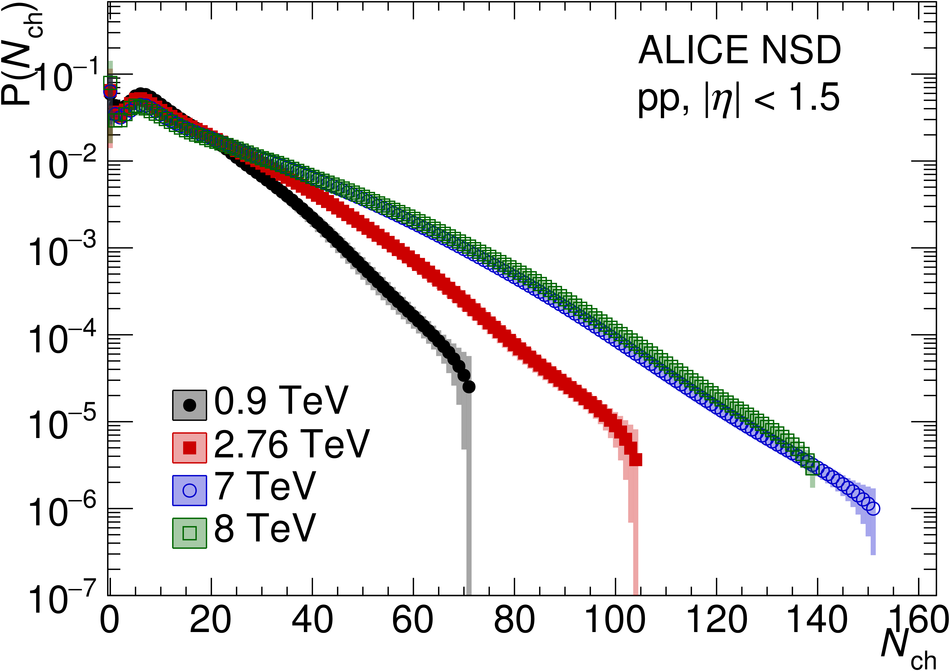
Evolution of measured multiplicity distributions as a function of centre-of-mass energy (from 0.9 to 8 TeV), for INEL and NSD event classes and for $|\eta| < 0.5$ (top row) and $|\eta| < 1.5$ (bottom row).

Figure 17

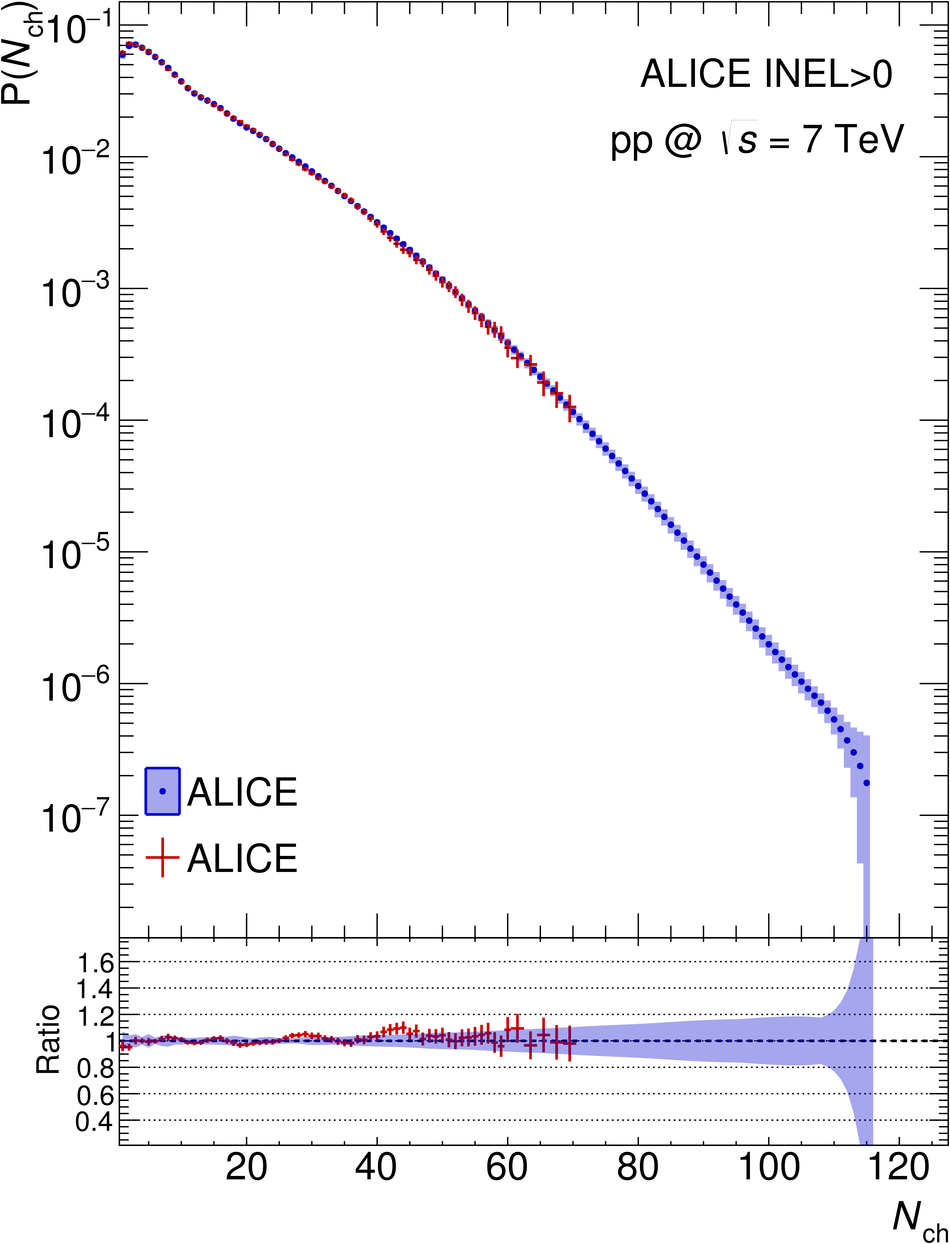
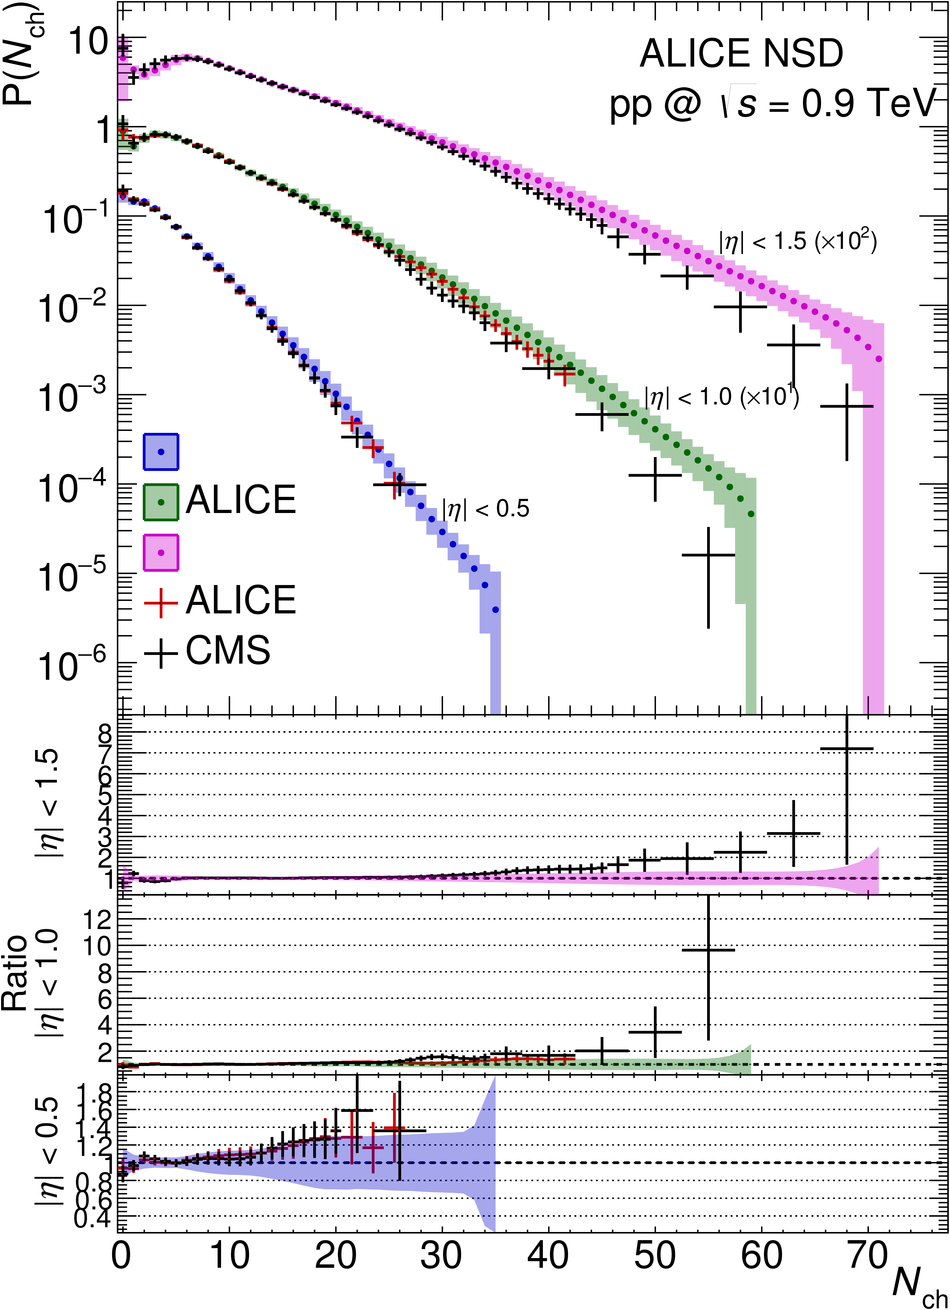
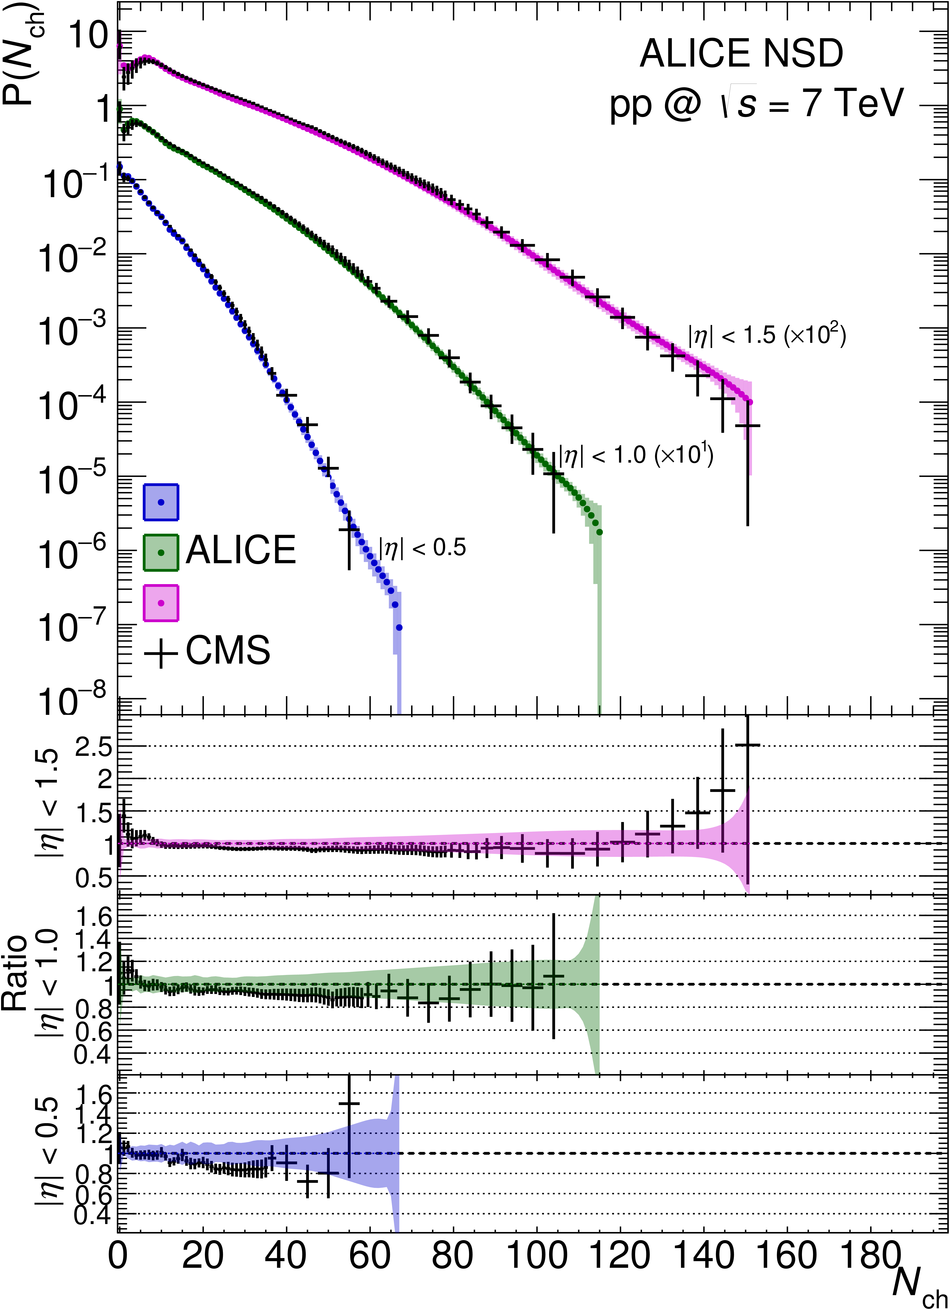
Comparison with ALICE previous publications, for the INEL event class, at $\sqrt{s} = 0.9$ TeV (top left) and the INEL$>$0 event class at $\sqrt{s} = 7$ TeV (top right); in both cases, ratios between ALICE new data and ALICE previous data are also shown. The total uncertainties are shown as error bars for the previous data and as a band for the present measurement. For the NSD event class, comparison with ALICE previous publication and with CMS data at $\sqrt{s} = 0.9$ TeV (bottom left), and comparison with CMS data at $\sqrt{s} = 7$ TeV (bottom right); ratios of the NBD fits of ALICE data taken without errors to CMS data, for the various $\eta$ intervals (indicated on the figure), are also shown. Error bars represent the contributions of the CMS errors to the ratios, the bands represent the ALICE total uncertainty assigned to the ratio of 1.

Figure 18

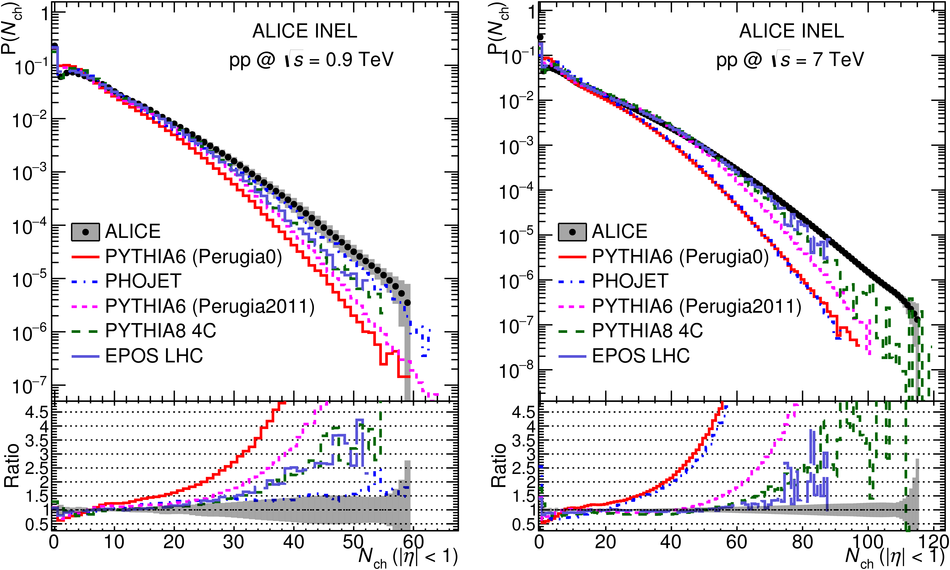
Comparison with models of measured multiplicity distributions for the \inel event class in the pseudorapidity range $|\eta| < 1.0$: ALICE data (black circles with grey bands), PYTHIA6 tune Perugia0 (red continuous line), PHOJET (blue dot-dashed line), PYTHIA6 Perugia 2011 (pink dashed line), PYTHIA8 4C (green dashed line), and EPOS LHC (long dashed light blue line). The shaded areas represent total uncertainties: comparison at 0.9 (left) and at 7 TeV (right). The ratios between measured values and model calculations are shown in the lower parts of the figures with the same convention.

Figure 19

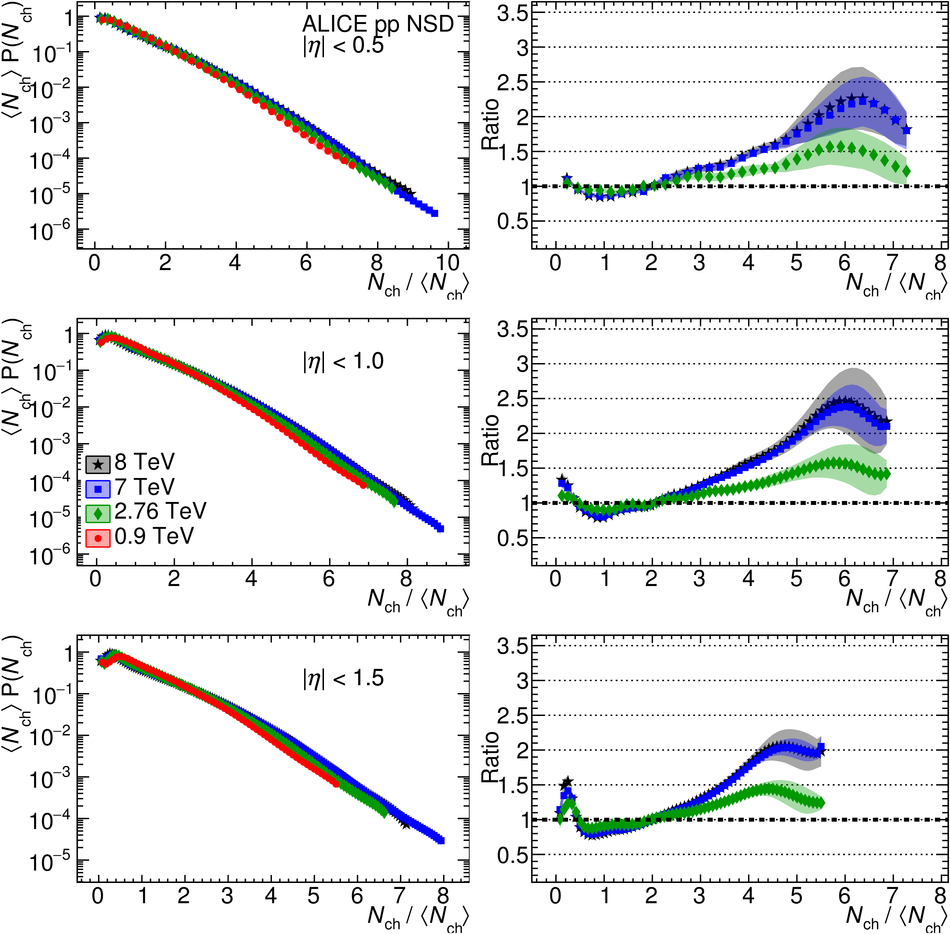
KNO-scaled distribution $\left< \nch\right>\mathrm{P}\left(\nch\right)$ versus the KNO variable ${\nch}/{\left< \nch\right>}$ at $\sqrt{s} =$ 0.9, 2.76, 7 and 8 TeV, for three pseudorapidity intervals: $|\eta| < $ 0.5 (top), 1.0 (middle) and 1.5 (bottom). In each case, ratios to the distribution at $\sqrt{s} = 0.9$ TeV are shown, on the right-hand side parts of the figures. As ${\nch}/{\left< \nch\right>}$ takes different values at different centre-of-mass energies, ratios were obtained by interpolating the KNO-scaled distributions, and uncertainties were taken from the nearest data point. Bands represent the total uncertainties.

Figure 20

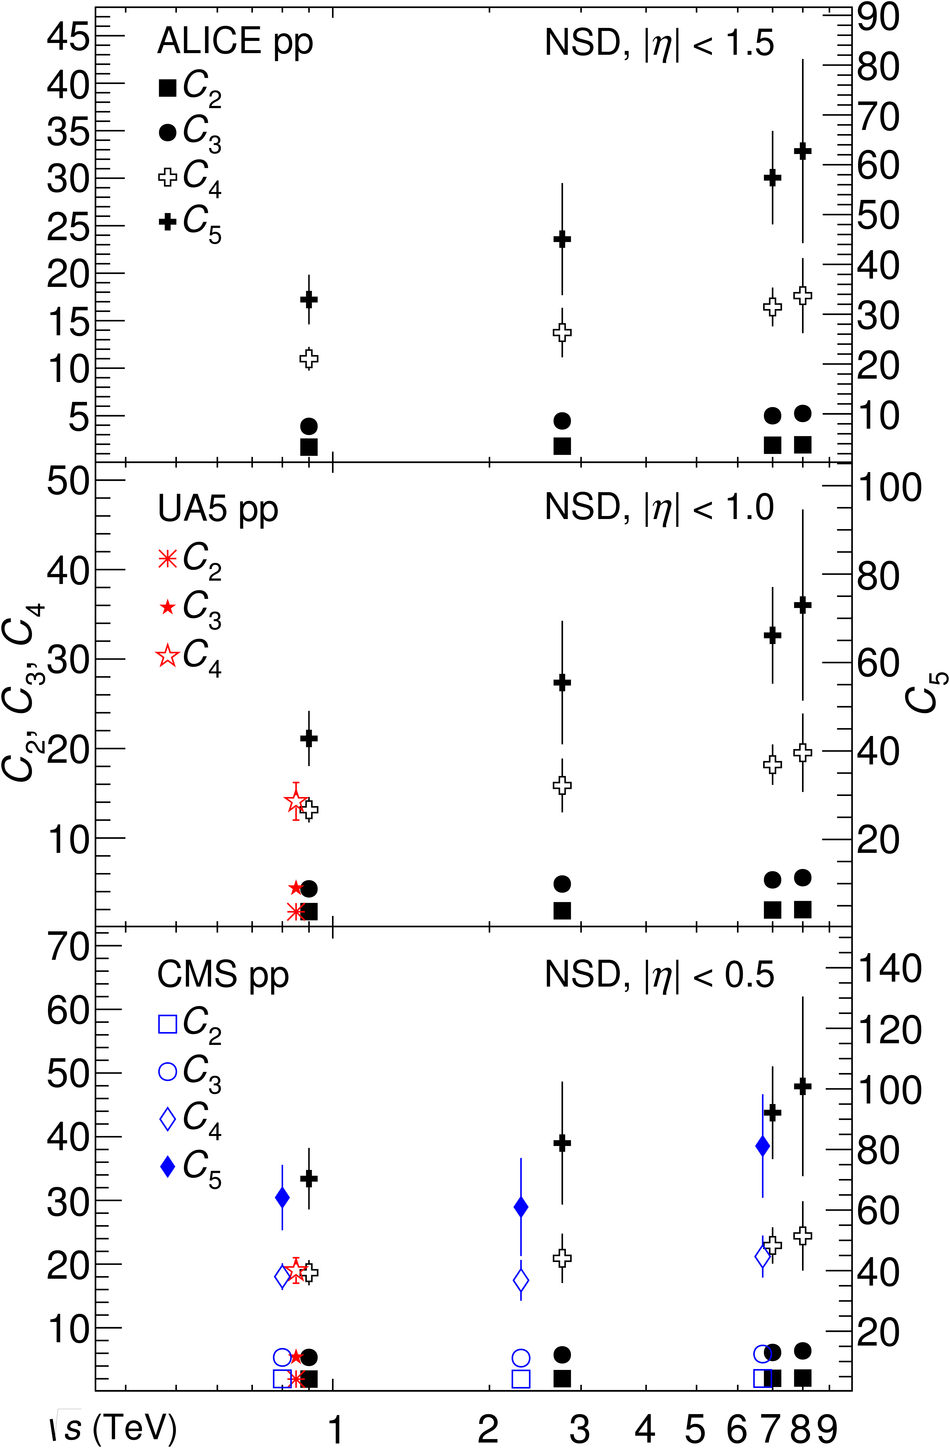
Centre-of-mass energy dependence of the $q$-moments ($q =$ 2 to 4, left-hand scale, and $q = 5$, right-hand scale) of the multiplicity distributions for NSD events in three different pseudorapidity intervals ($|\eta| < 1.5$ top, $|\eta| < 1.0$ middle and $|\eta| < 0.5$ bottom). ALICE data (black) are compared to UA5 (red) for $|\eta| < 0.5$ and $|\eta| < 1$, at $\sqrt{s} = 0.9$ TeV, and with CMS (blue) at $\sqrt{s} =$ 0.9 and 7 TeV for $|\eta| < 0.5$. The error bars represent the combined statistical and systematic uncertainties. The data at 0.9 and 7 TeV are slightly displaced horizontally for visibility.