Measured $p_{\rm T}$ spectra (left) and $v_{\rm 2}$ (right) of $\pi^{\pm}$ in the centrality class 10-20% in Pb-Pb collisions at $\sqrt{s_{\rm NN}}$ = 2.76,TeV, together with the fit and extrapolation used in the cocktail method. The ratios of data over the fit are shown on the bottom panels. The $\pi^{0}$ $p_{\rm T}$ spectrum is also shown. The vertical error bars and open boxes represent the statistical and systematic uncertainties, respectively. | 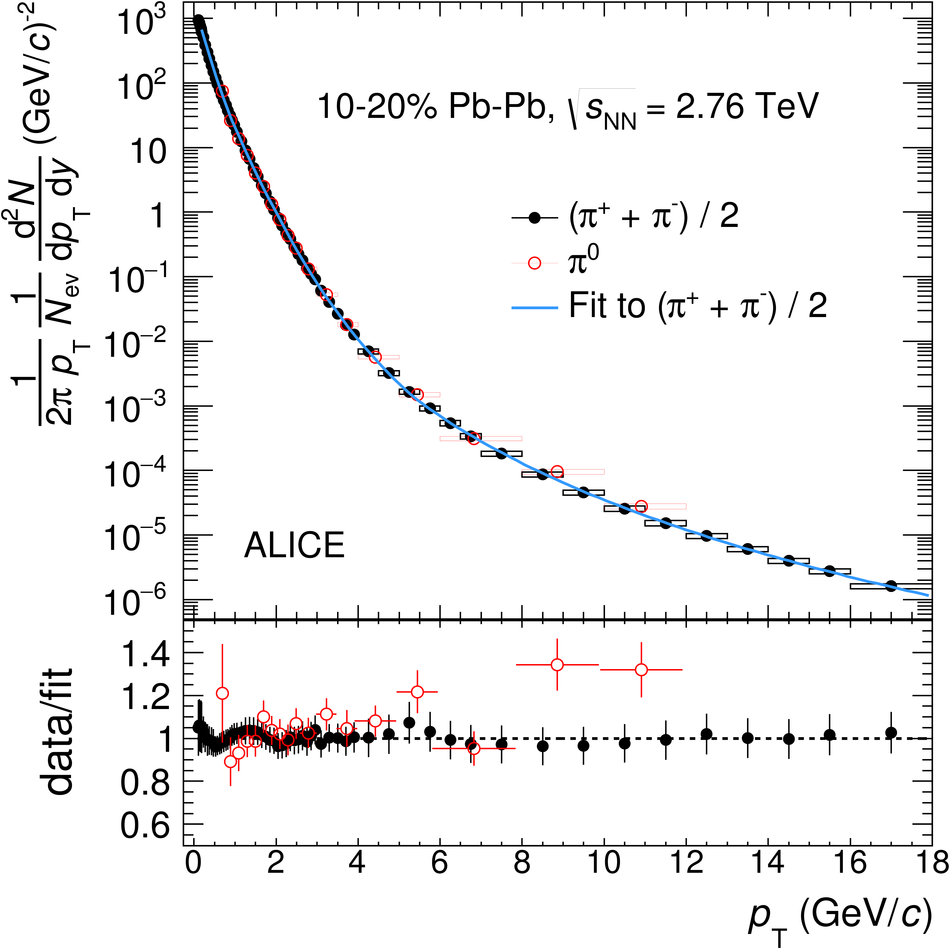 |
