Elliptic flow of electrons from heavy-flavour hadron decays at mid-rapidity in Pb-Pb collisions at $\mathbf{\sqrt{s_\mathrm{NN}}}$ = 2.76 TeV

The elliptic flow of electrons from heavy-flavour hadron decays at mid-rapidity ($|y|$ $<~$ 0.7) is measured in Pb-Pb collisions at $\sqrt{s_{\rm NN}} = 2.76$ TeV with ALICE at the LHC. The particle azimuthal distribution with respect to the reaction plane can be parametrized with a Fourier expansion, where the second coefficient ($v_{\rm 2}$) represents the elliptic flow. The $v_{\rm 2}$ coefficient of inclusive electrons is measured in three centrality classes (0-10%, 10-20% and 20-40%) with the event plane and the scalar product methods in the transverse momentum ($p_{\rm T}$) intervals 0.5-13 GeV/$c$ and 0.5-8 GeV/$c$, respectively. After subtracting the background, mainly from photon conversions and Dalitz decays of neutral mesons, a positive $v_{\rm 2}$ of electrons from heavy-flavour hadron decays is observed in all centrality classes, with a maximum significance of $5.9\sigma$ in the interval $2 <~$ $p_{\rm T}$ $<~$ 2.5 GeV/$c$ in semi-central collisions (20-40%). The value of $v_{\rm 2}$ decreases towards more central collisions at low and intermediate $p_{\rm T}$ (0.5 $<~$ $p_{\rm T}$ $<~$ 3 GeV/$c$). The $v_{\rm 2}$ of electrons from heavy-flavour hadron decays at mid-rapidity is found to be similar to the one of muons from heavy-flavour hadron decays at forward rapidity (2.5 $<~$ $y$ $<~$ 4). The results are described within uncertainties by model calculations including substantial elastic interactions of heavy quarks with an expanding strongly-interacting medium.


JHEP 09 (2016) 028
HEP Data
e-Print: arXiv:1606.00321 | PDF | inSPIRE
CERN-EP-2016-136

Figure 1

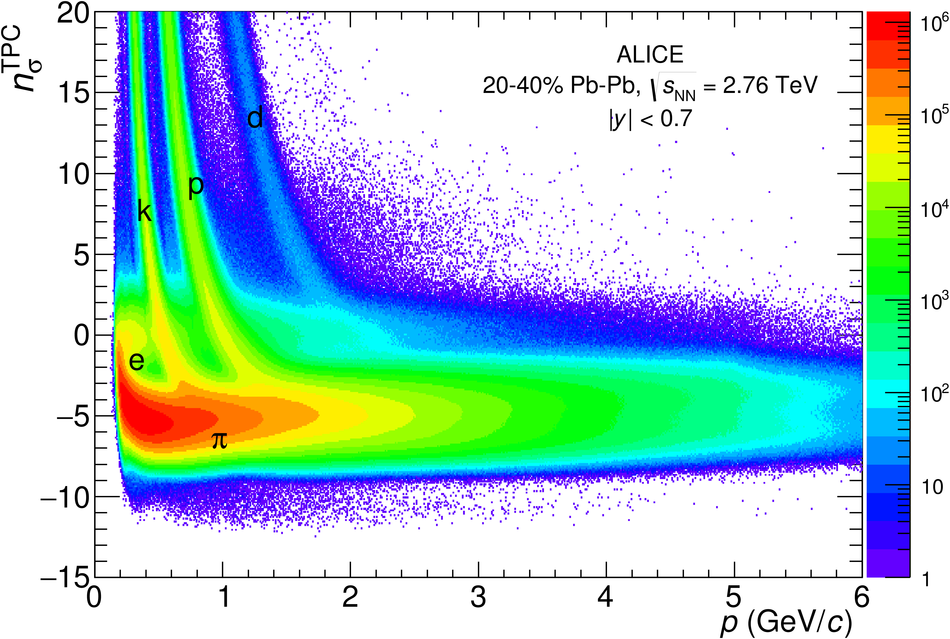
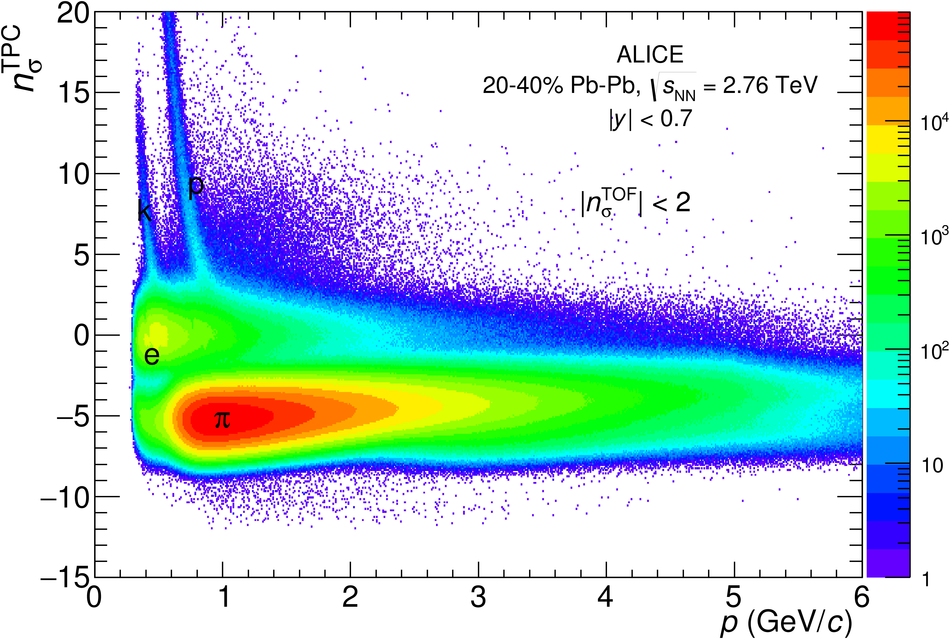
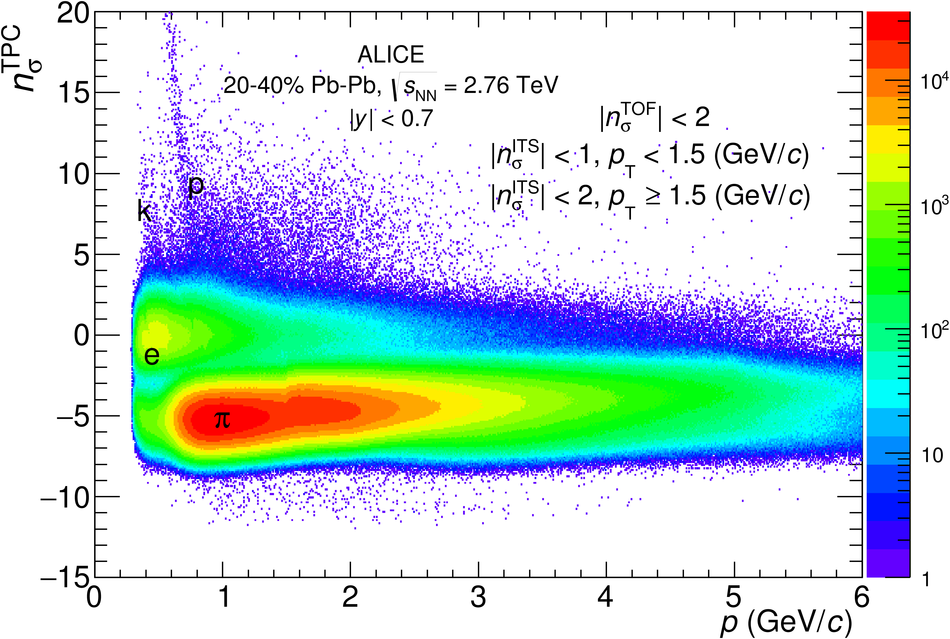
$n_{\sigma}^{\rm{TPC}}$ distributions as a function of momentum in semi-central (20-40%) Pb-Pb collisions at $\sqrt{s_{\rm NN}}$ = 2.76 TeV. Upper left panel: no ITS or TOF electron identification is applied. Upper right panel: the TOF-PID (see text) is applied. Lower panel: the TOF and ITS-PID (see text) are both applied.

Figure 2

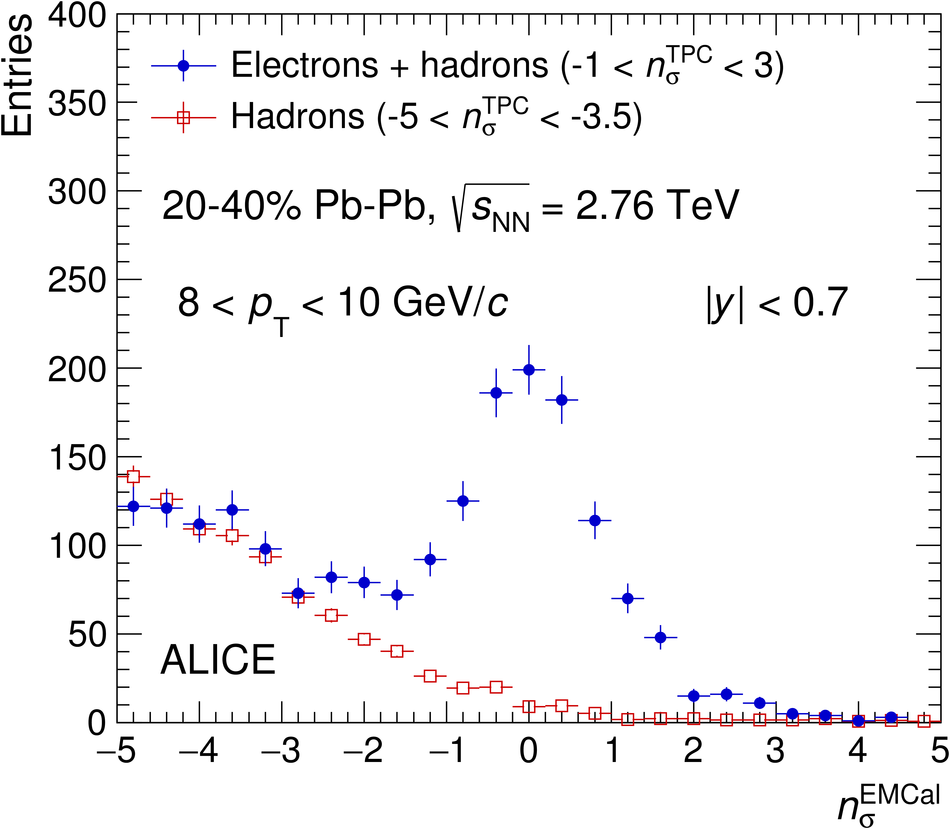
Deviation of the measured $E$/$p$ from the expected $\langle$$E$/$p$$\rangle$ of electrons divided by the $E$/$p$ resolution ($n_{\sigma}^{\rm{EMCal}}$) for tracks in the $p_{\rm T}$ interval 8-10 GeV/$c$ in semi-central (20-40% centrality class) Pb-Pb collisions at $\sqrt{s_{\rm NN}}$ = 2.76 TeV. Electron and hadron candidates are selected with the TPC d$E$/d$x$ by requiring $-$1 $< $ $n_{\sigma}^{\rm{TPC}}$ $< $ 3 and $-$5 $< $ $n_{\sigma}^{\rm{TPC}}$ $< $ $-$3.5, respectively.

Figure 3

$p_{\rm T}$-differential inclusive electron $v_{\rm 2}$ at mid-rapidity in Pb-Pb collisions at $\sqrt{s_{\rm NN}}$ = 2.76 TeV measured in the centrality classes: 0-10% (left), 10-20% (middle) and 20-40% (right). The symbols are placed at the centre of the $p_{\rm T}$ interval whose width is shown by the horizontal error bars. The vertical error bars and open boxes represent the statistical and systematic uncertainties, respectively. Results with the event plane and scalar product method are reported with black and red markers, respectively. In the 10-20% and 20-40% centrality classes the results obtained with the EMCal trigger are reported with open black markers.

Figure 4

Ratio of the inclusive electron yield to the one of background electrons obtained with the invariant mass method in Pb-Pb collisions at $\sqrt{s_{\rm NN}}$ = 2.76 TeV in 0-10% (left), 10-20% (middle) and 20-40% (right) centrality classes. The vertical error bars and open boxes represent the statistical and systematic uncertainties, respectively.

Figure 5

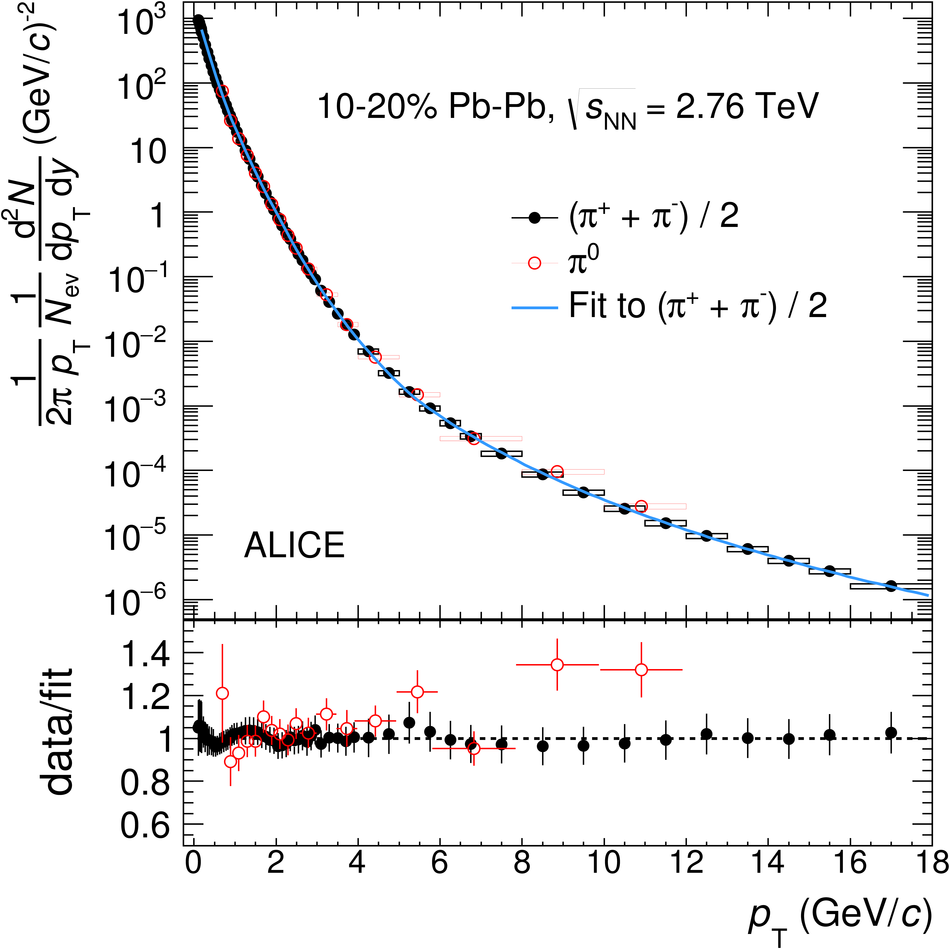
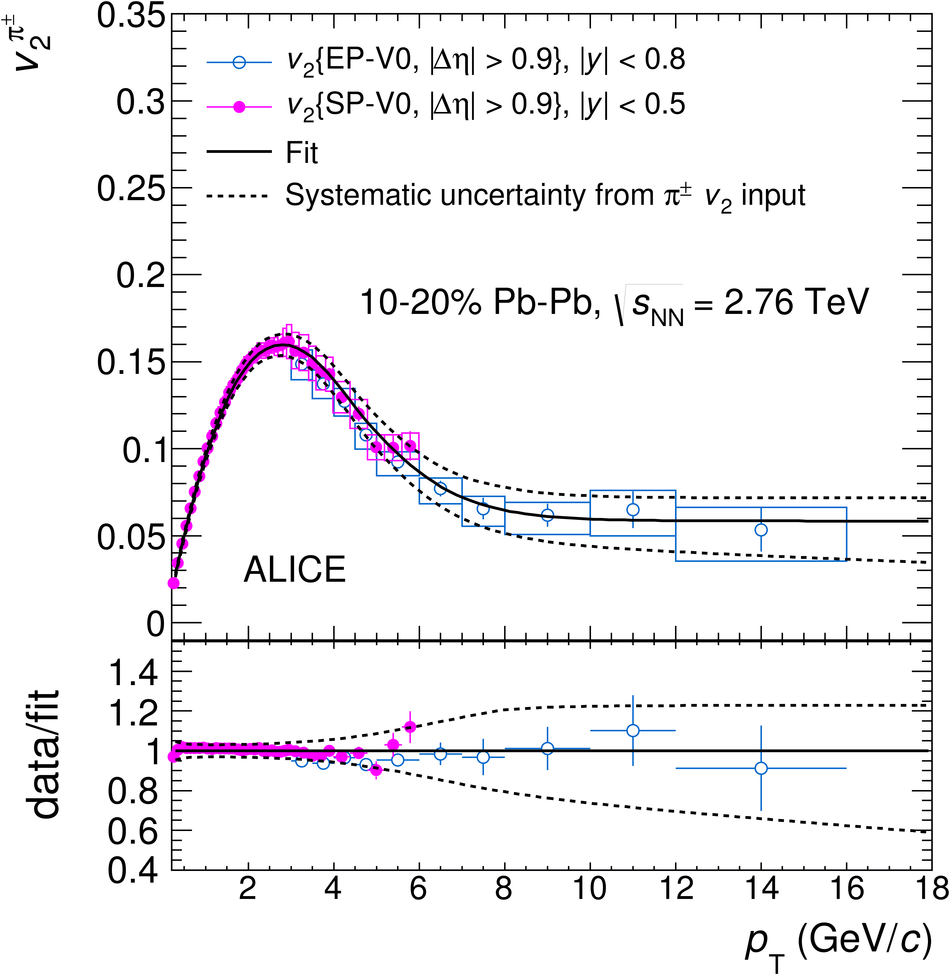
Measured $p_{\rm T}$ spectra (left) and $v_{\rm 2}$ (right) of $\pi^{\pm}$ in the centrality class 10-20% in Pb-Pb collisions at $\sqrt{s_{\rm NN}}$ = 2.76,TeV, together with the fit and extrapolation used in the cocktail method. The ratios of data over the fit are shown on the bottom panels. The $\pi^{0}$ $p_{\rm T}$ spectrum is also shown. The vertical error bars and open boxes represent the statistical and systematic uncertainties, respectively.

Figure 6

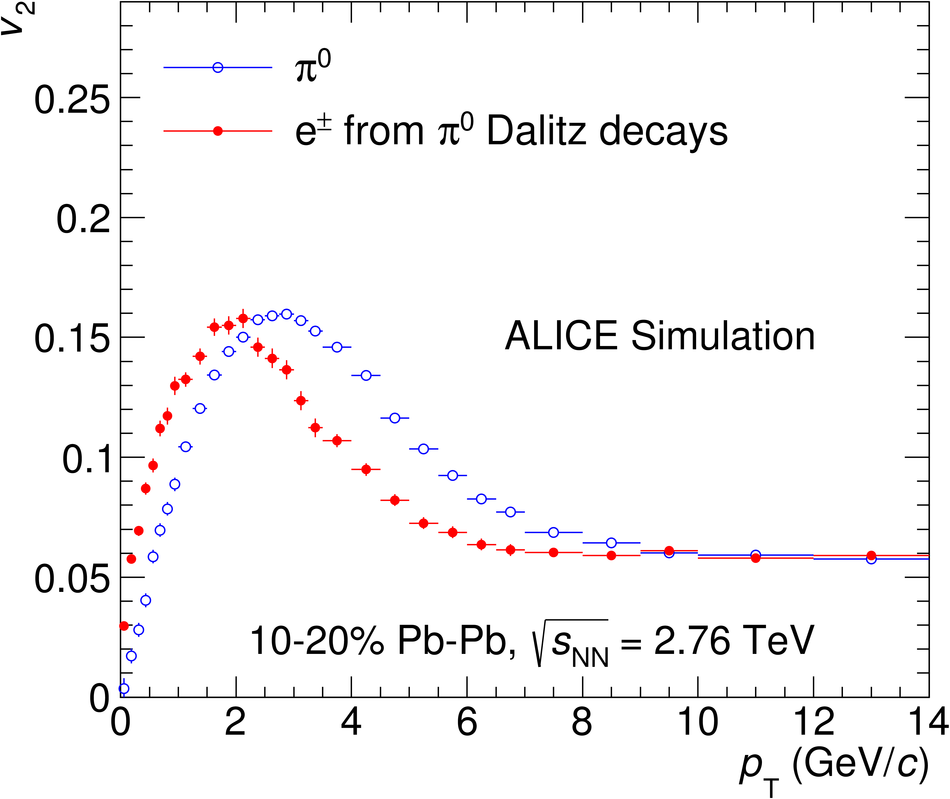
$v_{\rm 2}$ of electrons from $\pi^{0}$ Dalitz decays (red markers) and $v_{\rm 2}$ of $\pi^{0}$ (blue markers) as a function of $p_{\rm T}$ in the centrality class 10-20% in Pb-Pb collisions at $\sqrt{s_{\rm NN}}$ = 2.76 TeV as obtained from the simulation used in the cocktail method. Only statistical errors are shown.

Figure 7

Background electron $v_{\rm 2}$ as a function of $p_{\rm T}$ measured with the invariant mass method (full markers) and with the cocktail simulation (empty markers) in the 0-10% (left panel), 10-20% (middle panel) and 20-40% (right panel) centrality classes in Pb-Pb collisions at $\sqrt{s_{\rm NN}}$ = 2.76 TeV.

Figure 8

Elliptic flow of electrons from heavy-flavour hadron decays in the 0-10% (left panel), 10-20% (middle panel) and 20-40% (right panel) centrality classes in Pb-Pb collisions at $\sqrt{s_{\rm NN}}$ = 2.76 TeV at mid-rapidity as function of $p_{\rm T}$. The symbols are placed at the centre of the $p_{\rm T}$ interval whose width is shown by the horizontal error bar. The vertical error bars and open boxes represent the statistical and systematic uncertainties, respectively. The results are obtained with the event plane method and an eta gap $|\Delta \eta|$ $>$ 0.9.

Figure 9

Elliptic flow of electrons from heavy-flavour hadron decays at mid-rapidity as a function of the centrality class in Pb-Pb collisions at $\sqrt{s_{\rm NN}}$ = 2.76 TeV. The symbols are placed at the centre of the centrality interval whose width is shown by the horizontal error bar. The vertical error bars and open boxes represent the statistical and systematic uncertainties, respectively.

Figure 10

Elliptic flow of heavy-flavour decay electrons at mid-rapidity ($|y|$ $< $ 0.7) (closed symbols) as a function of $p_{\rm T}$ compared to the elliptic flow of heavy-flavour decay muons at forward rapidity (2.5 $< $ $y$ $< $ 4) (open symbols) in the 0-10% (left panel), 10-20% (middle panel) and 20-40% (right panel) centrality classes in Pb-Pb collisions at $\sqrt{s_{\rm NN}}$ = 2.76 TeV. The symbols are placed at the centre of the $p_{\rm T}$ interval whose width is shown by the horizontal error bar. The vertical error bars and open boxes represent the statistical and systematic uncertainties, respectively.

Figure 11

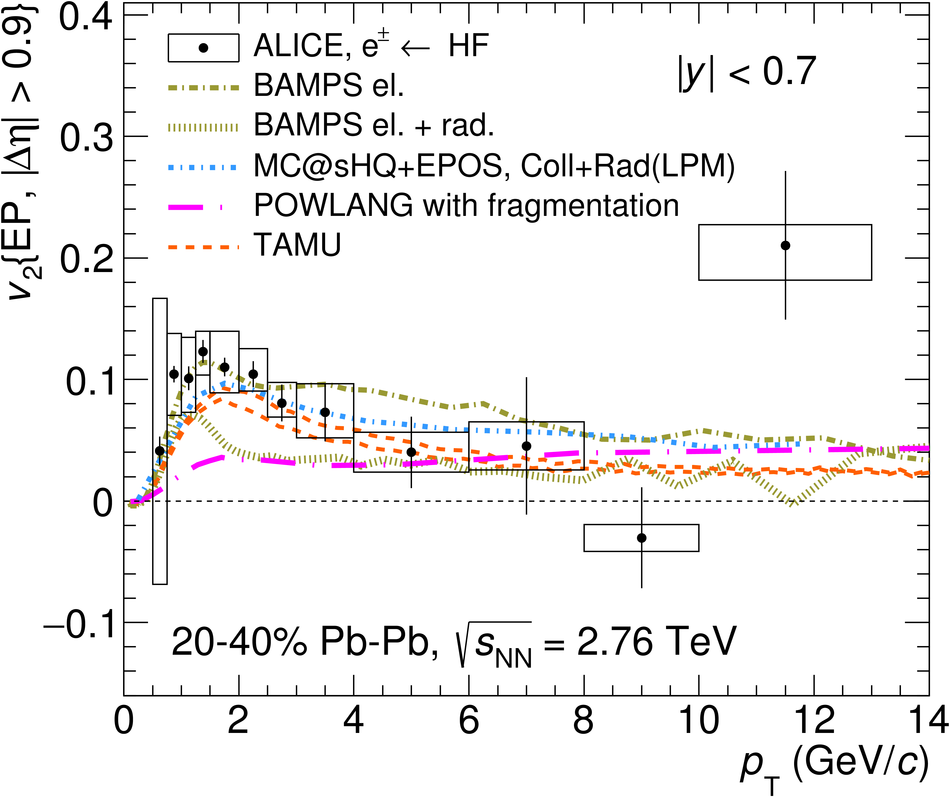
Heavy-flavour decay electron $v_2$ at mid-rapidity as a function of $p_{\rm T}$ in semi-central Pb-Pb collisions at $\sqrt{s_{\rm NN}}$ = 2.76,TeV compared to model calculations.