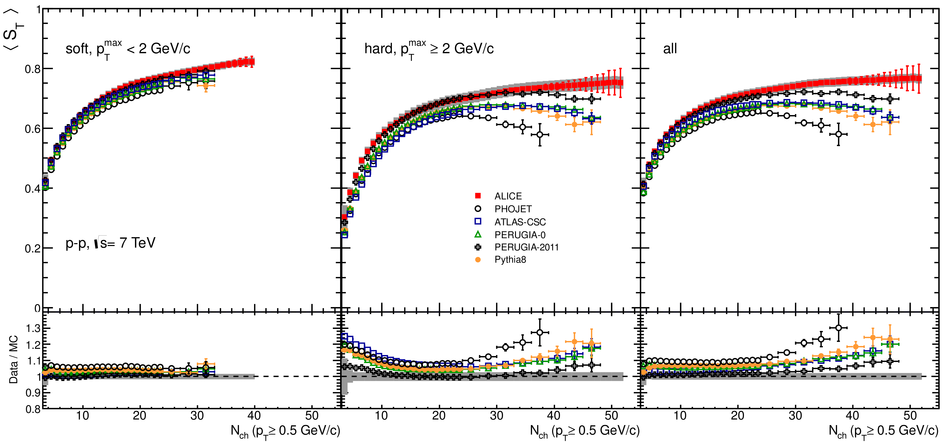
Mean transverse sphericity as a function of charged particle multiplicity. The ALICE data are compared with five models: PHOJET, PYTHIA6 (tunes: ATLAS-CSC, PERUGIA-0 and PERUGIA-2011) and PYTHIA8. Results at $\sqrt{s}=0.9$ and 7 TeV are shown in the top and bottom rows, respectively. Different event classes are presented: (left) "soft", (middle) "hard" and (right) "all" (see text for definitions). The statistical errors are displayed as error bars and the systematic uncertaintiesas the shaded area. The horizontal error bars indicate the bin widths. Symbols for data points and model predictions are presented in the legend. | 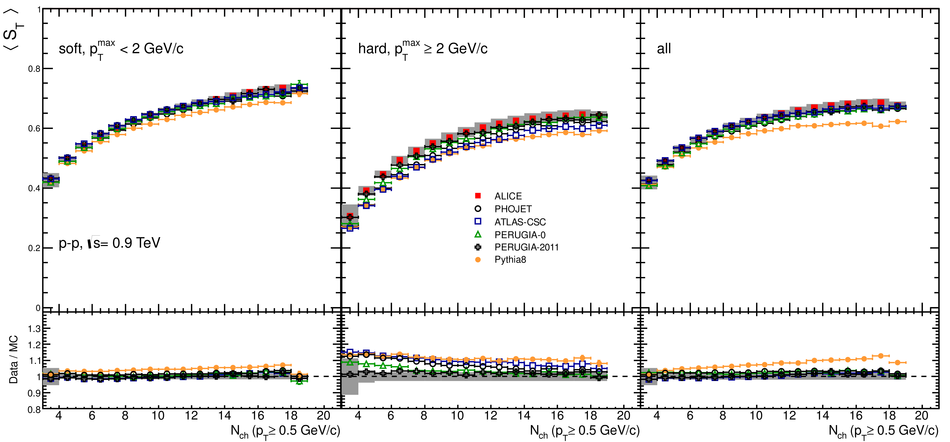 |