Measurements of the sphericity of primary charged particles in minimum bias proton--proton collisions at sqrt(s)=0.9, 2.76 and 7 TeV with the ALICE detector at the LHC are presented. The observable is linearized to be collinear safe and is measured in the plane perpendicular to the beam direction using primary charged tracks with $p_{\rm T}\geq0.5$ GeV/c in $|\eta|\leq0.8$. The mean sphericity as a function of the charged particle multiplicity at mid-rapidity ($N_{\rm ch}$) is reported for events with different $p_{\rm T}$ scales ("soft" and "hard") defined by the transverse momentum of the leading particle. In addition, the mean charged particle transverse momentum versus multiplicity is presented for the different event classes, and the sphericity distributions in bins of multiplicity are presented. The data are compared with calculations of standard Monte Carlo event generators. The transverse sphericity is found to grow with multiplicity at all collision energies, with a steeper rise at low $N_{\rm ch}$, whereas the event generators show the opposite tendency. The combined study of the sphericity and the mean $p_{\rm T}$ with multiplicity indicates that most of the tested event generators produce events with higher multiplicity by generating more back-to-back jets resulting in decreased sphericity (and isotropy). The PYTHIA6 generator with tune PERUGIA-2011 exhibits a noticeable improvement in describing the data, compared to the other tested generators.
Eur. Phys. J. C 72 (2012) 2124
HEP Data
e-Print: arXiv:1205.3963 | PDF | inSPIRE
CERN-PH-EP-2012-136
Figure 1
Mean transverse sphericity versus $p_{\rm T}^{\rm max}$ for MC simulationsat $\sqrt{s}=7$ TeV. Results are shown for PHOJET and PYTHIA6 (tunes ATLAS-CSC, PERUGIA-0 and PERUGIA-2011) simulations. The events are required to have more than 2 primary charged particles in $|\eta|\leq0.8$ and transverse momentum above $0.5$ GeV/$c$. | 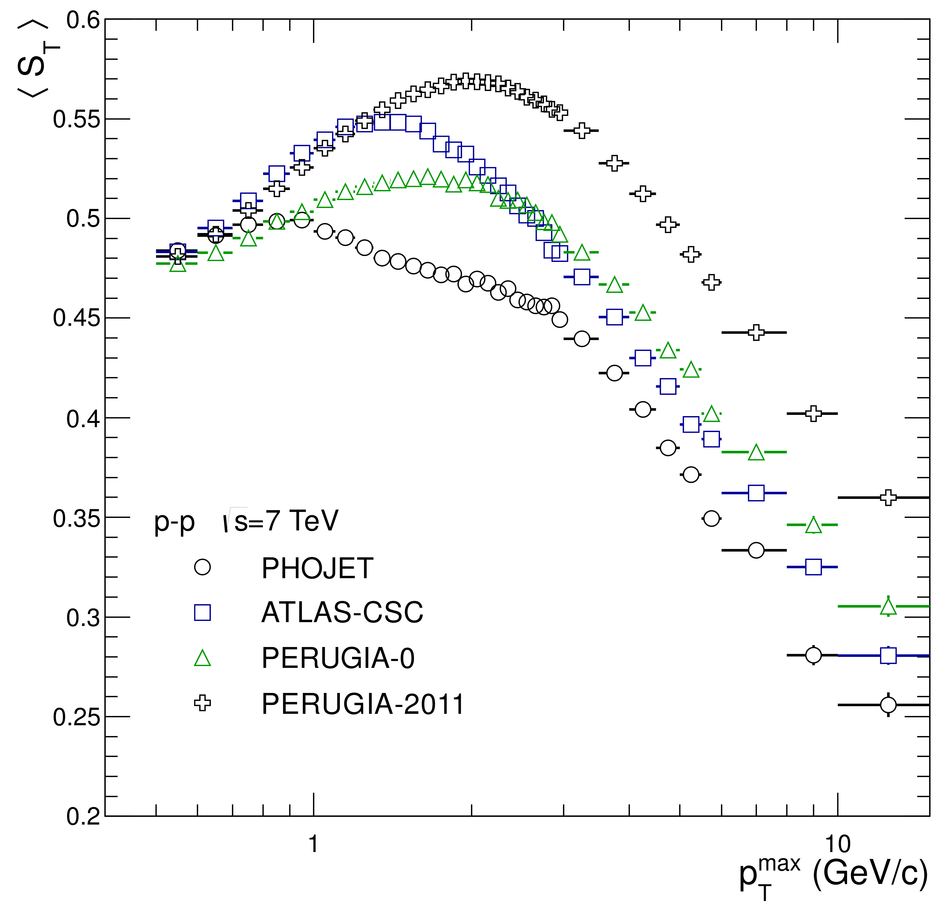 |
Figure 2
Example of the sphericity response matrix for a measured multiplicity of 25 charged particles at mid-rapidity. The events are generated using the PYTHIA6 tune ATLAS-CSC (pp collisions at$\sqrt{s}=7$ TeV) and then transported through the detector. Particles and tracks with $|\eta|\leq0.8$ and $p_{\rm T}\geq0.5$ GeV/$c$ are used. | 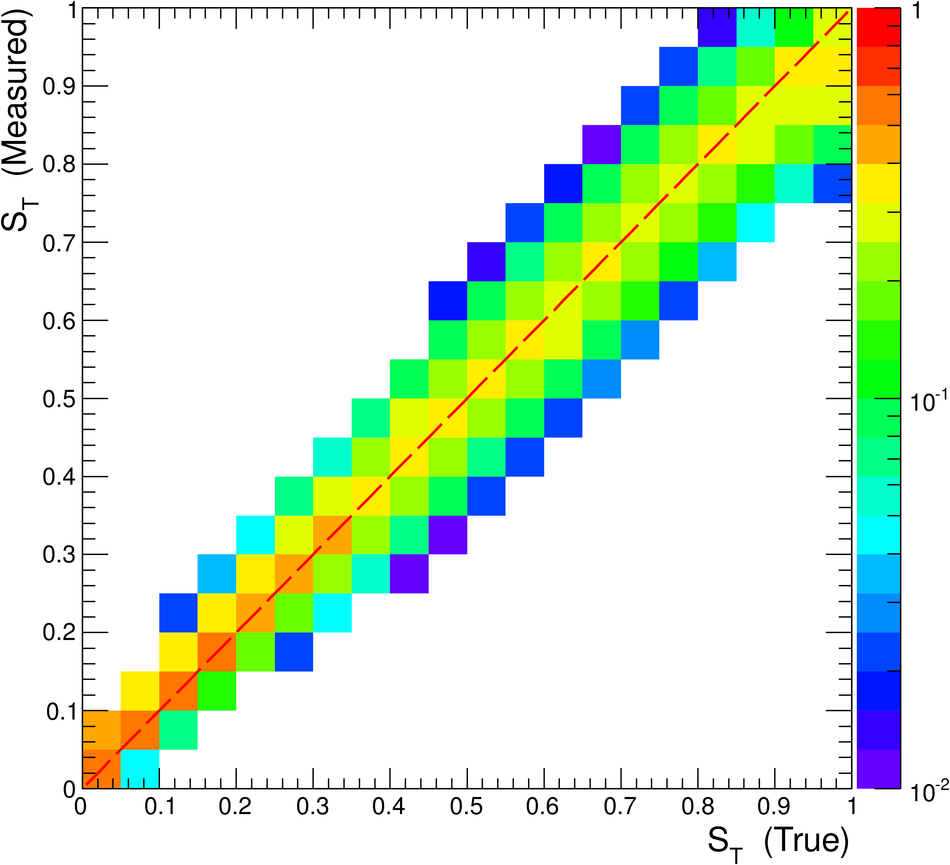 |
Figure 4
Performance of the procedure to correct the reconstructed mean $p_{\rm T}$ as a function of multiplicity for "all" events. The method is tested using PHOJET as input and applying corrections derived from PYTHIA The MC true (PHOJET result at generation level) is compared with the corrected result after simulation and reconstruction. |  |
Figure 5
Mean transverse sphericity as a function of charged particle multiplicity. The ALICE data are compared with five models: PHOJET, PYTHIA6 (tunes: ATLAS-CSC, PERUGIA-0 and PERUGIA-2011) and PYTHIA8. Results at $\sqrt{s}=0.9$ and 7 TeV are shown in the top and bottom rows, respectively. Different event classes are presented: (left) "soft", (middle) "hard" and (right) "all" (see text for definitions). The statistical errors are displayed as error bars and the systematic uncertaintiesas the shaded area. The horizontal error bars indicate the bin widths. Symbols for data points and model predictions are presented in the legend. | 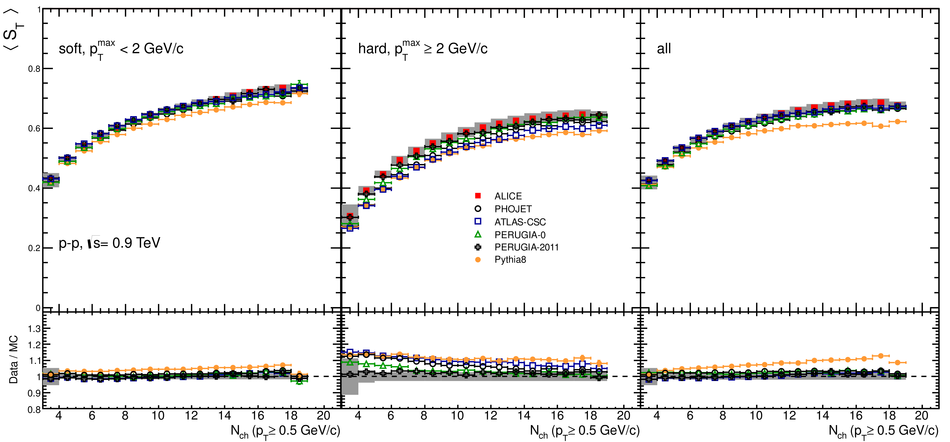 |
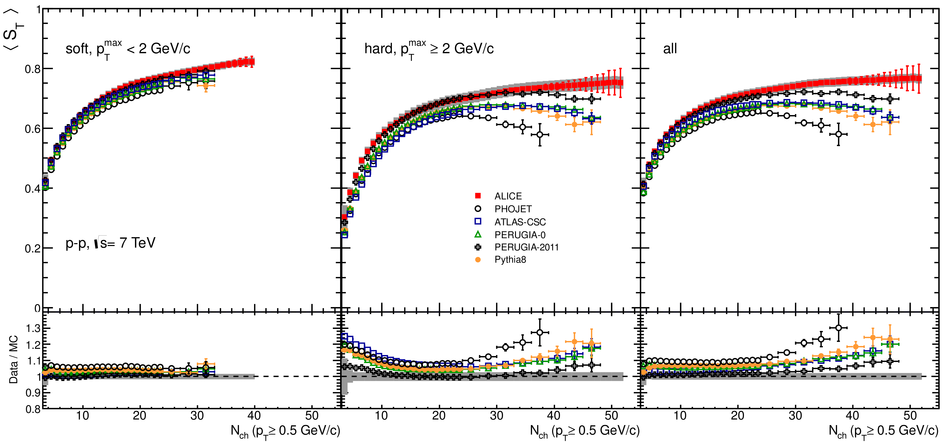
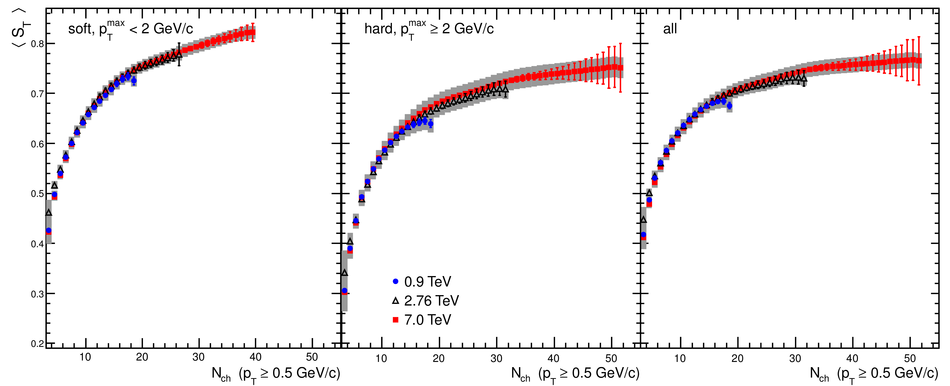
Figure 7
Mean transverse momentum versus multiplicity. The ALICE data are compared with five models: PHOJET, PYTHIA6 (tunes: ATLAS-CSC, PERUGIA-0 and PERUGIA-2011) andPYTHIA8. Results at $\sqrt{s}=0.9$ and 7 TeV are shown in the top and bottom rows, respectively. Different event classes are presented: (left) "soft'', (middle) "hard'' and (right) "all''. The gray lines indicate the systematic uncertainty on data and the horizontal error bars indicate the bin widths. | 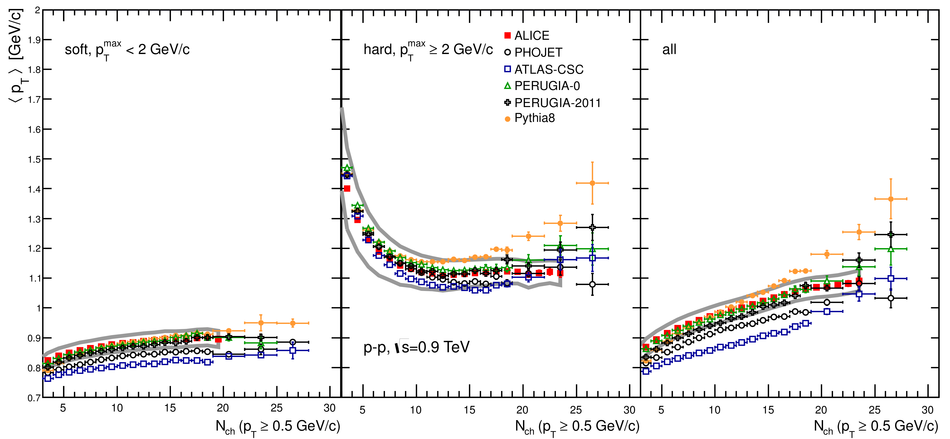 |
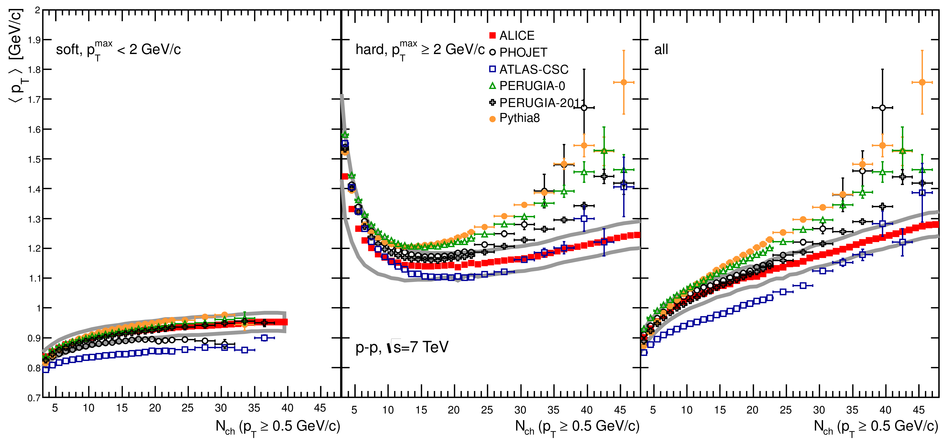
Figure 8
Sphericity distributions in four bins of multiplicity: (upper-left) $3 \leq N_{\rm ch} \leq 9$, (upper-right) $10 < N_{\rm ch} \leq 19$, (bottom-left) $20 < N_{\rm ch} \leq 29$ and (bottom-right) $N_{\rm ch} \geq 30$ at $\sqrt{s}=7$ TeV. The statistical errors are displayed as error bars and the systematic uncertainties as the shaded area. | 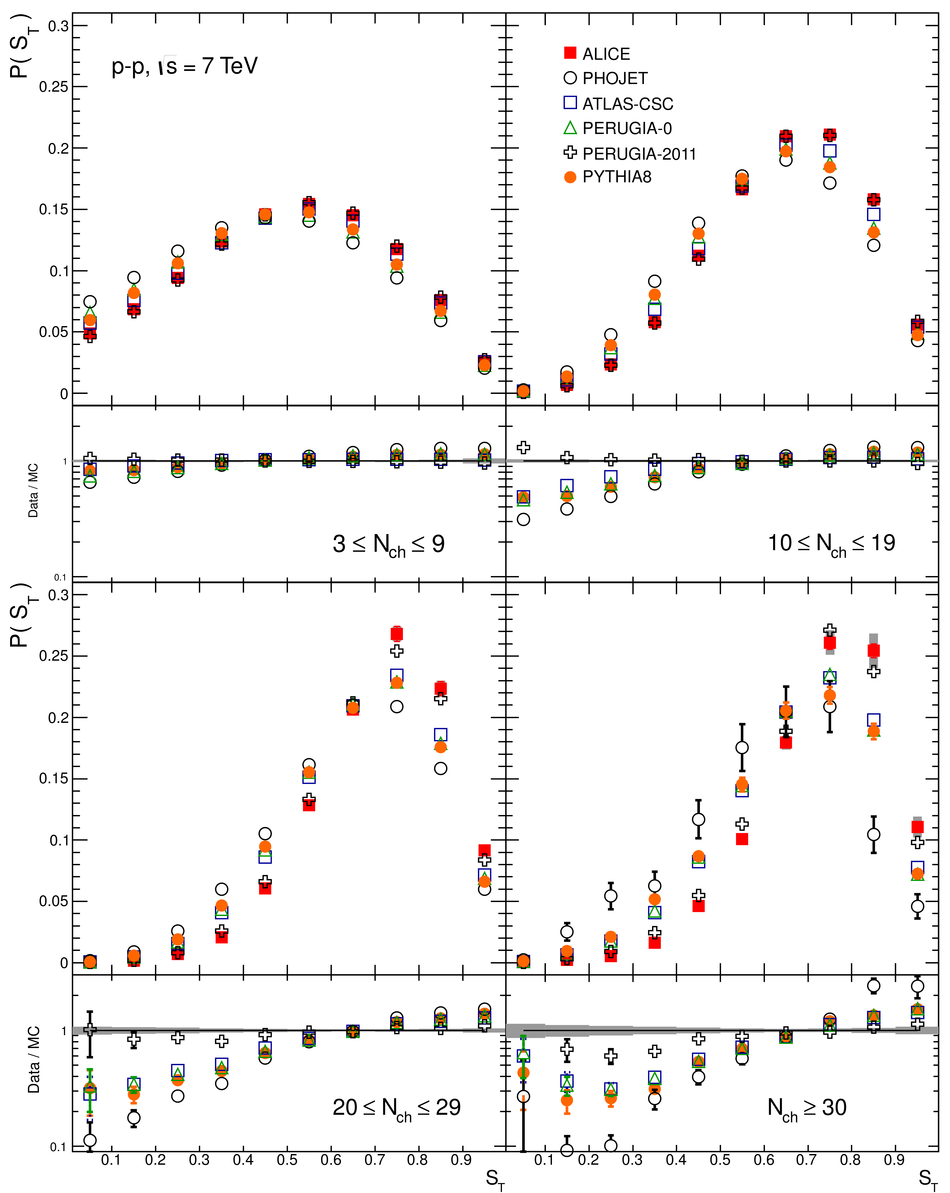 |
Figure 9
Mean $p_{\rm T}$ (top) as a function of sphericity for two multiplicity bins(left) $3 \leq N_{\rm ch} \leq 9$ and (right) $N_{\rm ch} \geq30$ for minimum bias pp collisions at $\sqrt{s}=7$ TeV simulated with four different MC generators: PHOJET, PYTHIA6 (tune ATLAS-CSC and PERUGIA-2011) and PYTHIA8. Also the contributions ofthe different event topologies to the averaged mean $p_{\rm T}$ are presented (bottom). | 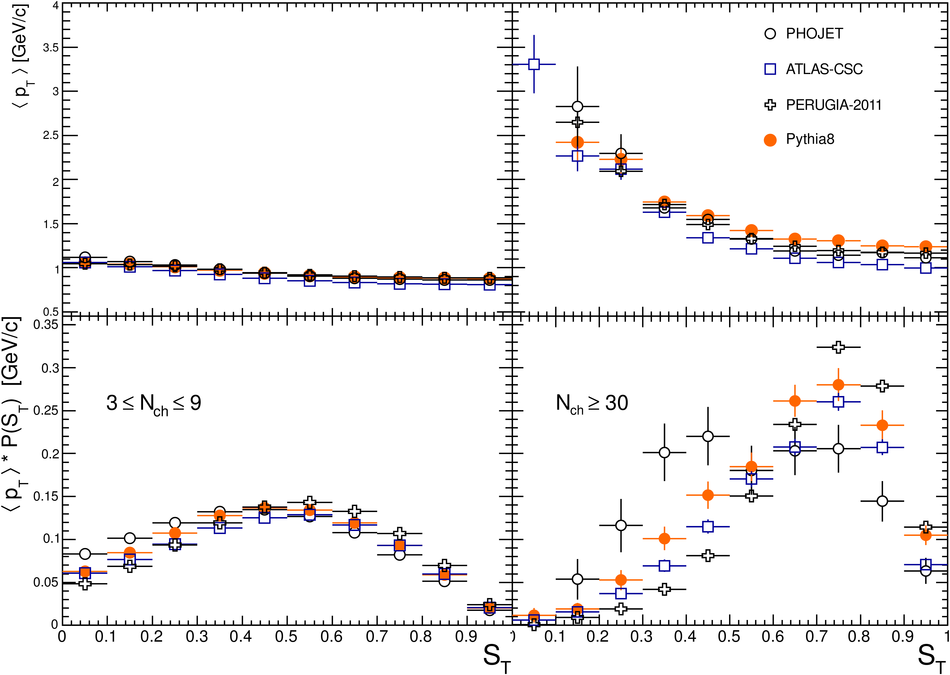 |