The inclusive J/$\psi$ production has been studied in Pn-Pb and pp collisions at the centre-of-mass energy per nucleon pair $\sqrt{s_{\rm NN}}=5.02$ TeV, using the ALICE detector at the CERN LHC. The J/$\psi$ meson is reconstructed, in the centre-of-mass rapidity interval $2.5<~y<~4$ and in the transverse-momentum range $p_{\rm T}<~12$ GeV/$c$, via its decay to a muon pair. In this Letter, we present results on the inclusive J/$\psi$ cross section in pp collisions at $\sqrt{s}=5.02$ TeV and on the nuclear modification factor $R_{\rm AA}$. The latter is presented as a function of the centrality of the collision and, for central collisions, as a function of the transverse momentum $p_{\rm T}$ of the J/$\psi$. The measured $R_{\rm AA}$ values indicate a suppression of the J/$\psi$ in nuclear collisions and are then compared to our previous results obtained in Pb-Pb collisions at $\sqrt{s_{\rm NN}}=2.76$ TeV. The ratio of the $R_{\rm AA}$ values at the two energies is also computed and compared to calculations of statistical and dynamical models. The numerical value of the ratio for central events (0-10\% centrality) is $1.17 \pm 0.04 {\rm{(stat)}}\pm 0.20 {\rm{(syst)}}$. In central events, as a function of $p_{\rm T}$, a slight increase of $R_{\rm AA}$ with collision energy is visible in the region $2<~p_{\rm T}<~6$ GeV/$c$. Theoretical calculations provide a good description of the measurements, within uncertainties.
Phys. Lett. B 766 (2017) 212-224
HEP Data
e-Print: arXiv:1606.08197 | PDF | inSPIRE
CERN-EP-2016-162
Figure 1
Invariant mass distributions of US dimuons with $2.5 < y < 4$ and $p_{\rm T}< 12$ GeV/$c$ The top (bottom) row shows the distribution before (after) background subtraction with the event-mixing technique. The left panels correspond to the most central events (0-10%) while the right panels to a peripheral (70-80%) centrality range. The fit curves shown in blue represent the sum of the signal and background shapes, while the red lines correspond to the J/$\psi$ signal and the grey ones to the background. | 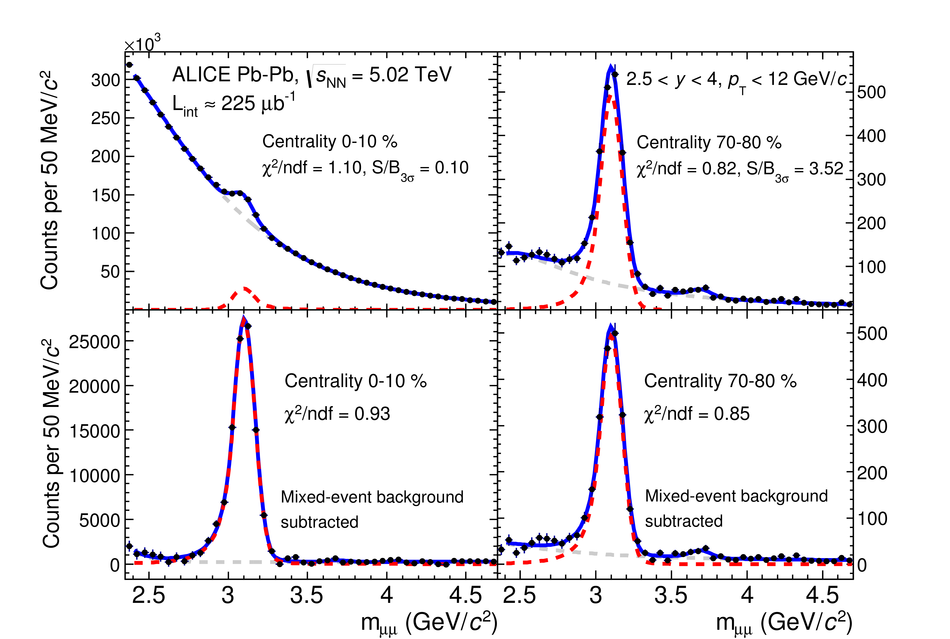 |
Figure 2
The differential cross section ${\rm d}^2\sigma^{\rm pp}_{{\rm J}/\psi}/{\rm d}y{\rm d}p_{\rm T}$ for inclusive J/$\psi$ production in pp collisions at $\sqrt{s}=5.02$ TeV. The error bars represent the statistical uncertainties, the boxes around the points the uncorrelated systematic uncertainties. The uncertainty on the luminosity measurement represents a correlated global uncertainty. | 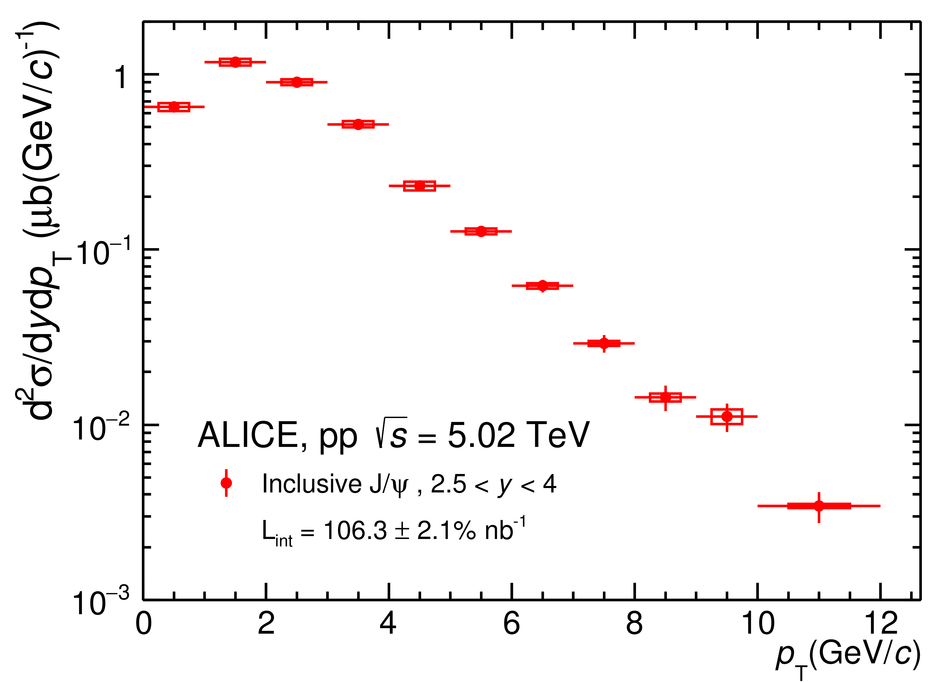 |
Figure 3
The nuclear modification factor for inclusive J/$\psi$ production, as a function of centrality, at $\sqrt{s_{\rm NN}}=5.02$ TeV, compared to published results at $\sqrt{s_{\rm NN}}=2.76$ TeV. The error bars represent statistical uncertainties, the boxes around the points uncorrelated systematic uncertainties, while the centrality-correlated global uncertainties are shown as a filled box around $R_{\rm AA}=1$. The widths of the centrality classes used in the J/$\psi$ analysis at $\sqrt{s_{\rm NN}}=5.02$ TeV are 2% from 0 to 12%, then 3% up to 30% and 5% for more peripheral collisions. | 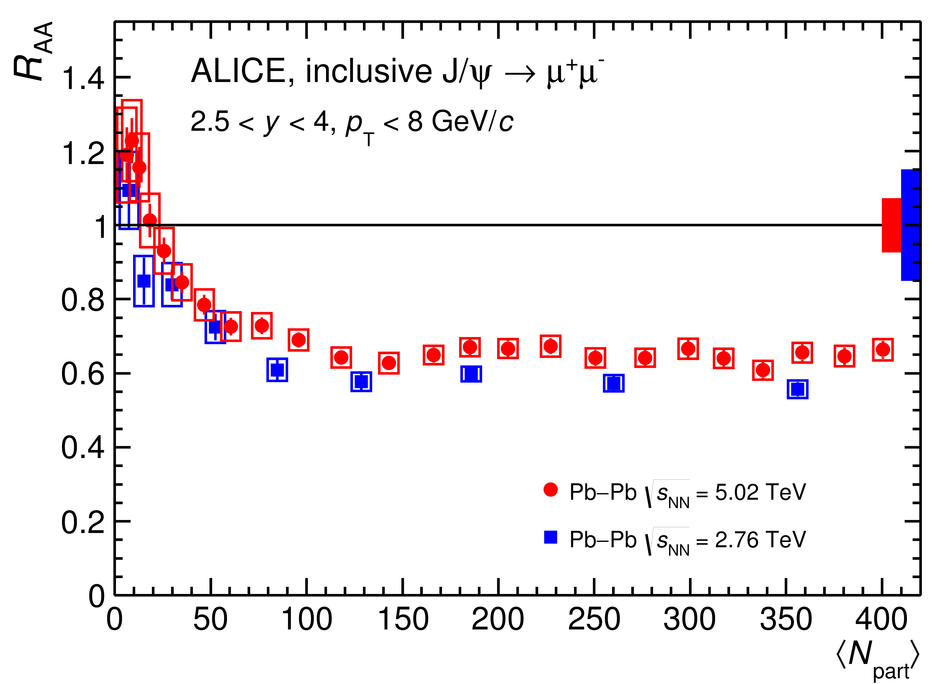 |
Figure 4
Comparison of the centrality dependence (with 10% width centrality classes) of the inclusive J/$\psi$ $R_{\rm AA}$ for $0.3< p_{\rm T}< 8$ GeV/$c$ with theoretical models . The model calculations do not include the $p_{\rm T}$ cut (except for TM1), which was anyway found to have a negligible impact, since they only include hadronic J/$\psi$ production. The error bars represent the statistical uncertainties, the boxes around the data points the uncorrelated systematic uncertainties, while the centrality-correlated global uncertainty is shown as a filled box around $R_{\rm AA}=1$. The brackets shown in the three most peripheral centralityintervals represent the range of variation of the hadronic J/$\psi$ $R_{\rm AA}$ under extreme hypothesis on the photo-production contamination on the inclusive $R_{\rm AA}$. | 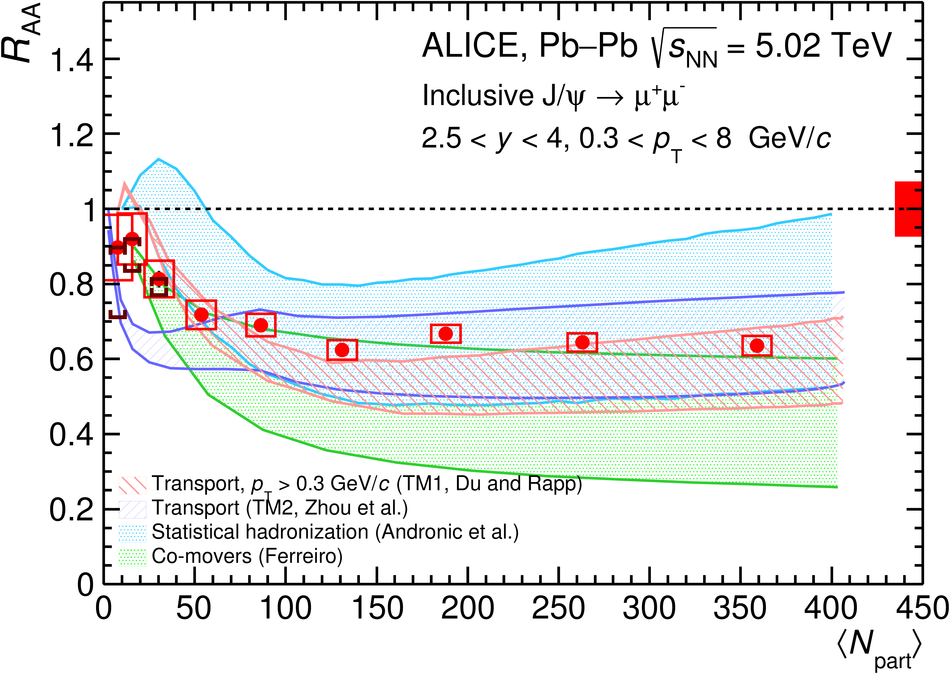 |
Figure 5
The ratio of the inclusive J/$\psi$ $R_{\rm AA}$ for $0.3< p_{\rm T}< 8$ GeV/$c$ between $\sqrt{s_{\rm NN}}=5.02$ and 2.76 TeV, compared to theoretical models [17–19, 52–55], shown as a function of centrality. The model calculations do not include the $p_{\rm T}$ cut (except for TM1), which was anyway found to have a negligible impact, since they only include hadronic J/$\psi$ production. The error bars represent the statistical uncertainties and the boxes around the data points the uncorrelated systematic uncertainties. The centrality-correlated global uncertainty is shown as a filled box around $r=1$ and is obtained as the quadratic sum of the corresponding global uncertainties at $\sqrt{s_{\rm NN}} = 2.76$ and $5.02$ TeV. | 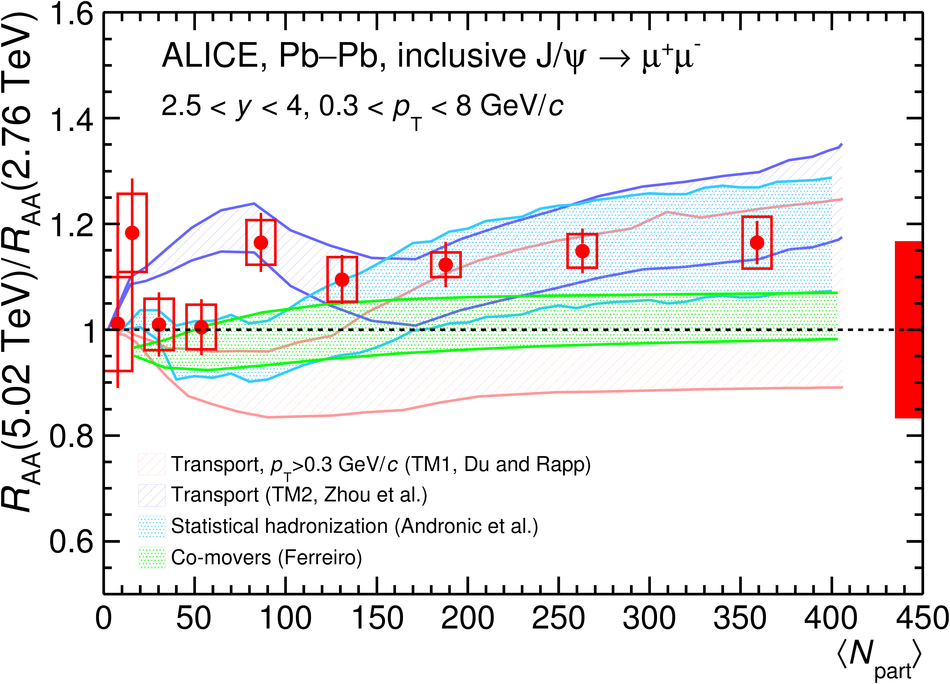 |
Figure 6
The $p_{\rm T}$ dependence of the inclusive J/$\psi$ $R_{\rm AA}$ at $\sqrt{s_{\rm NN}}=5.02$ TeV, compared to the corresponding result at $\sqrt{s_{\rm NN}}=2.76$ TeV [20] and to the calculation of a transport model [18, 54, 55] (TM1), in the centrality interval 0-20%. The $p_{\rm T}$ dependence of $r$ is also shown for both data and theory. The error bars represent statistical uncertainties, the boxes around the points uncorrelated systematic uncertainties, while $p_{\rm T}$-correlated global uncertainties are shown as a filled box around $R_{\rm AA}=1$. | 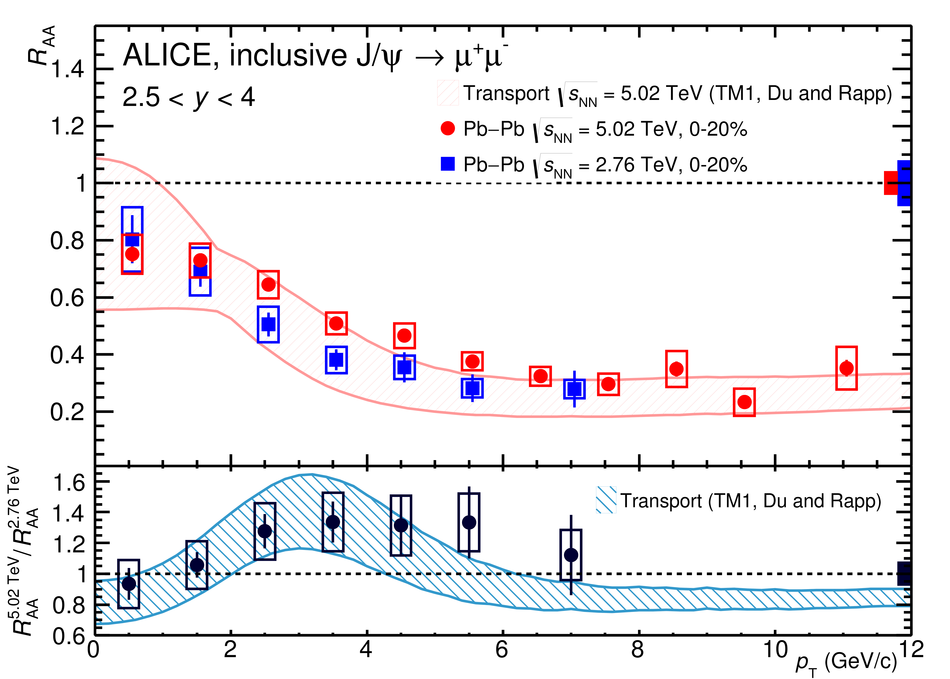 |