Left: Transverse momentum spectra multiplied by the B.R. of the $^{3}_{\Lambda}\rm{H} \rightarrow ^{3}\rm{He} + \pi^-$ decay for $^{3}_{\Lambda}\rm{H}$ (filled circles) and $^{3}_{\bar{\Lambda}}\overline{\rm{H}}$ (squares) for the most central (0-10%) Pb-Pb collisions at $\sqrt{s}$ = 2.76 TeV for $|y| < $ 0.5. Symbols are displaced for better visibility. The dashed lines are the Blast-Wave curves used to extract the particle yields integrated over the full $\pt$ range. In order to take into account the large binning used in the analysis and the limited number of bins, the center of each bin was evaluated weighting the actual bin center with the Blast-Wave function Right: $^{3}_{\bar{\Lambda}}\overline{\rm{H}}$ to $^{3}_{\Lambda}\rm{H}$ ratio as a function of $\pt$. In both panels statistical uncertainties are represented by bars and systematic uncertainties are represented by open boxes. | 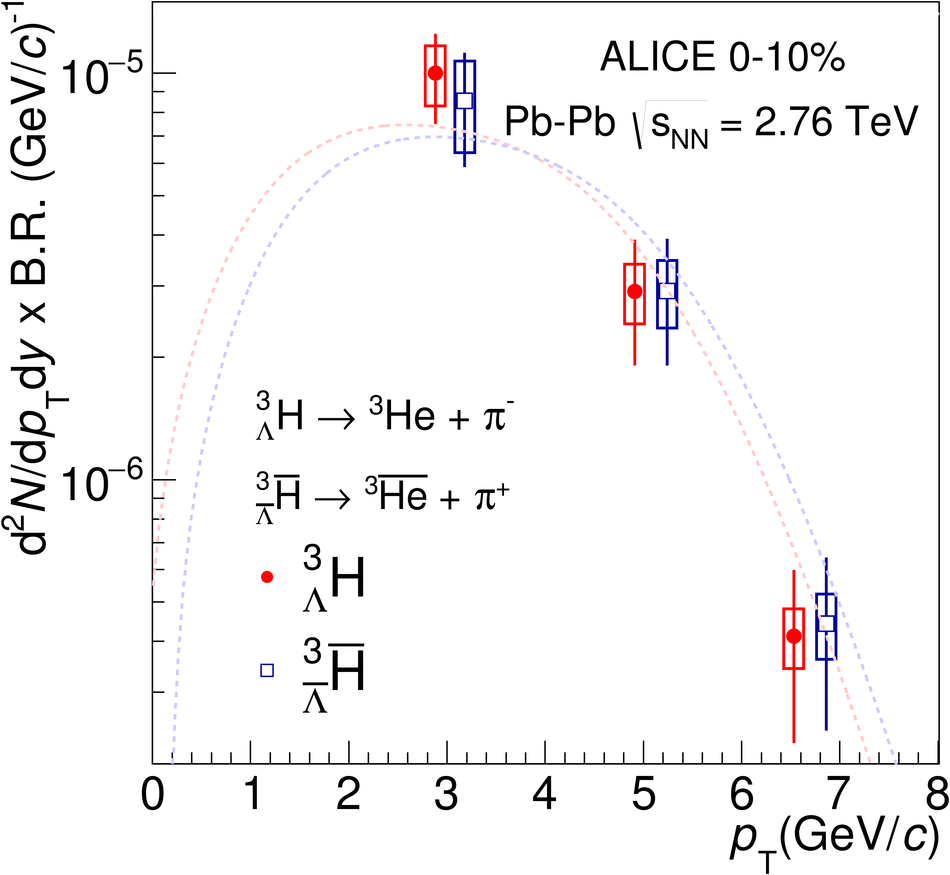 |
