(colour online) (\X+\Ix)/(\pip+\pim) (left) and (\Om+\Mo)/(\pip+\pim) (right) ratios as a function of $\avg{\dNdeta}$ for all three colliding systems. The ratios for the seven multiplicity classes in \pPb\ data lie between the Minimum Bias pp (\s = 900 GeV and \s = 7 TeV ) and peripheral \PbPb\ results. The \PbPb\ points represent, from left to right, the 60-80$\%$, 40-60$\%$, 20-40$\%$ and 10-20$\%$ and 0-10$\%$ centrality classes. The chemical equilibrium predictions by the GSI-Heidelberg and the \thermus 2.3 models are represented by the horizontal lines. | 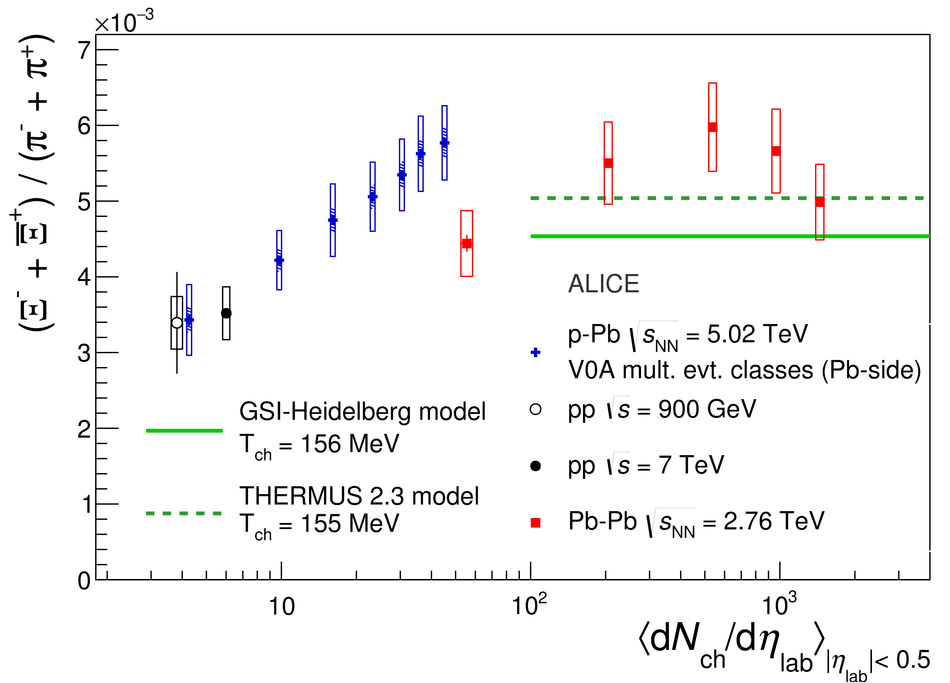 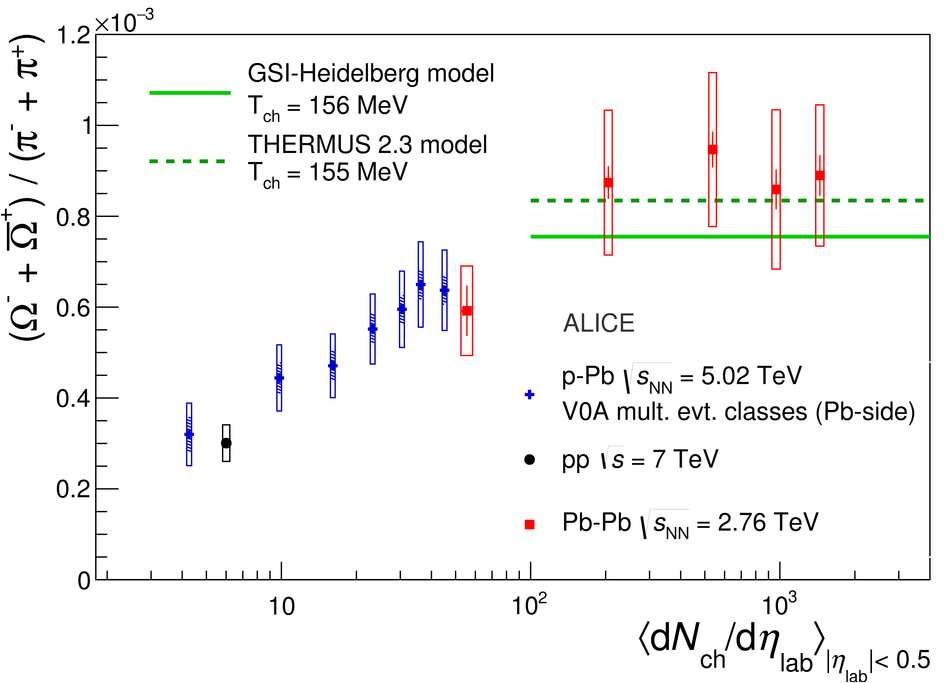 |