The production of prompt charmed mesons D$^0$, D$^+$ and D$^{*+}$, and their antiparticles, was measured with the ALICE detector in Pb-Pb collisions at the centre-of-mass energy per nucleon pair, $\sqrt{s_{\rm NN}}$, of 2.76 TeV. The production yields for rapidity $|y|<~0.5$ are presented as a function of transverse momentum, $p_{\rm T}$, in the interval 1-36 GeV/$c$ for the centrality class 0-10% and in the interval 1-16 GeV/$c$ for the centrality class 30-50%. The nuclear modification factor $R_{\rm AA}$ was computed using a proton-proton reference at $\sqrt{s} = 2.76$ TeV, based on measurements at $\sqrt{s} = 7$ TeV and on theoretical calculations. A maximum suppression by a factor of 5-6 with respect to binary-scaled pp yields is observed for the most central collisions at $p_{\rm T}$ of about 10 GeV/$c$. A suppression by a factor of about 2-3 persists at the highest $p_{\rm T}$ covered by the measurements. At low $p_{\rm T}$ (1-3 GeV/$c$), the $R_{\rm AA}$ has large uncertainties that span the range 0.35 (factor of about 3 suppression) to 1 (no suppression). In all $p_{\rm T}$ intervals, the $R_{\rm AA}$ is larger in the 30-50% centrality class compared to central collisions. The D-meson $R_{\rm AA}$ is also compared with that of charged pions and, at large $p_{\rm T}$, charged hadrons, and with model calculations.
JHEP 03 (2016) 081
HEP Data
e-Print: arXiv:1509.06888 | PDF | inSPIRE
CERN-PH-EP-2015-252
Figure 1
(K, $\pi$) (top row) and (K, $\pi$, $\pi$) (central row) invariant-mass distributions for the centrality class 0-10%. Bottom row: Distribution of the mass difference $\Delta M=M({\rm K}\pi\pi)-M({\rm K}\pi)$ for the centrality class 0-10%. The distributions are reported in three $\pt$ intervals for each meson (left, middle and right column). The fit functions used to describe the background (dash), the background without signal reflections (only for $\Dzero$, long-dash) and the total distribution including the signal (solid) are shown. | 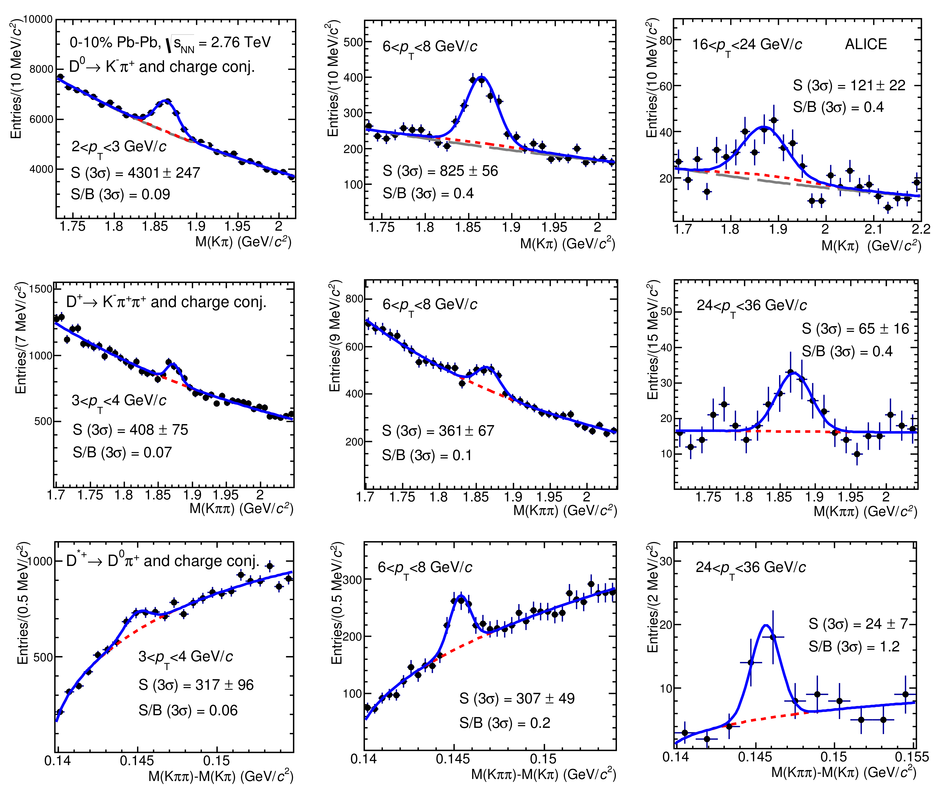 |
Figure 2
(K, $\pi$) invariant-mass distribution for the interval $1< \pt< 2 $ GeV/$c$ for the 0-10% (left) and 30-50% (right) centrality classes, obtained after the subtraction of the background estimated by a fourth-order polynomial function for the most central collisions and an exponential for the 30-50% centrality class. The contribution of reflections is also included in the fit. The fit function used to describe the signal (solid line) is shown. | 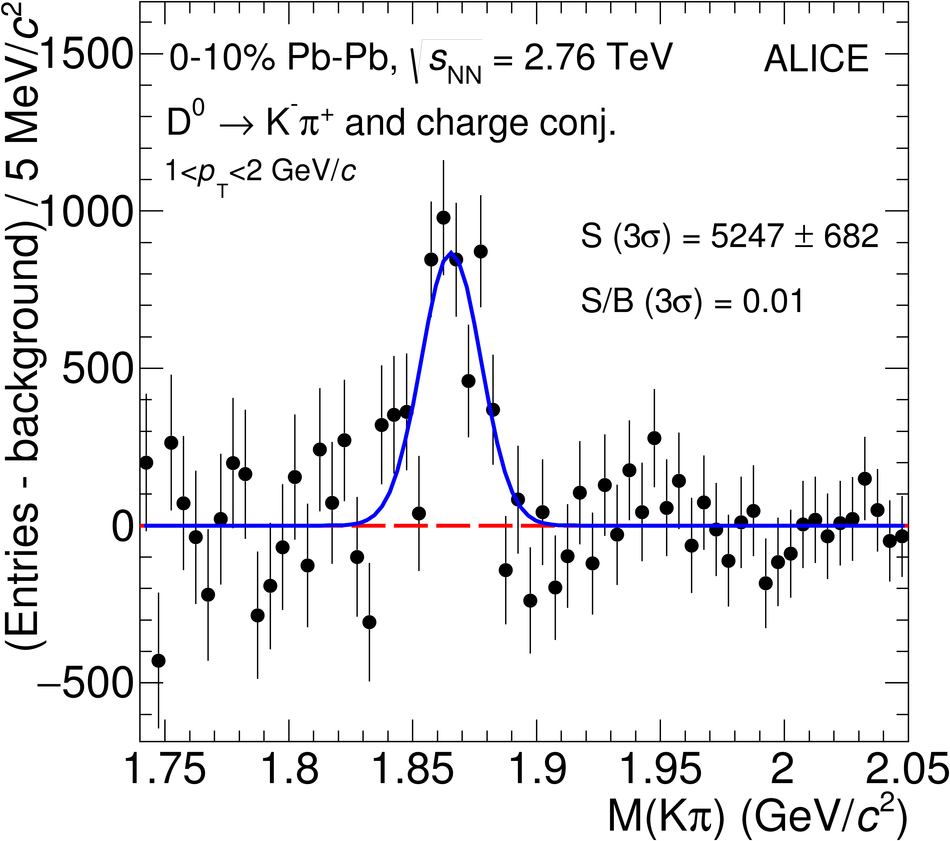 |
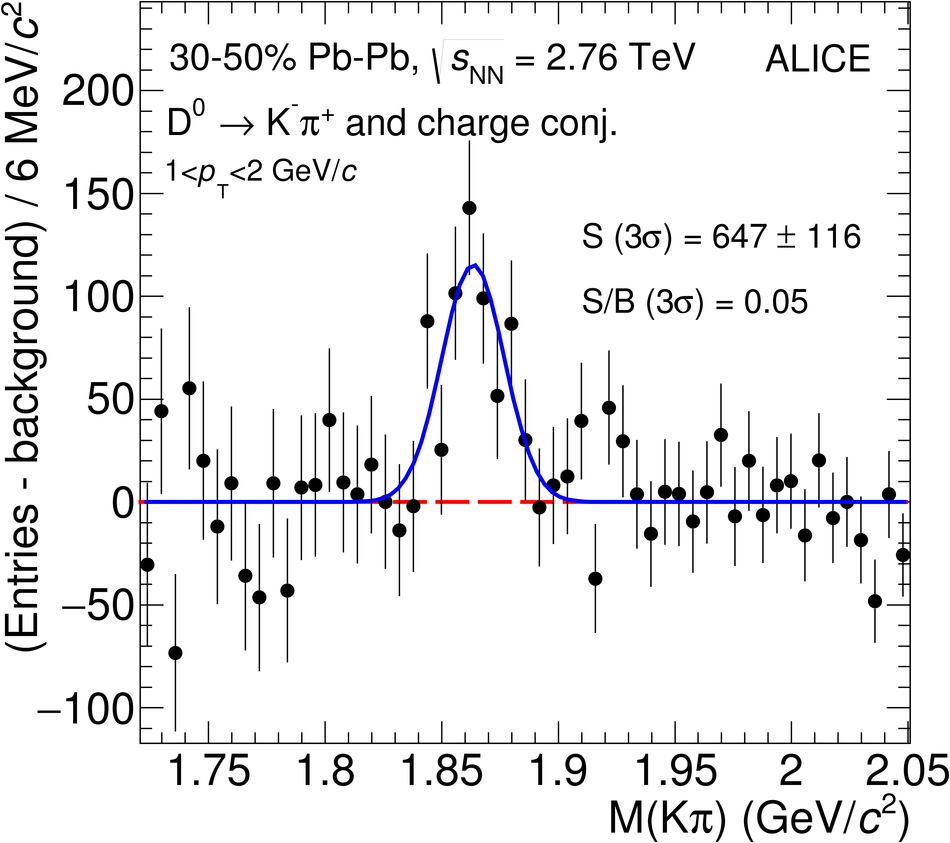
Figure 3
Product of acceptance and efficiency for D mesons in Pb-Pb collisions for the 0-10% centrality class. The rapidity interval is $|y| < y_{\rm fid}$ (see Section 3.1). The values for prompt (solid lines) and feed-down (dotted lines) D mesons are shown. Also displayed, for comparison, are the values for prompt D mesons without PID selection (dashed lines). | 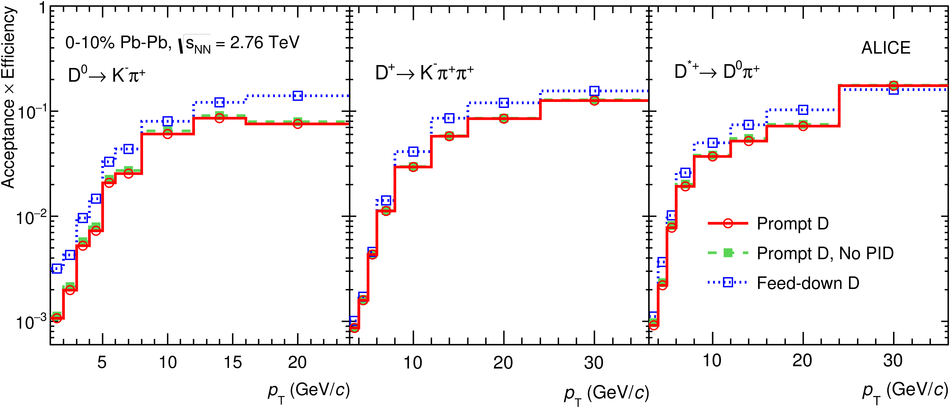 |
Figure 5
Transverse momentum distributions d$N/$d$\pt$ of prompt $\Dzero$ (a), $\Dplus$ (b) and $\Dstar$ (c) mesons in the 0-10% centrality class in Pb-Pb collisions at $\snn=2.76 \rm TeV$. The pp reference distributions $\langle\rm {T_{AA}}\rangle \rm {d}\sigma/\rm{d}\pt$ are shown as well. Statistical uncertainties (bars) and systematic uncertainties from data analysis (empty boxes) and from feed-down subtraction (shaded boxes) are shown. Horizontal bars represent bin widths, symbols are placed at the centre of the bin The d$N/$d$\pt$ distributions of the three D-meson species in the 10% most central Pb-Pb collisions are compared to each other in panel (d), wherethe $\Dstar$ production yields are scaled by a factor of five for visibility | 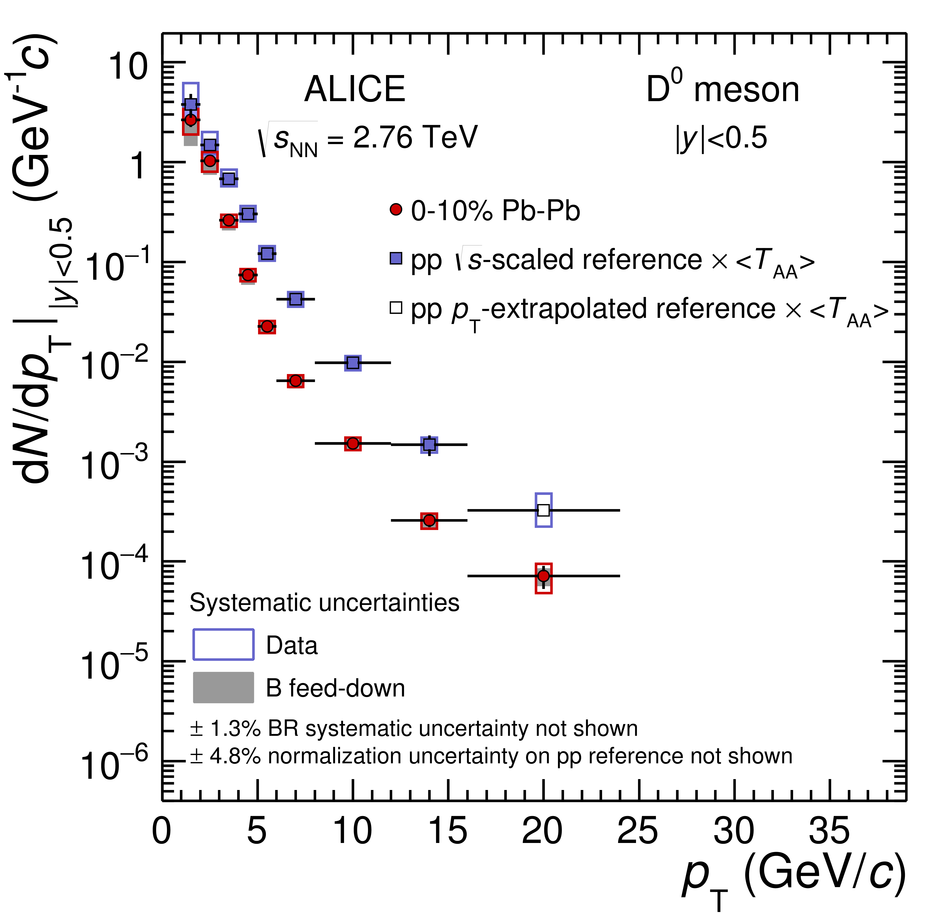 |
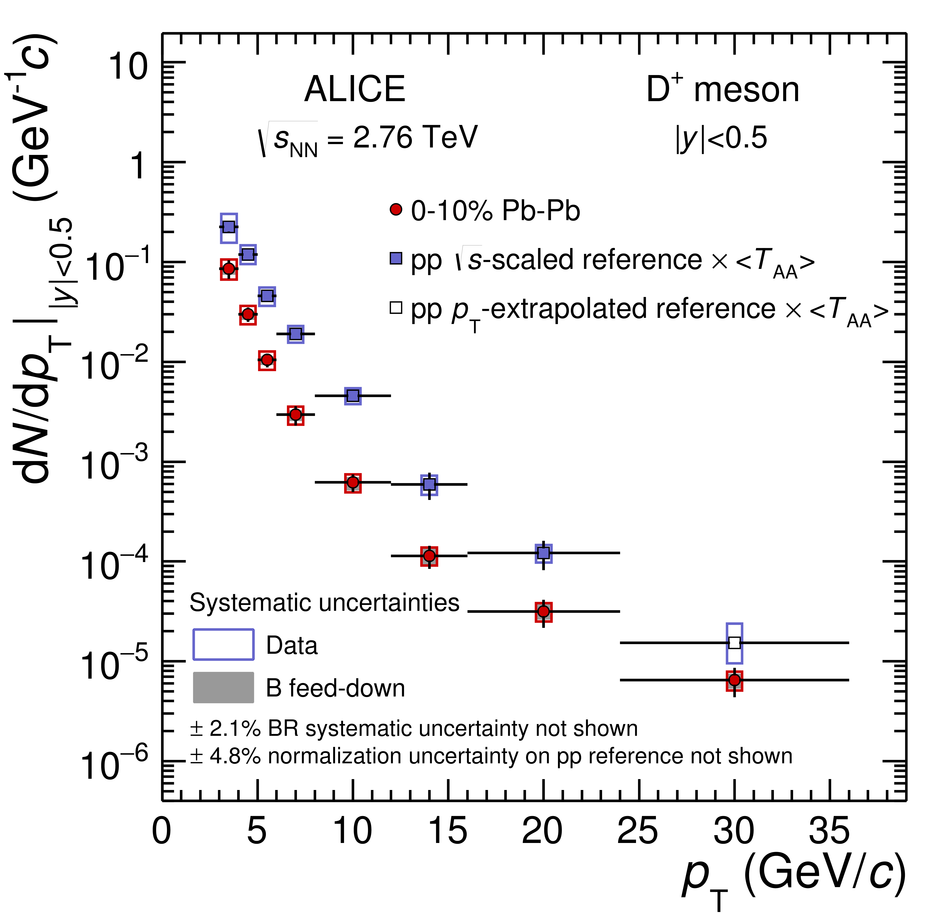
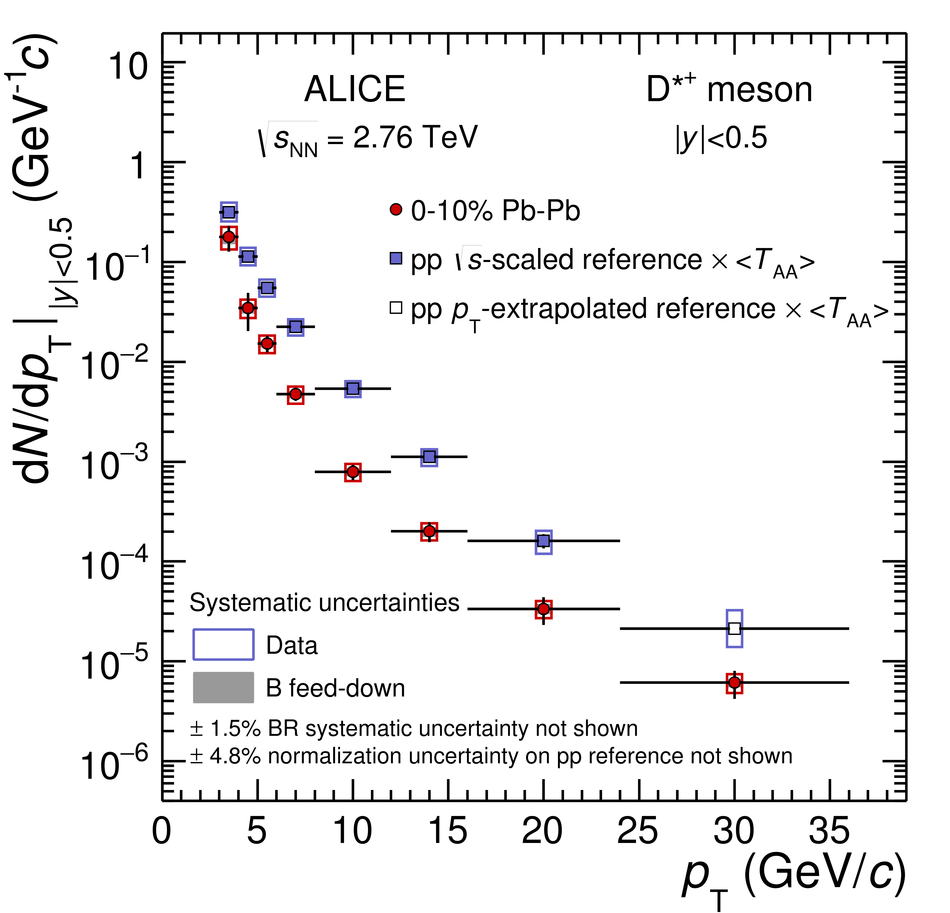
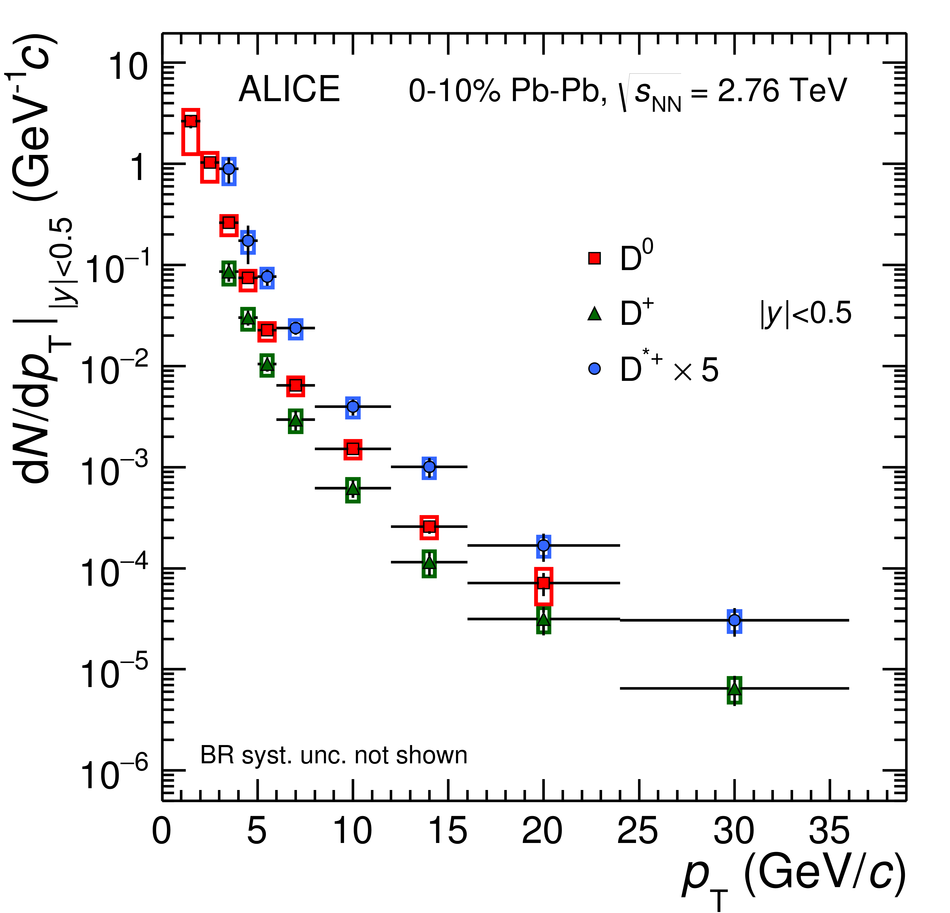
Figure 6
Transverse momentum distributions d$N/$d$\pt$ of prompt $\Dzero$ (a), $\Dplus$ (b) and $\Dstar$ (c) mesons in the 30-50% centrality class in Pb-Pb collisions at $\snn=2.76 \rm TeV$. The pp reference distributions $\langle\rm {T_{AA}}\rangle \rm {d}\sigma/\rm{d}\pt$ are shown as well. Statistical uncertainties (bars) and systematic uncertainties from data analysis (empty boxes) and from feed-down subtraction (shaded boxes) are shown. Horizontal bars represent bin widths, symbols are placed at the centre ofthe bin The d$N/$d$\pt$ distributions of the three D-meson species in Pb-Pb collisions in the 30-50% centrality class are compared to each other inpanel (d), where the $\Dstar$ production yields are scaled by a factor of five for visibility | 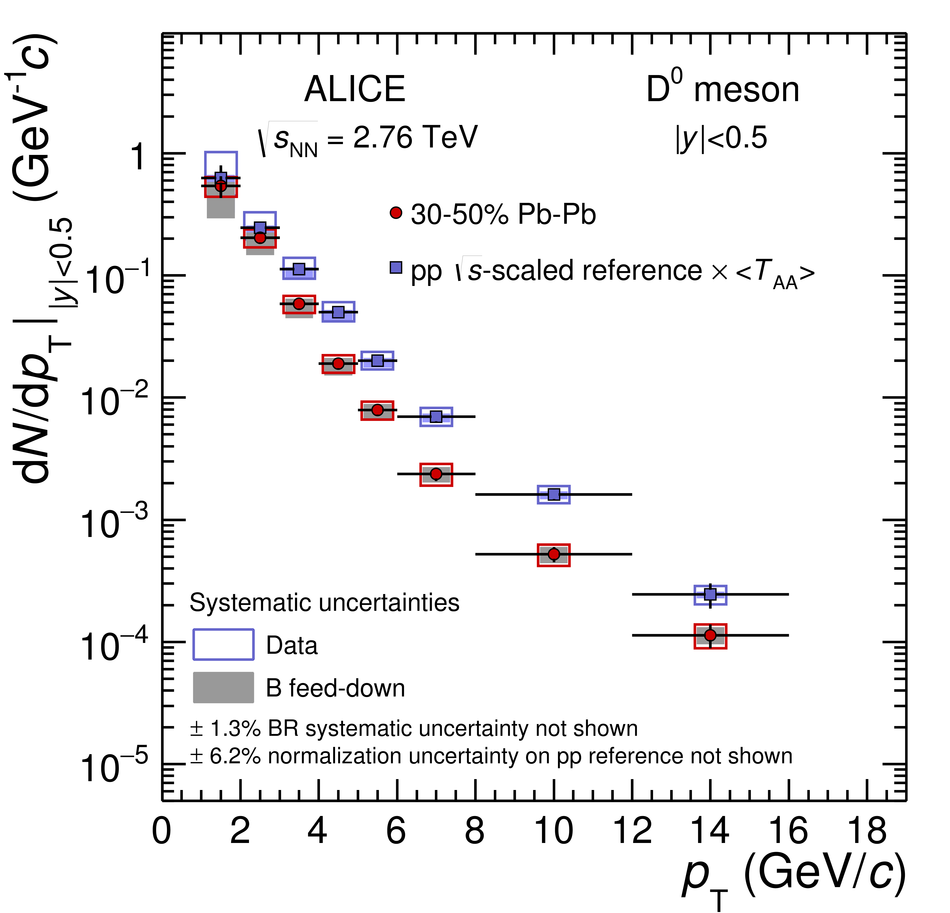 |
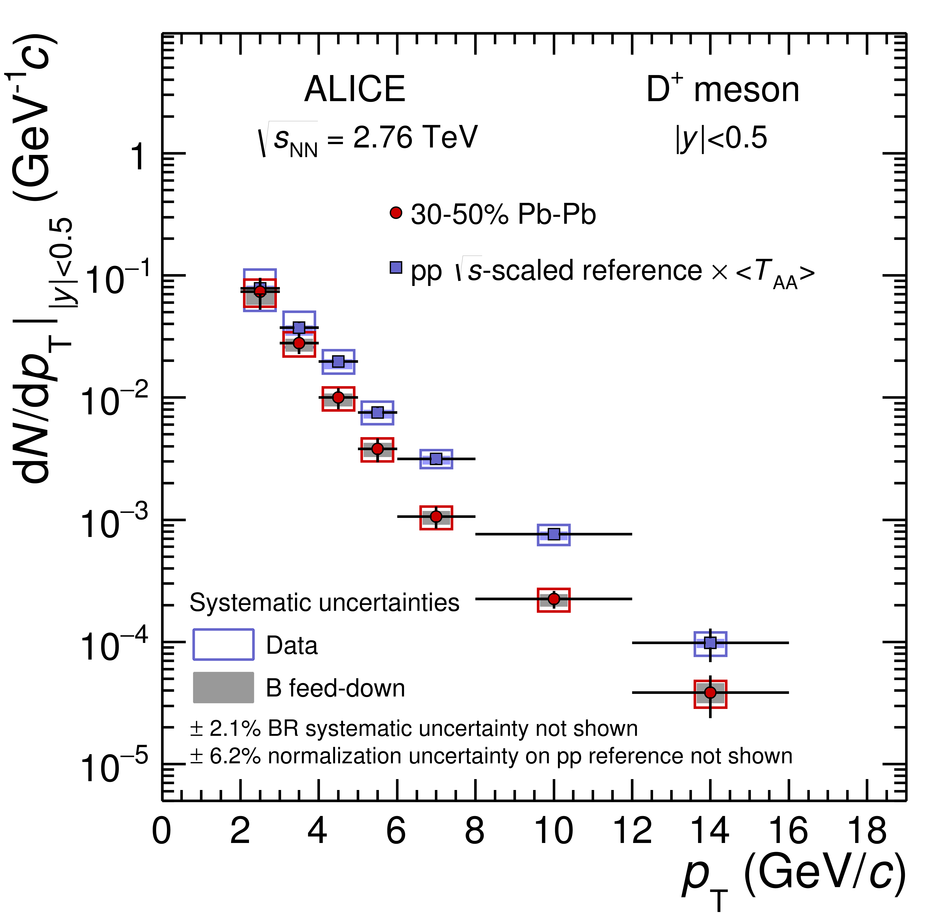
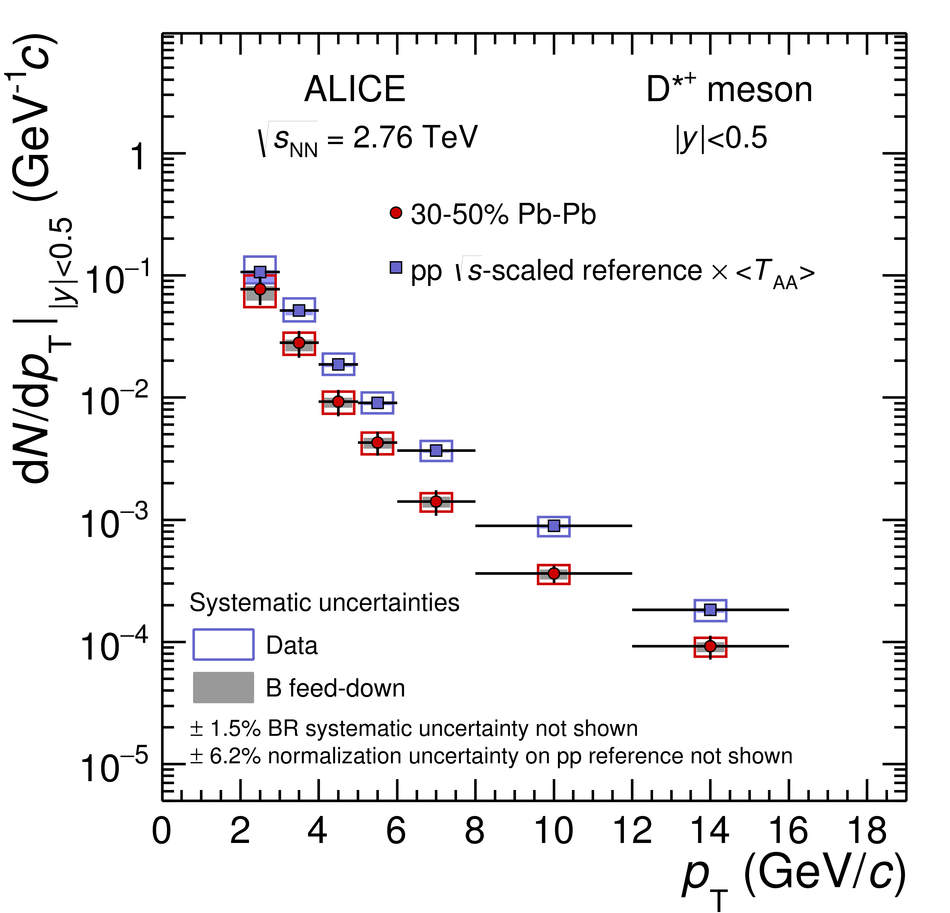
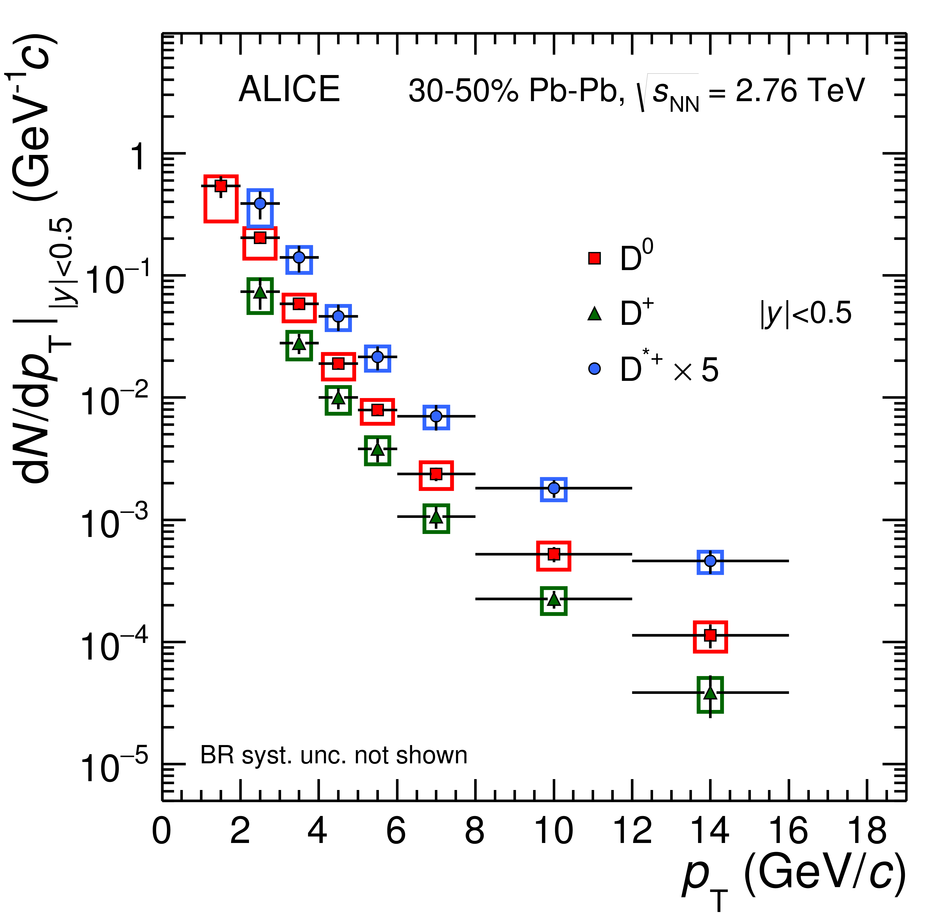
Figure 7
Ratio of prompt D-meson yields ($\Dplus$/$\Dzero$ and $\Dstar$/$\Dzero$) as a function of $\pt$ in the 10% most central Pb-Pb collisions at $\snn=2.76 \rm TeV$ compared to the results in pp collisions at $\sqrt{s}=7 \rm TeV$ Statistical (bars) and systematic (boxes) uncertainties are shown. | 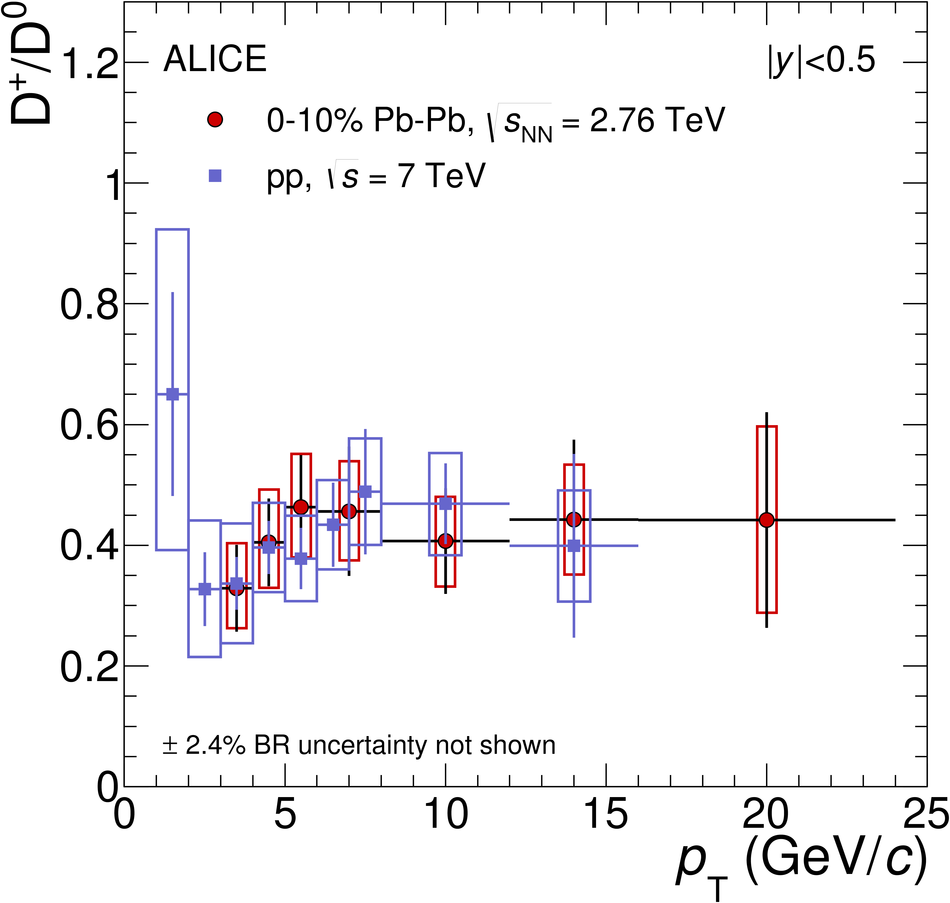 |

Figure 8
$\RAA$ of prompt $\Dzero$, $\Dplus$, and $\Dstar$ mesons for the 0-10% (left) and 30-50% (right) centrality classes. Statistical (bars), systematic (empty boxes), and normalisation (shaded box) uncertainties are shown. Horizontal bars represent bin widths. $\Dzero$ symbols are placed at the centre of the bin. $\Dplus$, and $\Dstar$ are shifted for visibility. |  |
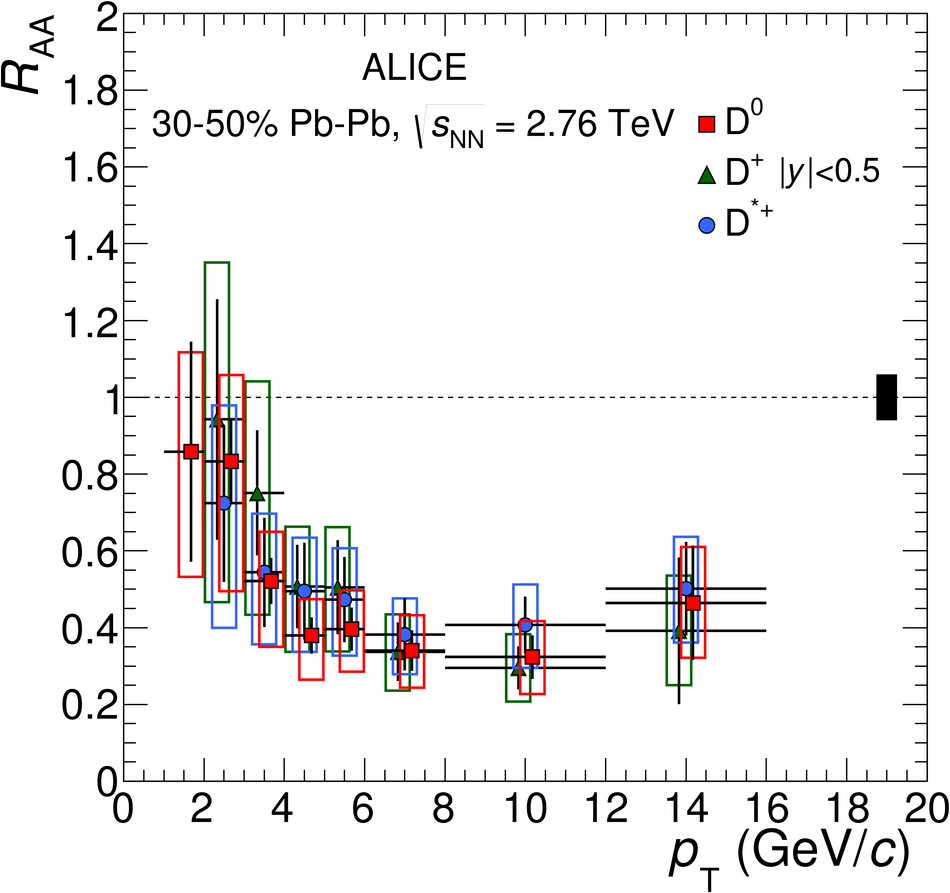
Figure 9
Left: prompt D-meson $\Raa$ (average of $\Dzero$, $\Dplus$ and $\Dstar$) as a function of $\pt$ in Pb-Pb collisions at $\snn=2.76 \rm TeV$ in the 0-10% and 30-50% centrality classes. Prompt D-meson nuclear modification factor (average of $\Dzero$, $\Dplus$ and $\Dstar$) as a function of $\pt$ in p-Pb collisions at $\sNN=5.02 \rm TeV$. Right: prompt D-meson $\Raa$ (average of $\Dzero$, $\Dplus$ and $\Dstar$) as a function of $\pt$ in the 10% most central Pb-Pb collisions at $\snn=2.76 \rm TeV$ compared to $\Dzero$ $\Raa$ measuredby the STAR Collaboration in Au-Au collisions at RHIC at $\snn=200 \rm GeV$. A zoomed-in plot of theinterval $0< \pt< 8 \rm{GeV}/c$ is shown in the inset. Statistical (bars), systematic (empty boxes), and normalisation (shaded boxes at $\Raa=1$) uncertainties are shown. Horizontal bars represent bin widths. Symbols are placed at the centre of the bin |  |
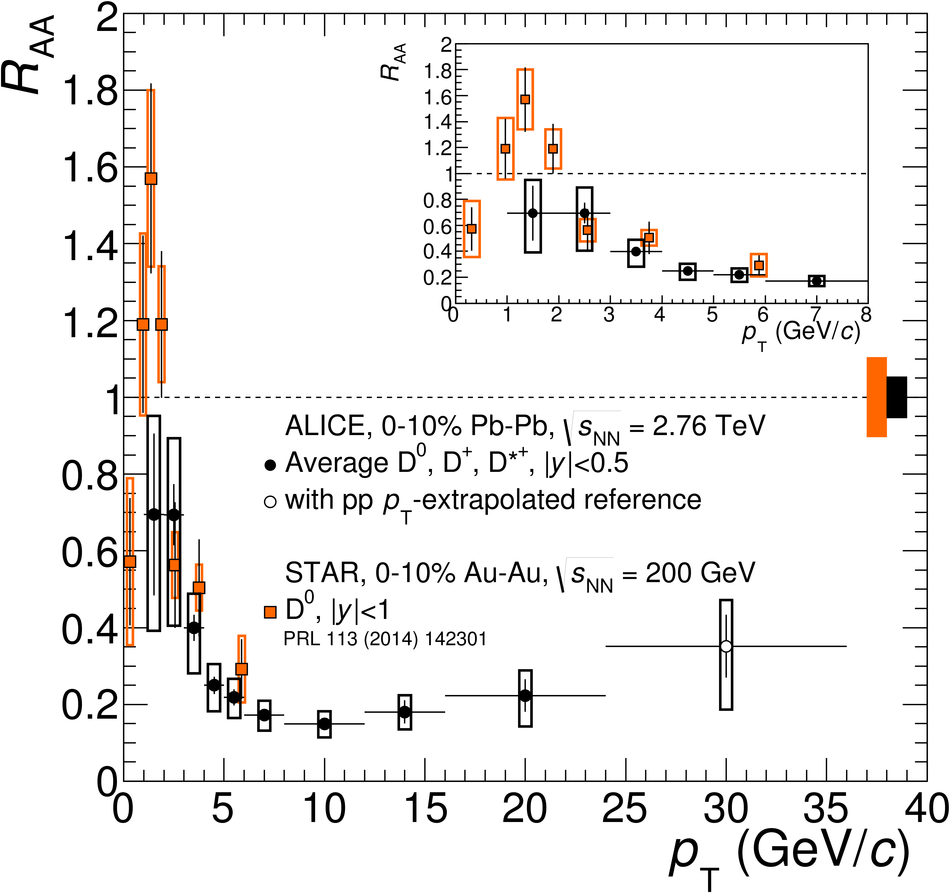
Figure 10
Prompt D-meson $\Raa$ (average of $\Dzero$, $\Dplus$ and $\Dstar$) as a function of $\pt$ compared to the nuclear modification factors of pions and charged particles in the 0-10% (left) and 30-50% (right) centrality classes. Statistical (bars), systematic (empty boxes), and normalisation (shaded box at $\Raa=1$) uncertainties are shown. Horizontal bars represent bin widths. Symbols are placed at the centreof the bin. | 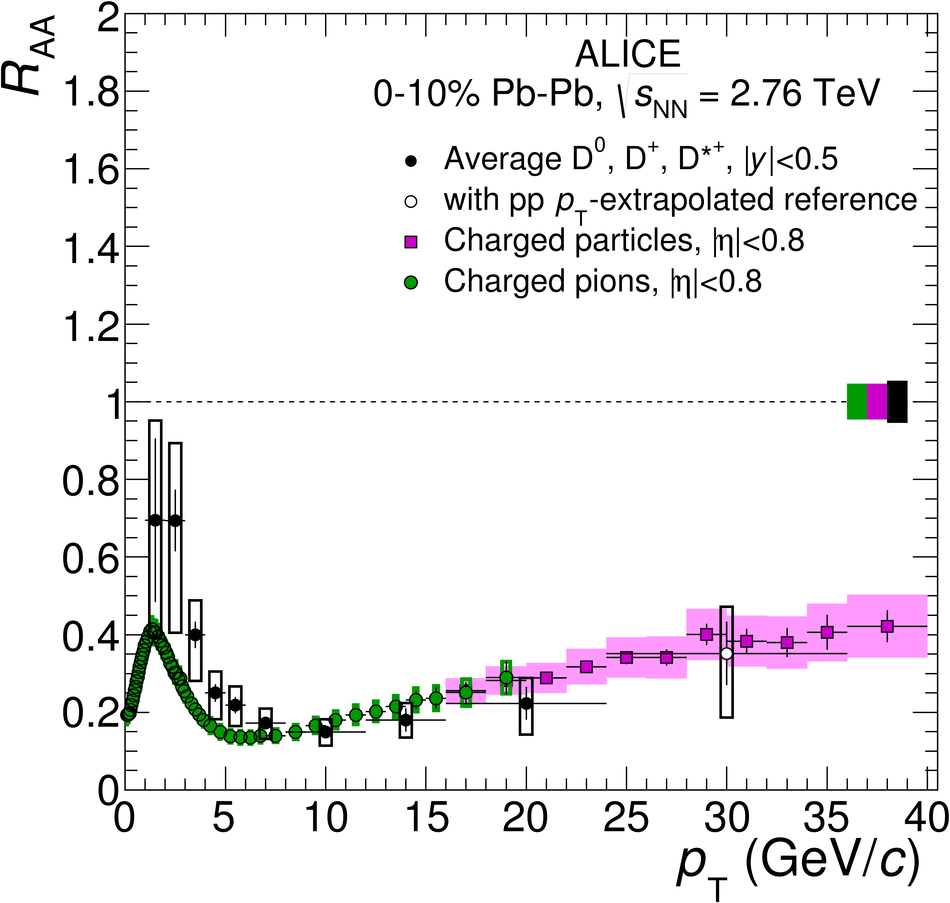 |
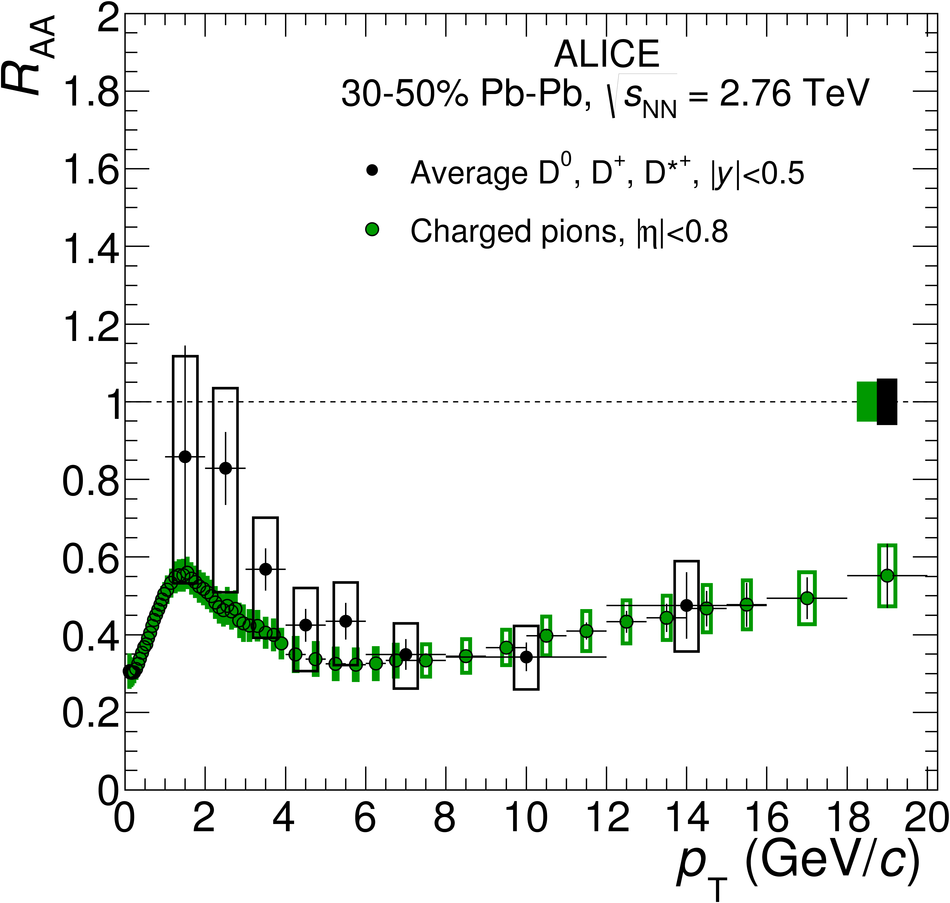
Figure 11
Average of prompt $\rm D^0$, $\rm D^+$ and $\rm D^{*+}$ $\RAA$ in the centrality classes 0-10% (a and b) and 30-50% (c and d) compared with model calculations: ${\it Djordjevic}, {\it CUJET3.0}$, ${\it WHDG}, {\it Vitev}$ (a and c), ${\it TAMU elastic}$, $ {\it Cao, Qin and Bass}$, ${\it MC@sHQ+EPOS, Coll+Rad(LPM)}$, $ {\it POWLANG}$, $ {\it BAMPS}, {\it PHSD}$ (b and d) .Some of the model calculations are shown by two lines to represent their uncertainties. | 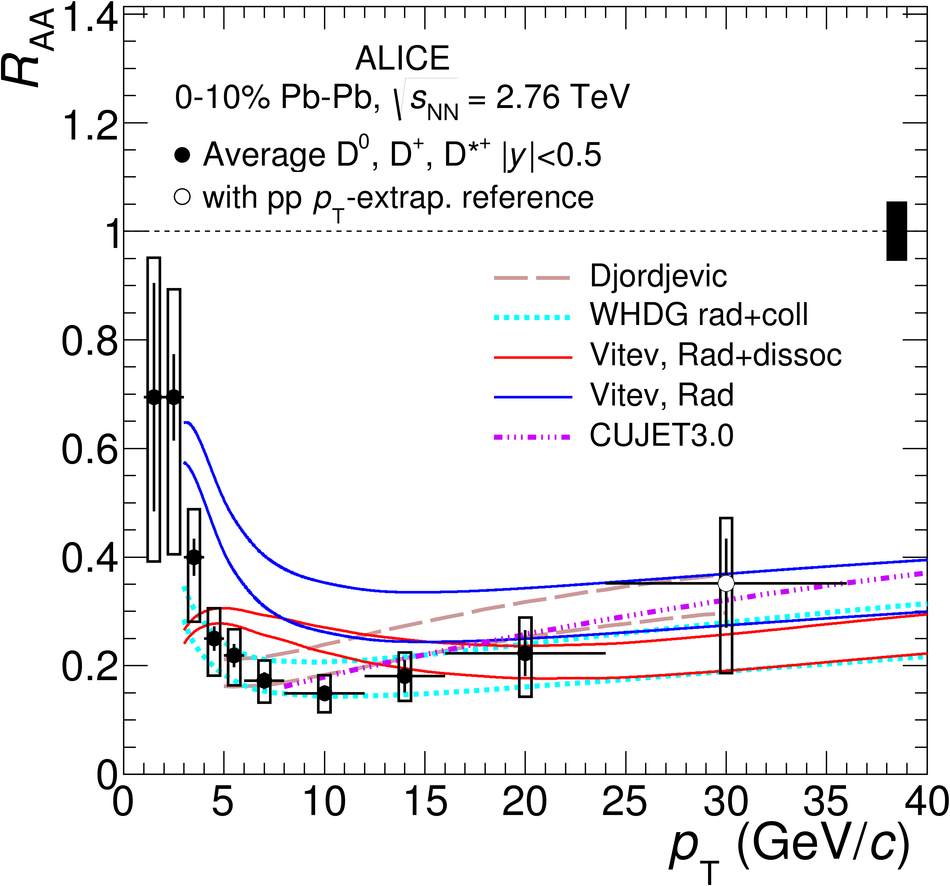 |

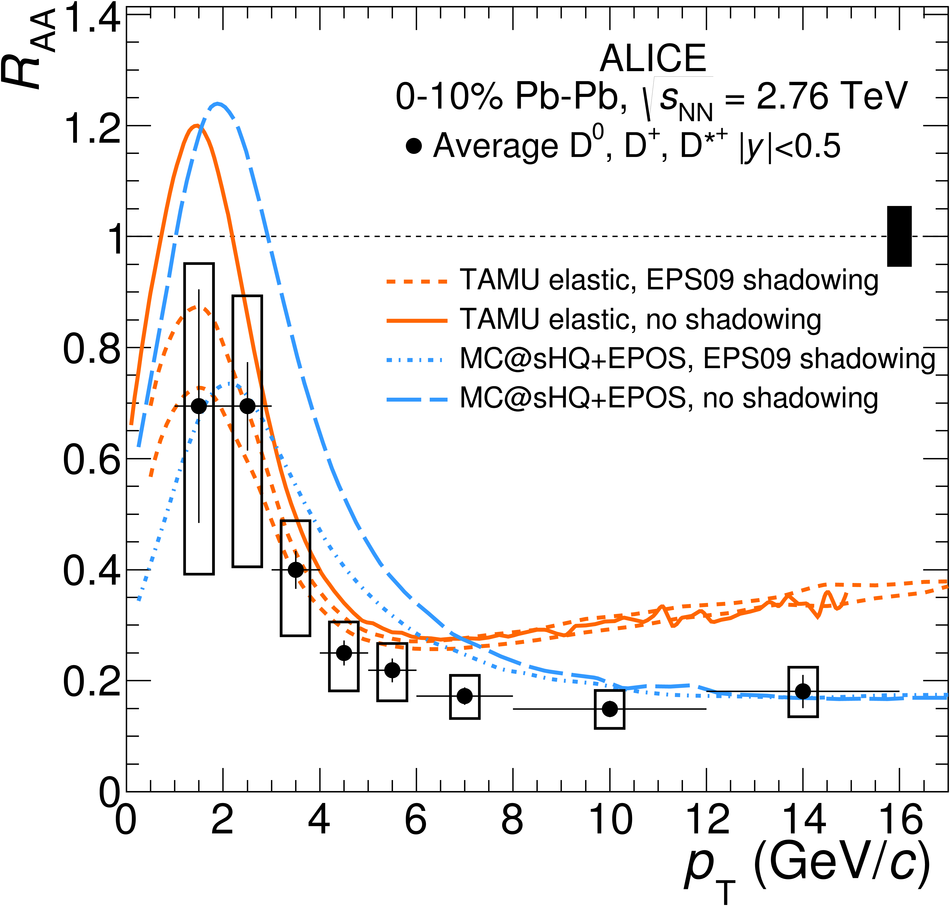
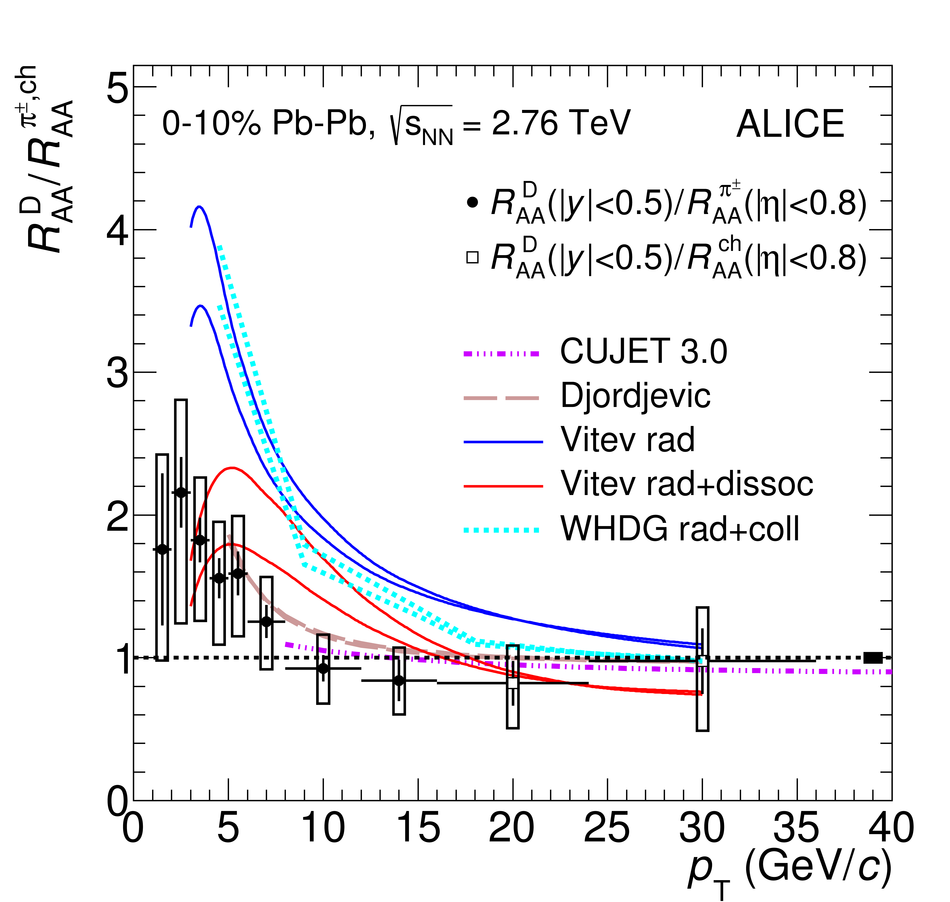
Figure 13
Left: $\RAA$ of charged pions ($\pt< 16 \rm{GeV}/c$) and of charged particles ($\pt>16 \rm{GeV}/c$) compared with model calculations that compute also the D-meson $\RAA$. Right: ratio of the $\RAA$ of prompt D mesons (average of $\rm D^0$, $\rm D^+$ and $\rm D^{*+}$ as shown in Fig.11) and the $\RAA$ of charged pions (for $\pt< 20 \rm{GeV}/c$) or charged particles (for $\pt>20 \rm{GeV}/c$), compared with the same model calculations shown in the left panel. | 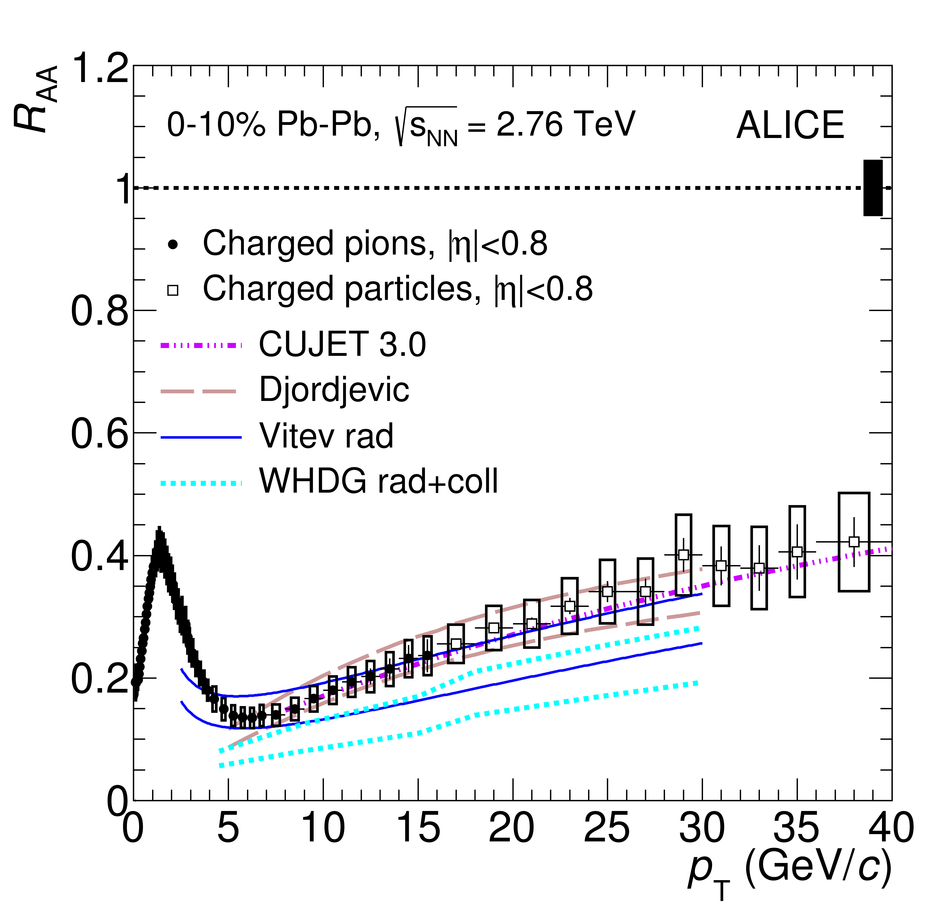 |
![[png]](https://alice-publications.web.cern.ch/sites/default/files/papers/1868/AverageDmesonRaavspT_010_Models_transport-17331.png)
![[png]](https://alice-publications.web.cern.ch/sites/default/files/papers/1868/AverageDmesonRaavspT_3050_Models_transport-17333.png)