We present results of a search for two hypothetical strange dibaryon states, i.e. the H-dibaryon and the possible $\bar{\Lambda\mathrm{n}}$ bound state. The search is performed with the ALICE detector in central (0-10%) Pb-Pb collisions at $ \sqrt{s_{\rm{NN}}} = 2.76$ TeV, by invariant mass analysis in the decay modes $\bar{\Lambda\mathrm{n}} \rightarrow \bar{\mathrm{d}} \pi^{+} $ and H-dibaryon $\rightarrow \Lambda \mathrm{p} \pi^{-}$. No evidence for these bound states is observed. Upper limits are determined at 99% confidence level for a wide range of lifetimes and for the full range of branching ratios. The results are compared to thermal, coalescence and hybrid UrQMD model expectations, which describe correctly the production of other loosely bound states, like the deuteron and the hypertriton.
Phys. Lett. B 752 (2016) 267-277
e-Print: arXiv:1506.07499 | PDF | inSPIRE
CERN-PH-EP-2015-068

Figure 2
Invariant mass distribution for $\overline{\mathrm{d}}\pi^{+}$ for the Pb--Pb data corresponding to $ 19.3 \times 10^{6}$ central events. The arrow indicates the sum of the mass of the constituents ($\overline{\Lambda\mathrm{n}}$) of the assumed bound state. A signal for the bound state is expected in the region below this sum. The dashed line represents an exponential fit outside the expected signal region to estimate the background. | 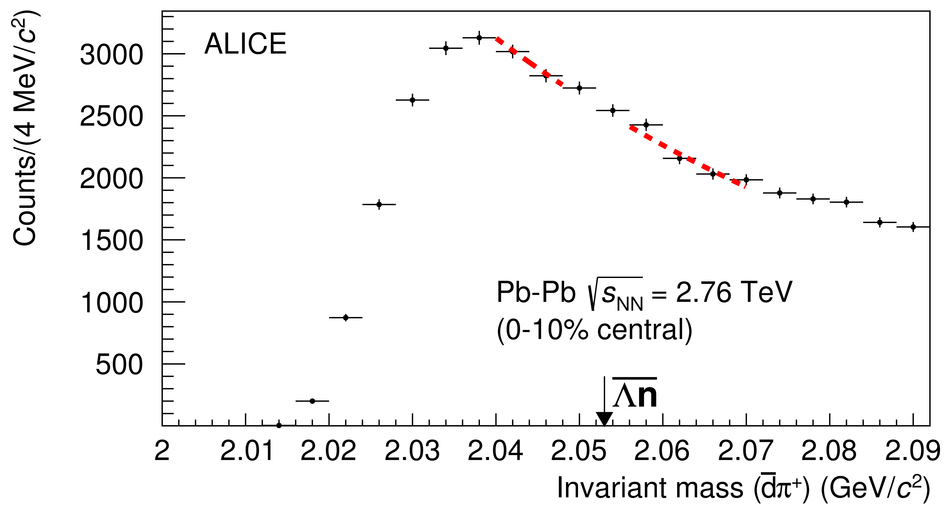 |
Figure 3
Invariant mass distribution for $\Lambda \mathrm{p} \pi^{-} $ for the Pb--Pb data corresponding to $ 19.3 \times 10^{6}$ central events. The left arrow indicates the sum of the masses of the constituents ($\Lambda\Lambda$) of the possible bound state. A signal for the bound state is expected in the region below this sum. For the speculated resonant state a signal is expected between the $\Lambda\Lambda$ and the $\Xi$p (indicated by the right arrow) thresholds. The dashed line is an exponential fit to estimate the background. | 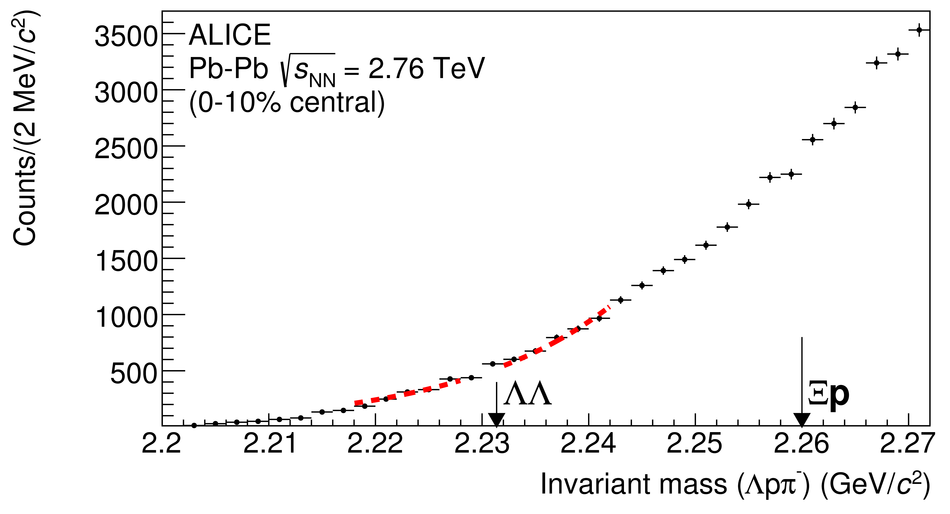 |
Figure 4
Upper limit of the rapidity density as function of the decay length shown for the $\overline{\Lambda \mathrm{n}}$ bound state in the upper panel and for the H-dibaryon in the lower panel. Here a branching ratio of 64\% was used for the H-dibaryon and a branching ratio of 54\% for the $\overline{\Lambda \mathrm{n}}$ bound state. The horizontal (dashed) lines indicate the expectation of the thermal model with a temperature of 156 MeV. The vertical line shows the lifetime of the free $\Lambda$ baryon. | 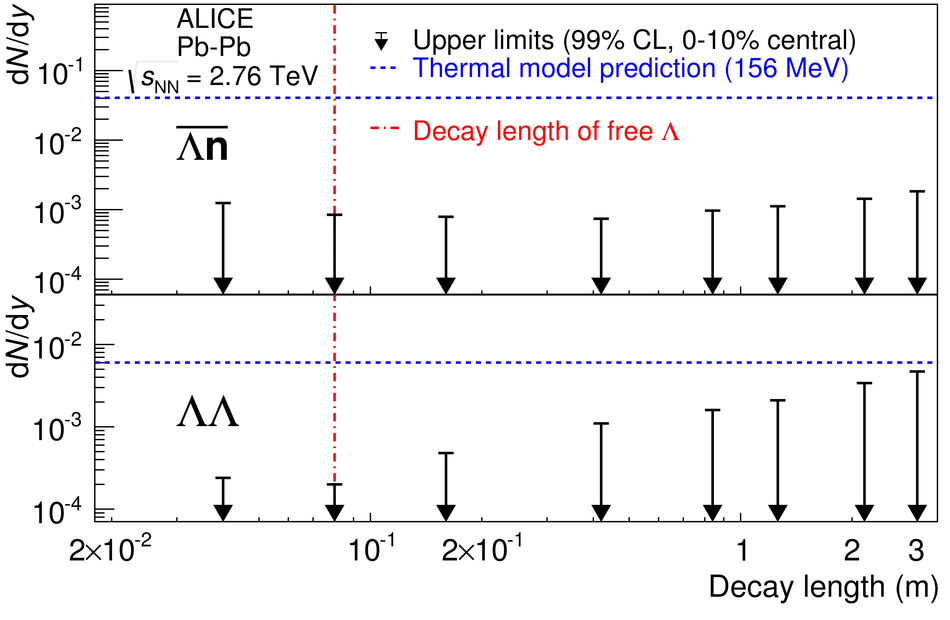 |
Figure 5
Experimentally determined upper limit, under the assumption of the lifetime of a free $\Lambda$. In the upper panel shown for the $\overline{\Lambda \mathrm{n}}$ bound state and for the H-dibaryon in the lower panel. It includes 30\% systematic uncertainty for each particle and 6\% correction for absorption with an uncertainty of 7\% for the $\overline{\Lambda \mathrm{n}}$ bound state. The theory lines are drawn for different theoretical branching ratios (BR) in blue for the equilibrium thermal model from for two temperatures (164 MeV the full line and 156 MeV the dashed line), in green the non-equilibrium thermal model from and in yellow the predictions from a hybrid UrQMD calculation . The H-dibaryon is also compared with predictions from coalescence models, where the full red line visualises the prediction assuming quark coalescence and the dashed red line corresponds to hadron coalescence . |  |