Measured dielectron nuclear modification factor as a function of $p_{\rm T,ee}$ in the low-mass region (left) and intermediate-mass region (right) at $\sqrt{s_{\rm{NN}}}$ = 5.02 TeV. The data are shown in blue, with their statistical and systematic uncertainties depicted as vertical bars and boxes. The baseline expectation, calculated from the pp and p$-$Pb cocktails outlined in Sec.4, is shown as a black line with a gray band indicating its uncertainties. Two additional cocktails, one incorporating a modified charm production due to CNM effects and another one including thermal radiation from the hadronic and partonic phases, are shown as red and orange dashed lines, respectively. | 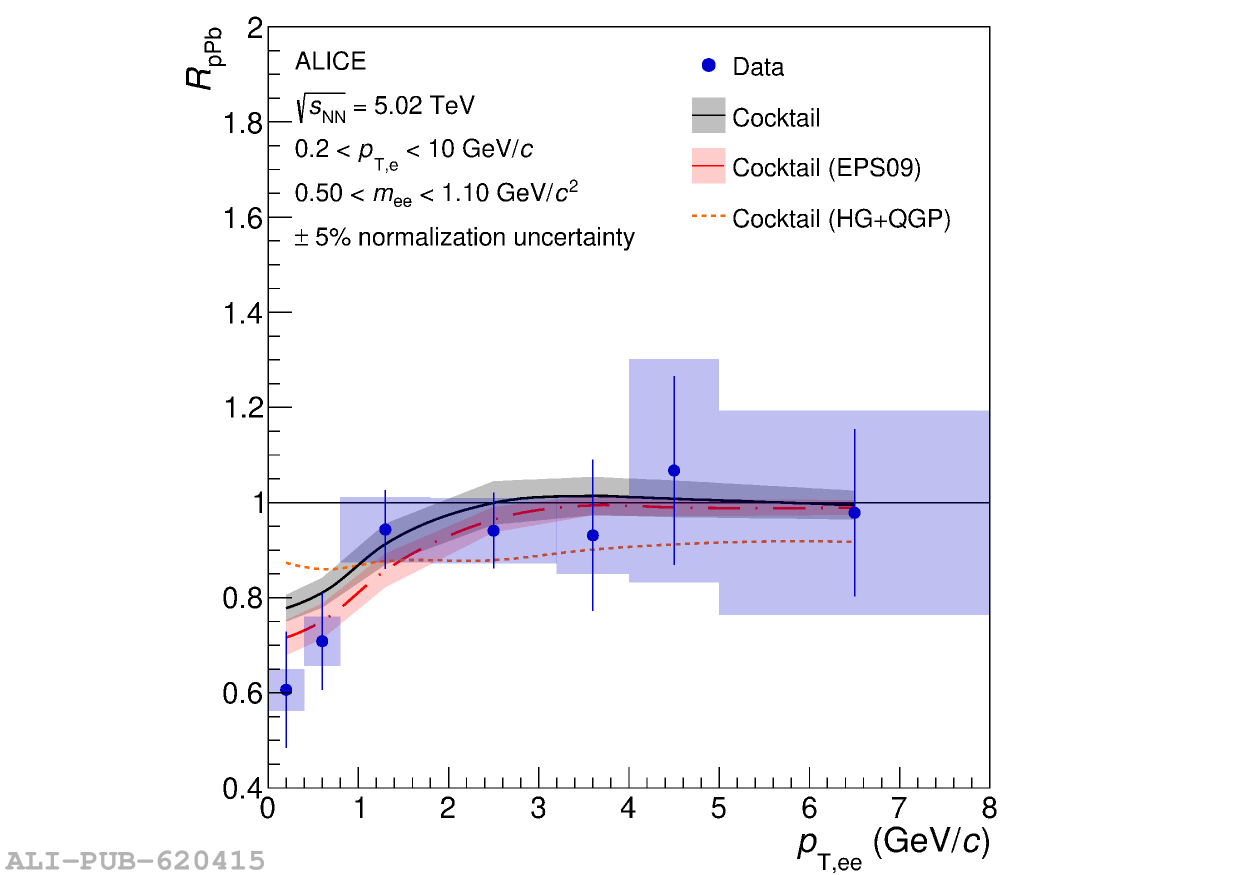 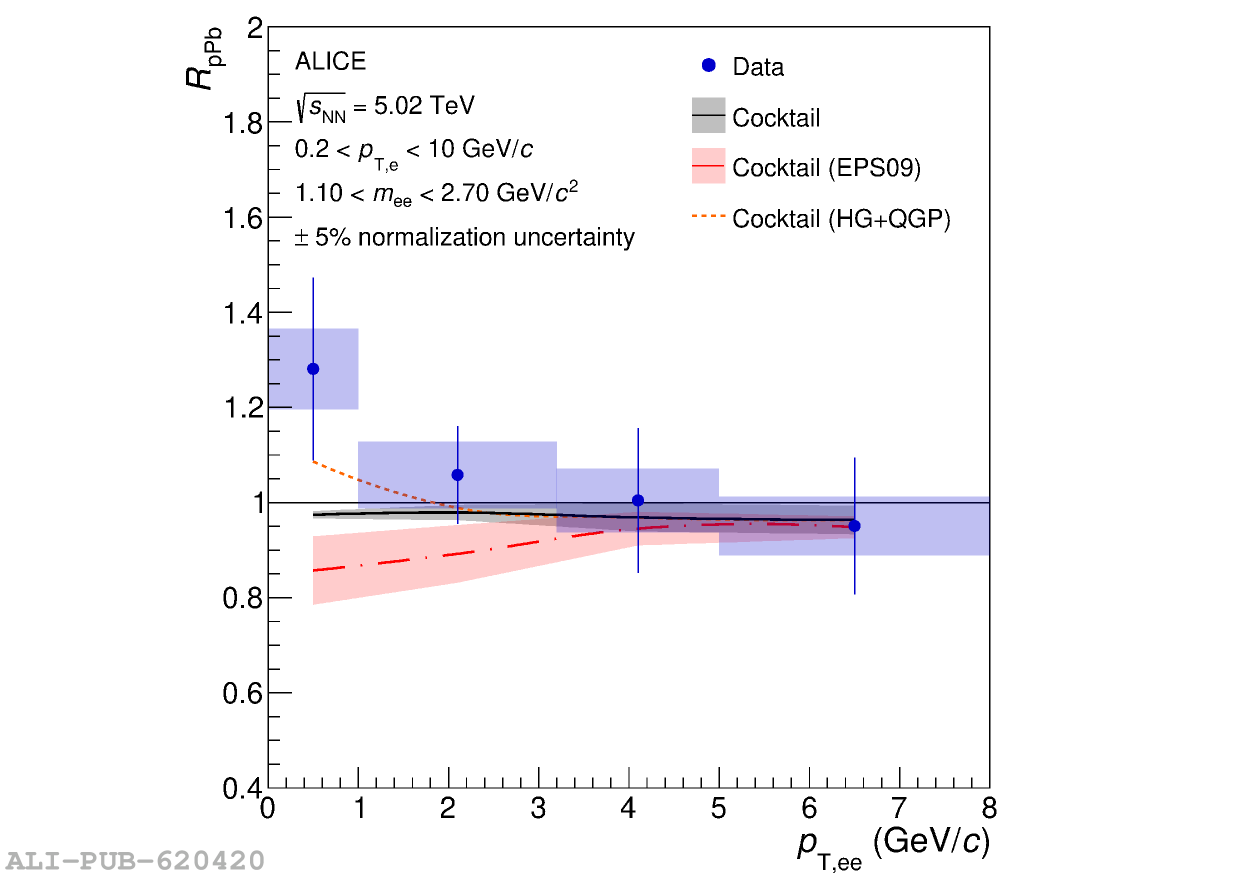 |