Invariant mass distributions for (top left) $\kzero$ (top right) $\lmb$ (bottom left) $\X$ and (bottom right) $\Om$ for the lowest transverse momentum intervals accessed by the analysis. The distributions for the most central (red full markers) and most peripheral (blue open markers) class of events are reported. The dashed lines illustrate the fits used for signal extraction. | 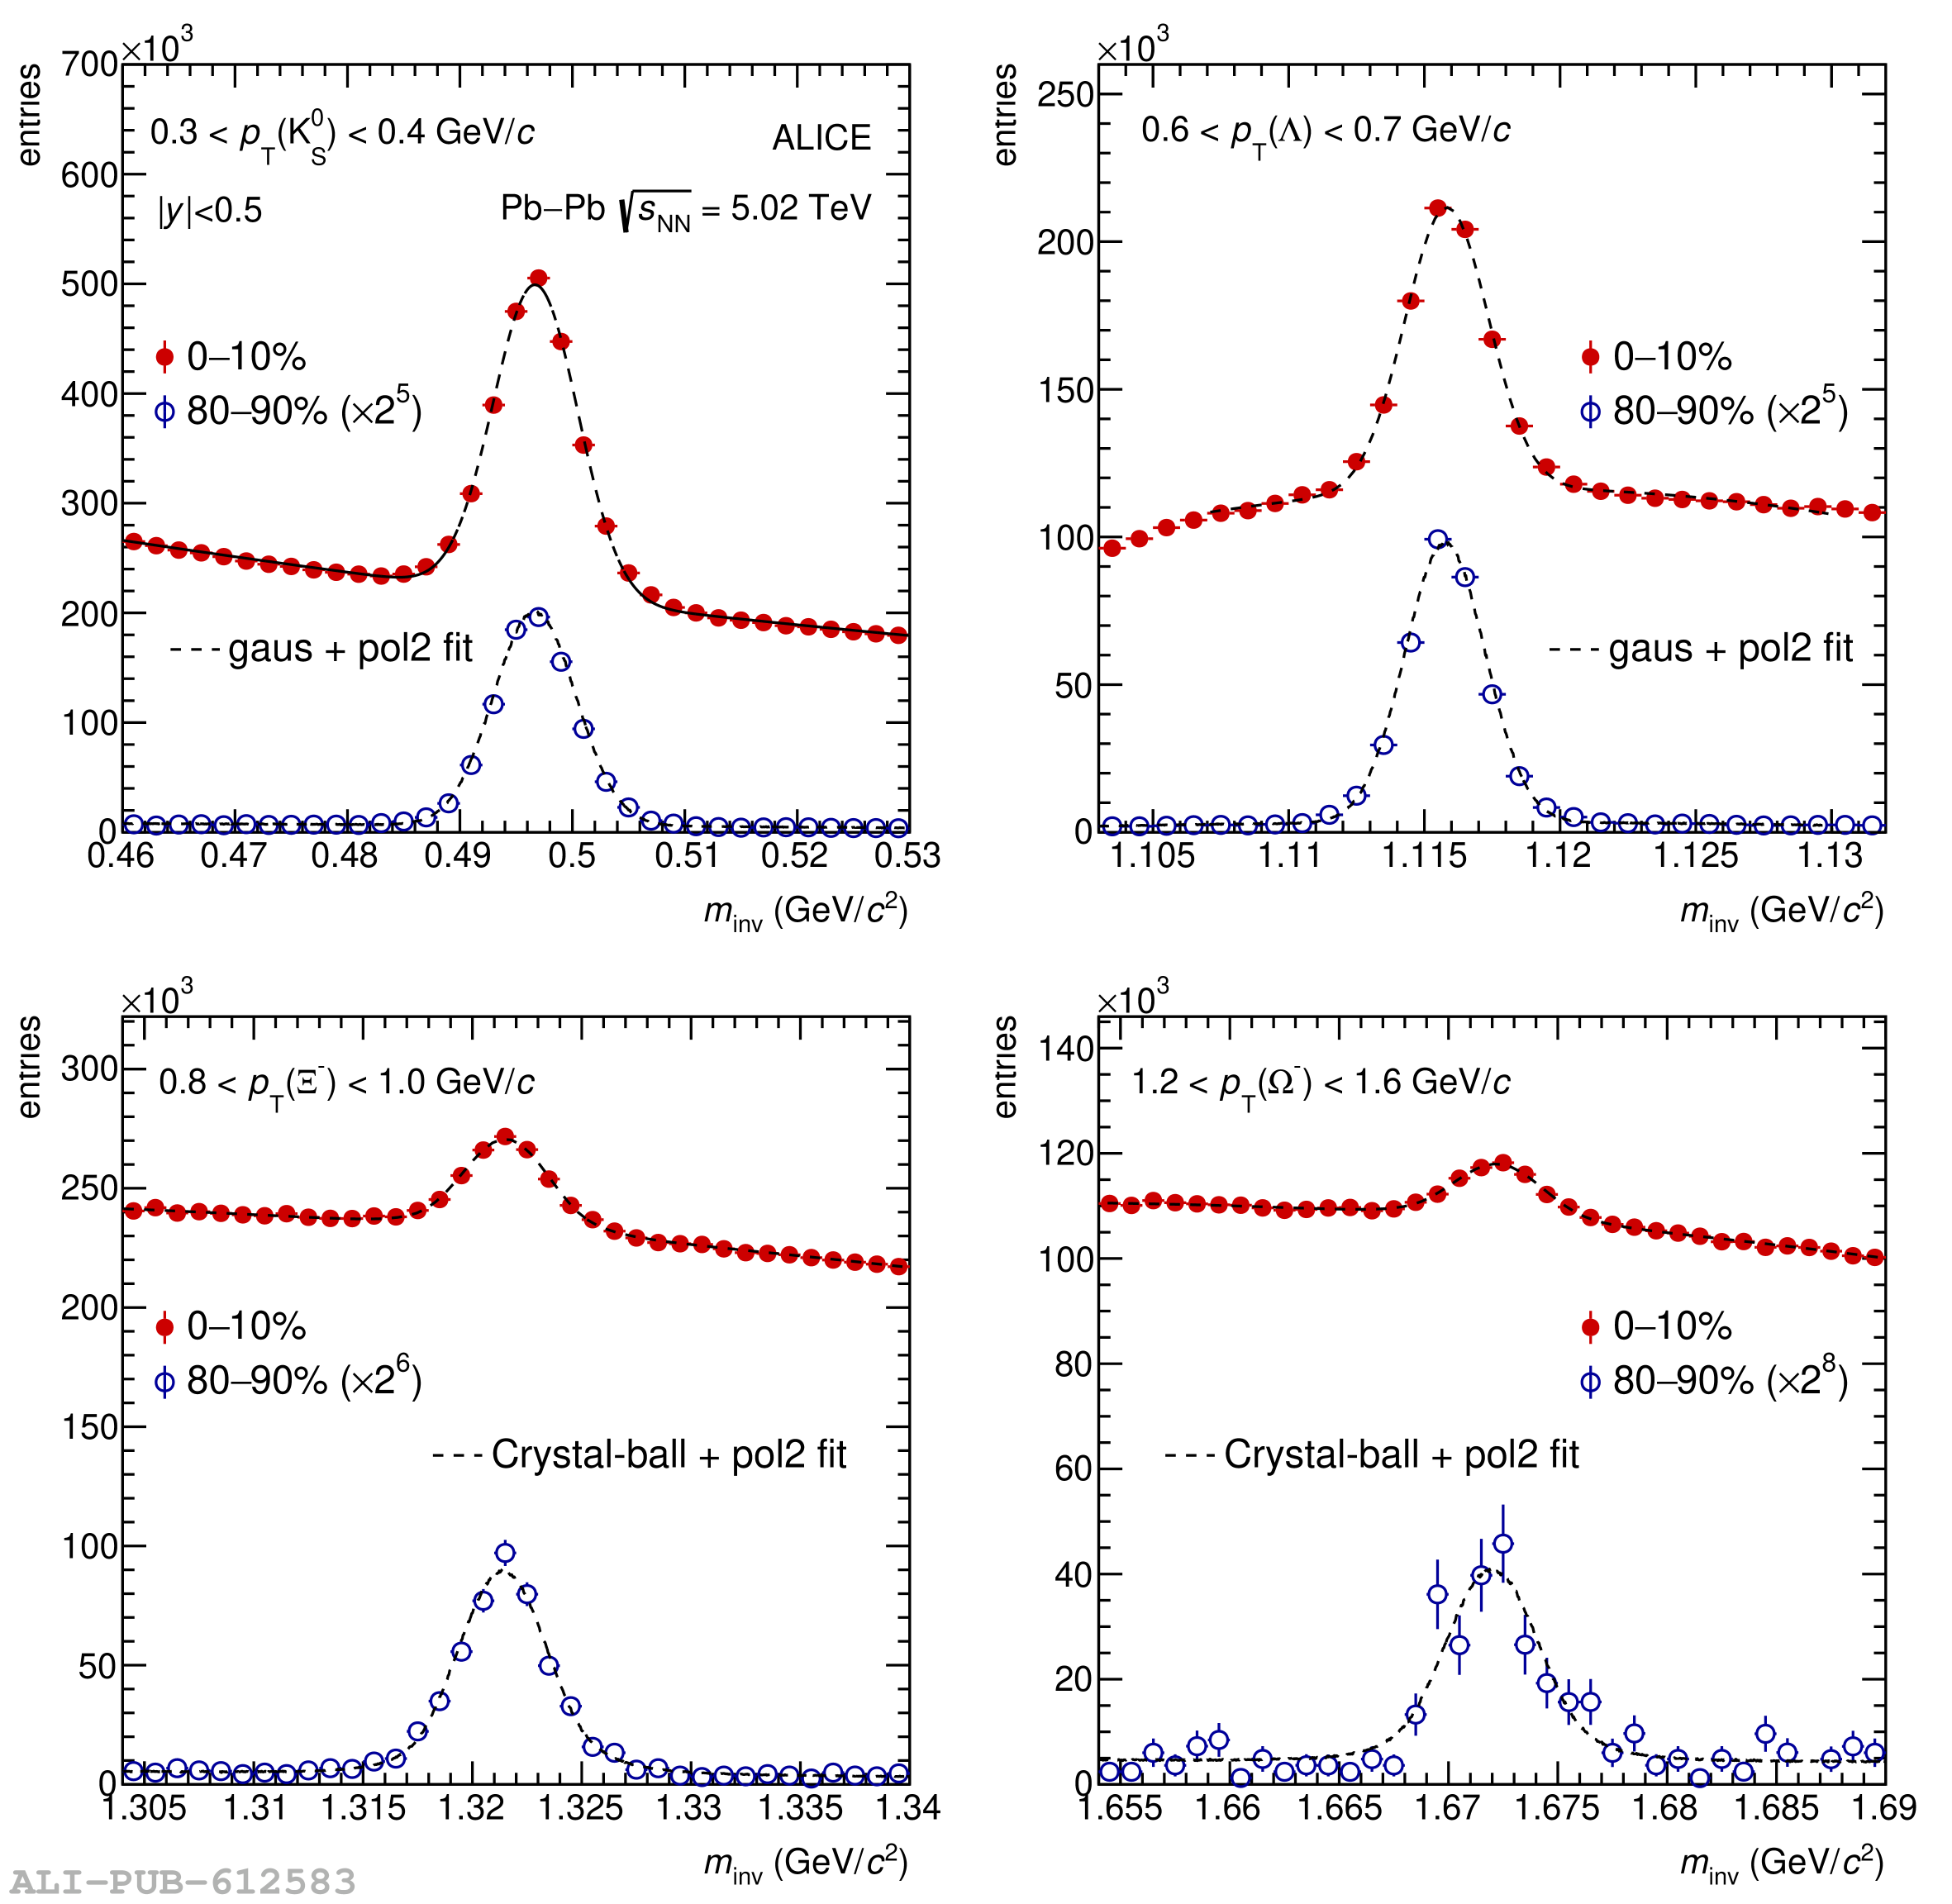 |