The centrality dependence of strange ($K_S^0$, $Λ+ \barΛ$) and multi-strange ($Ξ^- + \bar{Ξ^+}$, $Ω^- + \barΩ^+$) hadron production is measured by ALICE in the LHC lead-lead (Pb-Pb) collisions at a center-of-mass energy per nucleon pair $\sqrt{s_{\rm NN}} = 5.02$~TeV, using the full data set collected during the LHC Run 2 campaign in the years 2015 and 2018. This is the largest heavy-ion data set analyzed to date at the LHC, and it allows for the extraction of transverse momentum ($p_T$) spectra and $p_T$-integrated yields with unprecedented precision, over a broad range of charged particle multiplicity densities ($\langle dN_{ch}/dη\rangle_{|η|<~0.5}$), probing regions where smaller collision system (pp and p-Pb) results are also available. The $p_T$ spectra evolve with centrality, featuring higher $\langle p_T \rangle$ in central events for all particles. The $Λ/K_S^0$ ratio exhibits the distinctive baryon-to-meson enhancement in the intermediate $p_T$ region, with a maximum which is shifted to larger $p_T$ for more central collisions. The hadron-to-pion yield ratios are presented as a function of $\langle dN_{ch}/dη\rangle_{|η|<~0.5}$ and compared to results from different collision systems and energies. A smooth connection from pp to Pb-Pb is observed, thus demonstrating that collision system or energy do not play a role in the multiplicity evolution of this observable. The previously reported enhancement of strangeness production in the multiplicity range probed in pp and p_Pb collisions saturates in the multiplicity range of Pb-Pb data. These results constitute a key test bench for theoretical models and a first comparison to the EPOS~4 generator is presented.
Submitted to: PRC
HEP Data
e-Print: arXiv:2511.10360 | PDF | inSPIRE
CERN-EP-2025-254
Figure group
Figure 1
Invariant mass distributions for (top left) $\kzero$ (top right) $\lmb$ (bottom left) $\X$ and (bottom right) $\Om$ for the lowest transverse momentum intervals accessed by the analysis. The distributions for the most central (red full markers) and most peripheral (blue open markers) class of events are reported. The dashed lines illustrate the fits used for signal extraction. | 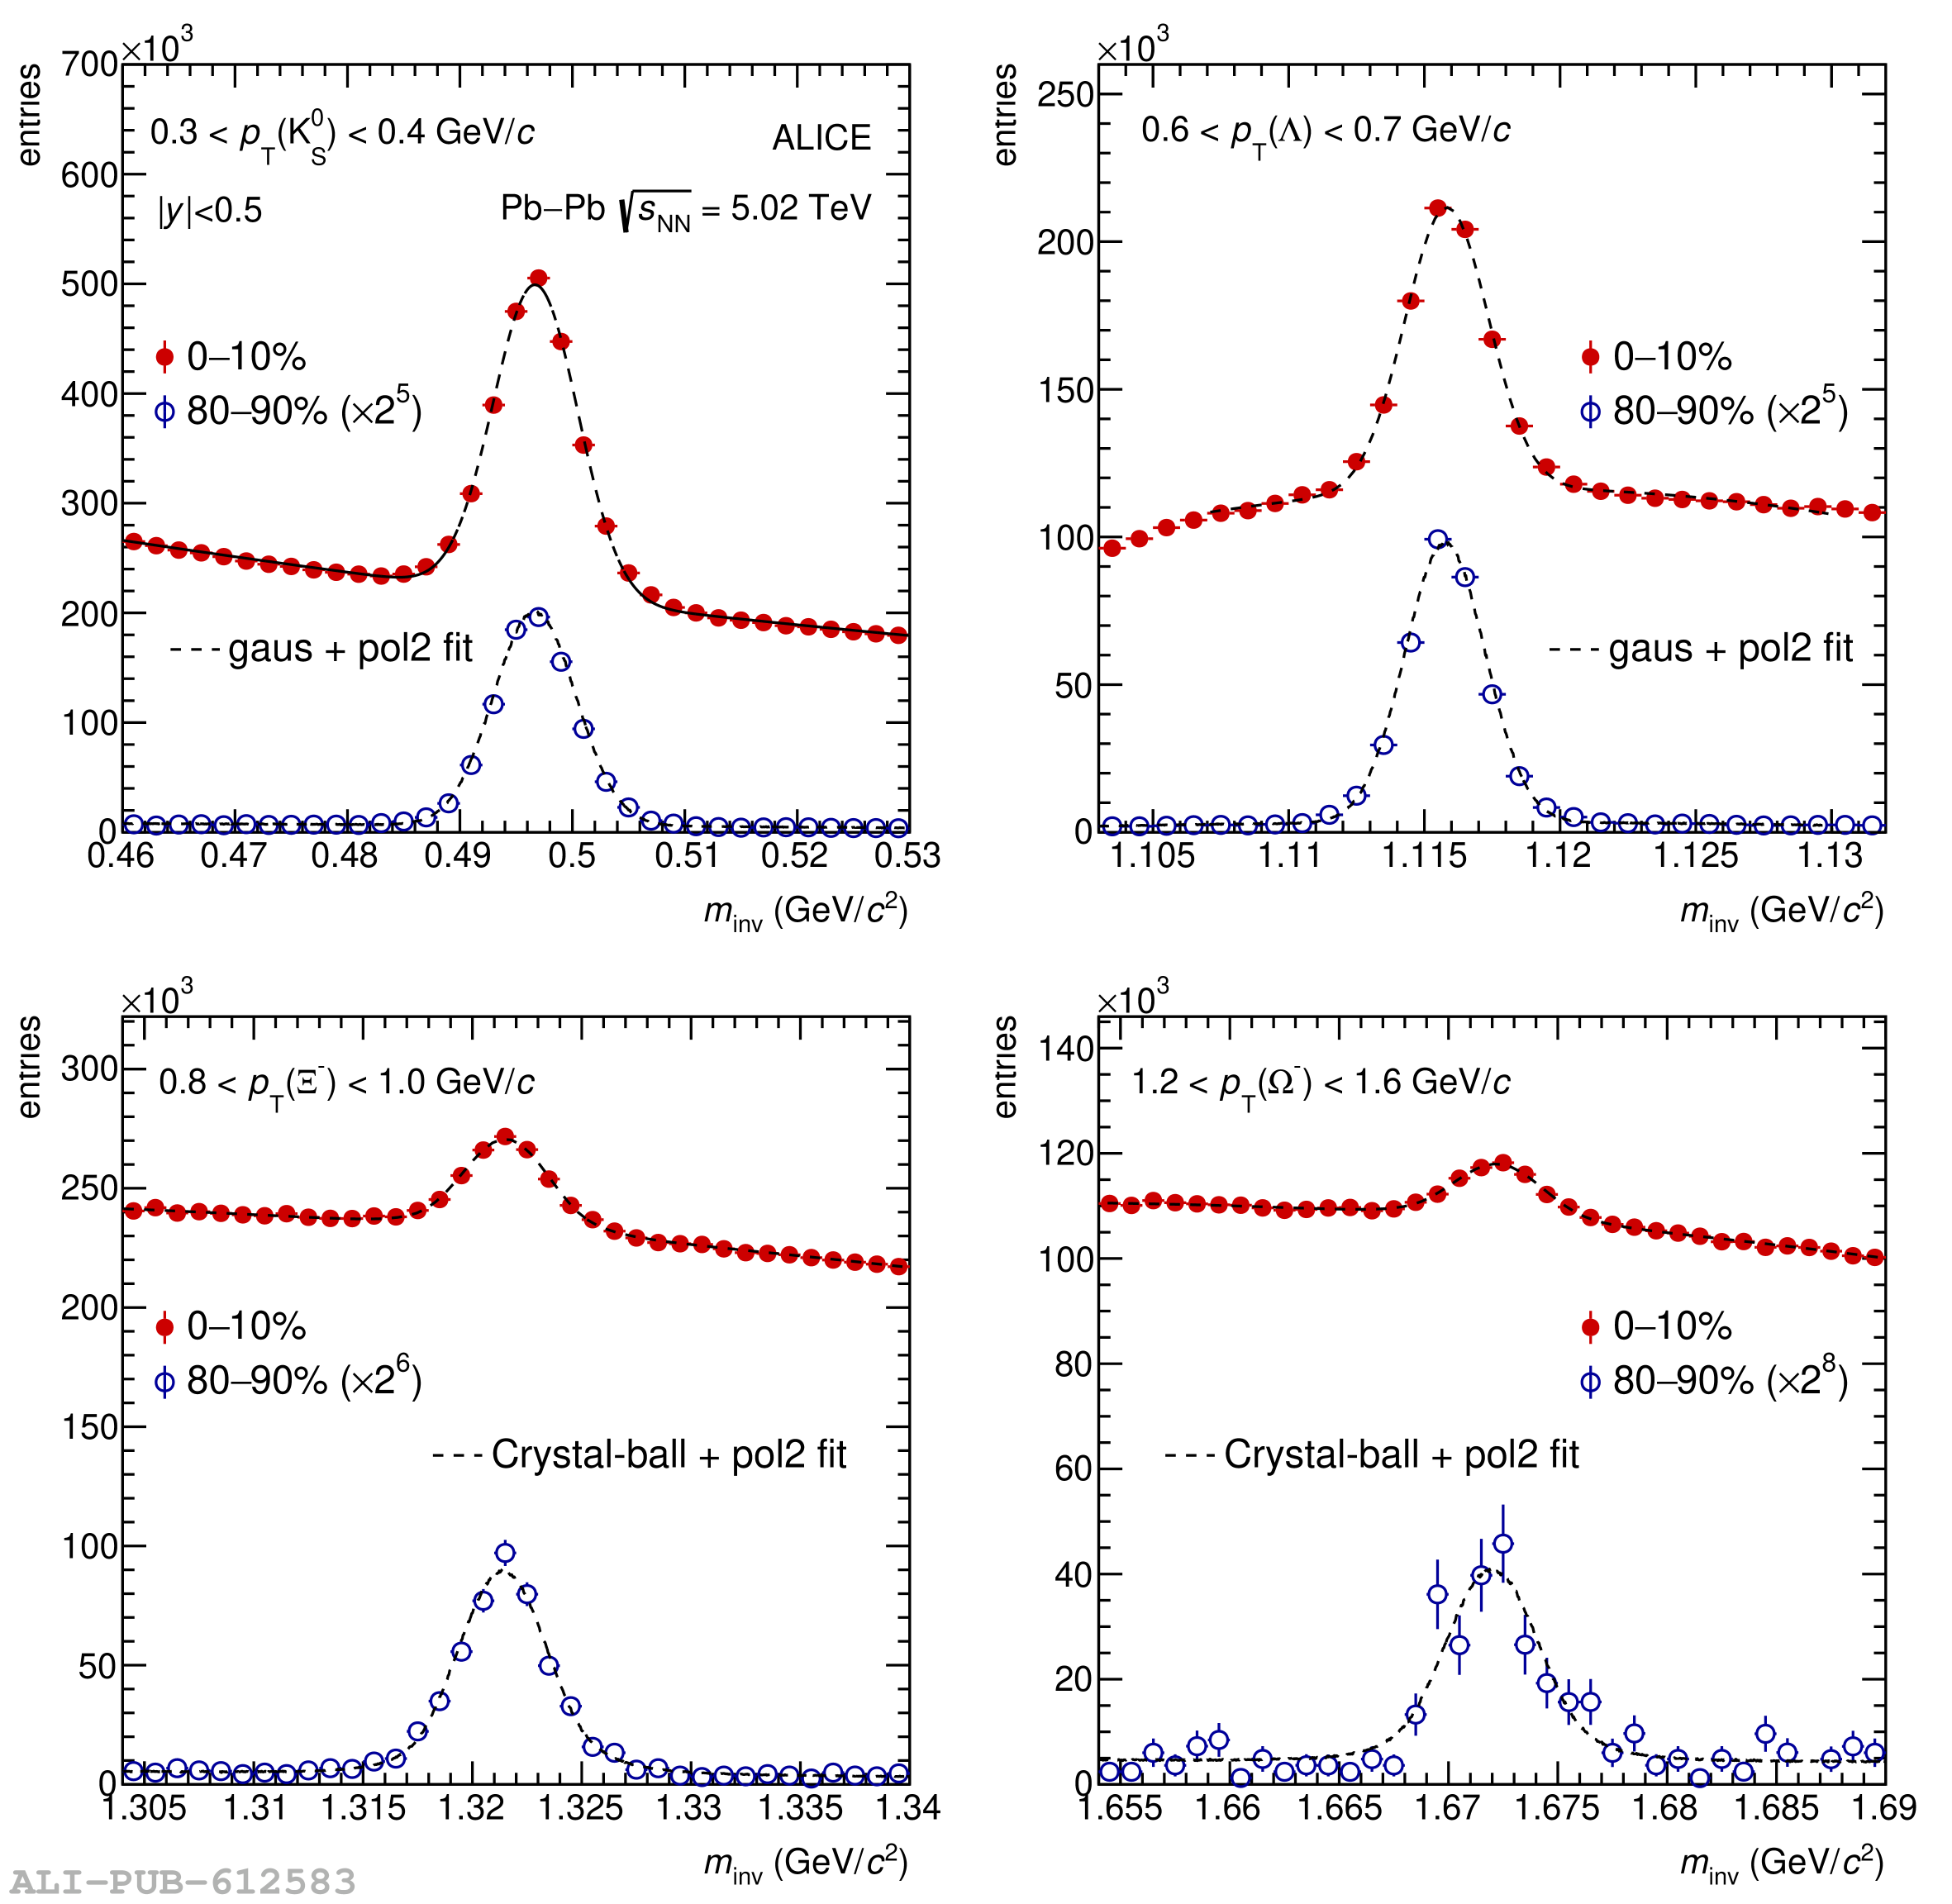 |
Figure 2
(left) Acceptance times efficiency (\acceff) as a function of \pt for the reconstruction of \kzero, \lmb, \X, \Om (full markers) and respective antiparticles (open markers). The 0--90\% centrality class is displayed. (right) Ratio of \lmb coming from charged and neutral \Xit baryon decays to the inclusive \lmb yield as a function of \pt. Full and hollow markers are for matter and antimatter, respectively. The 0--90\% centrality class is displayed. | 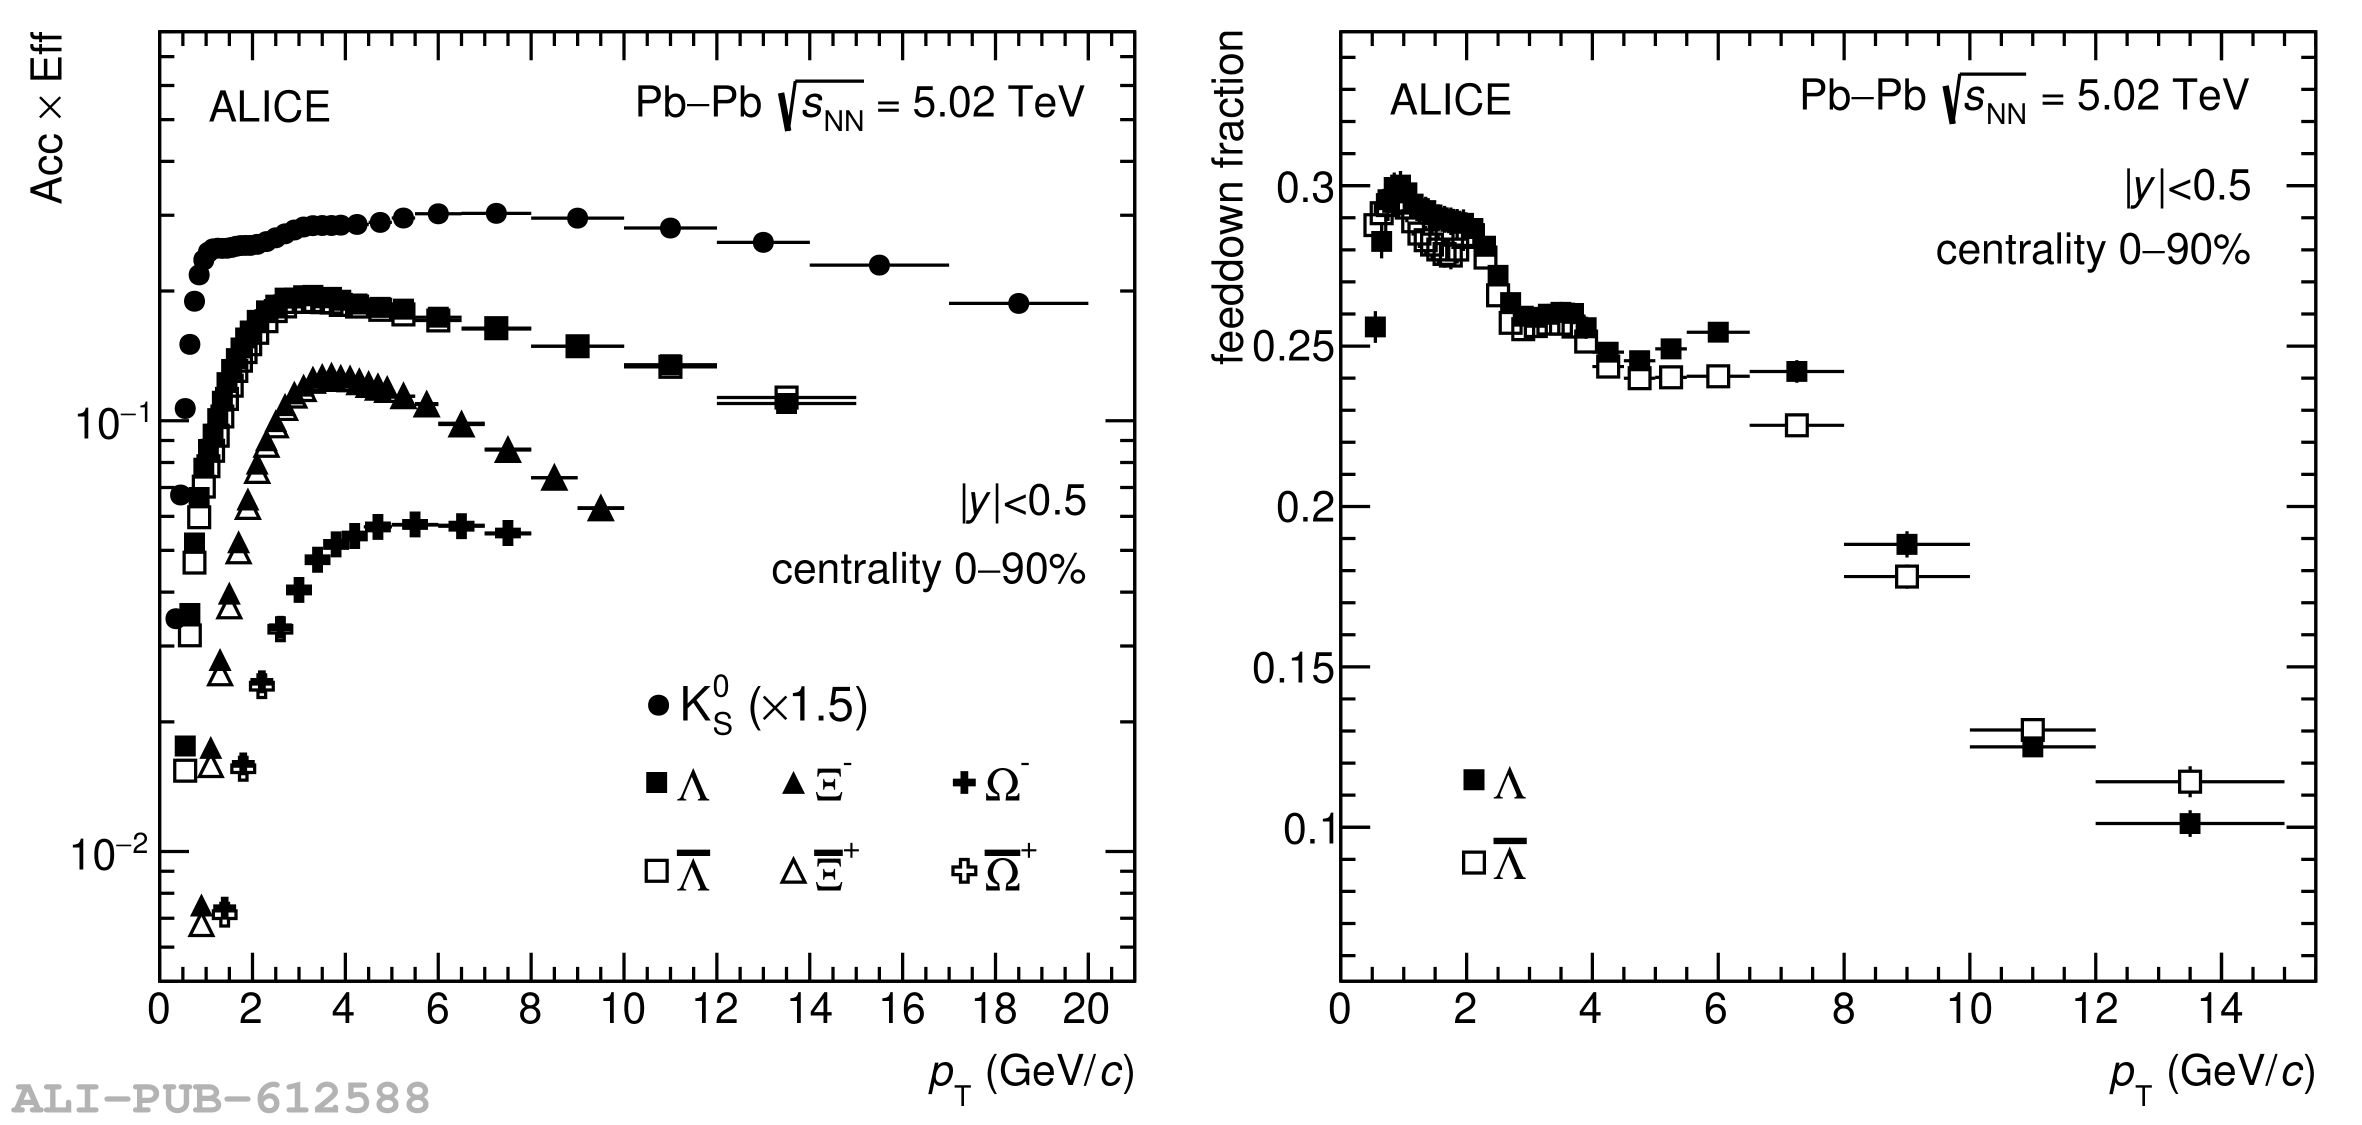 |
Figure 3
\kzero, \lmb, \Xit, and \Omt transverse momentum spectra in \PbPb collisions at \fivenn for different event centrality intervals. Error bars show the statistical uncertainty, while boxes represent the total systematic uncertainty. For each centrality class, predictions from the \epf model are reported as solid lines, with the corresponding transparent area accounting for the statistical uncertainty on the model. Scale factors are applied to both the results and the model to improve visibility. | 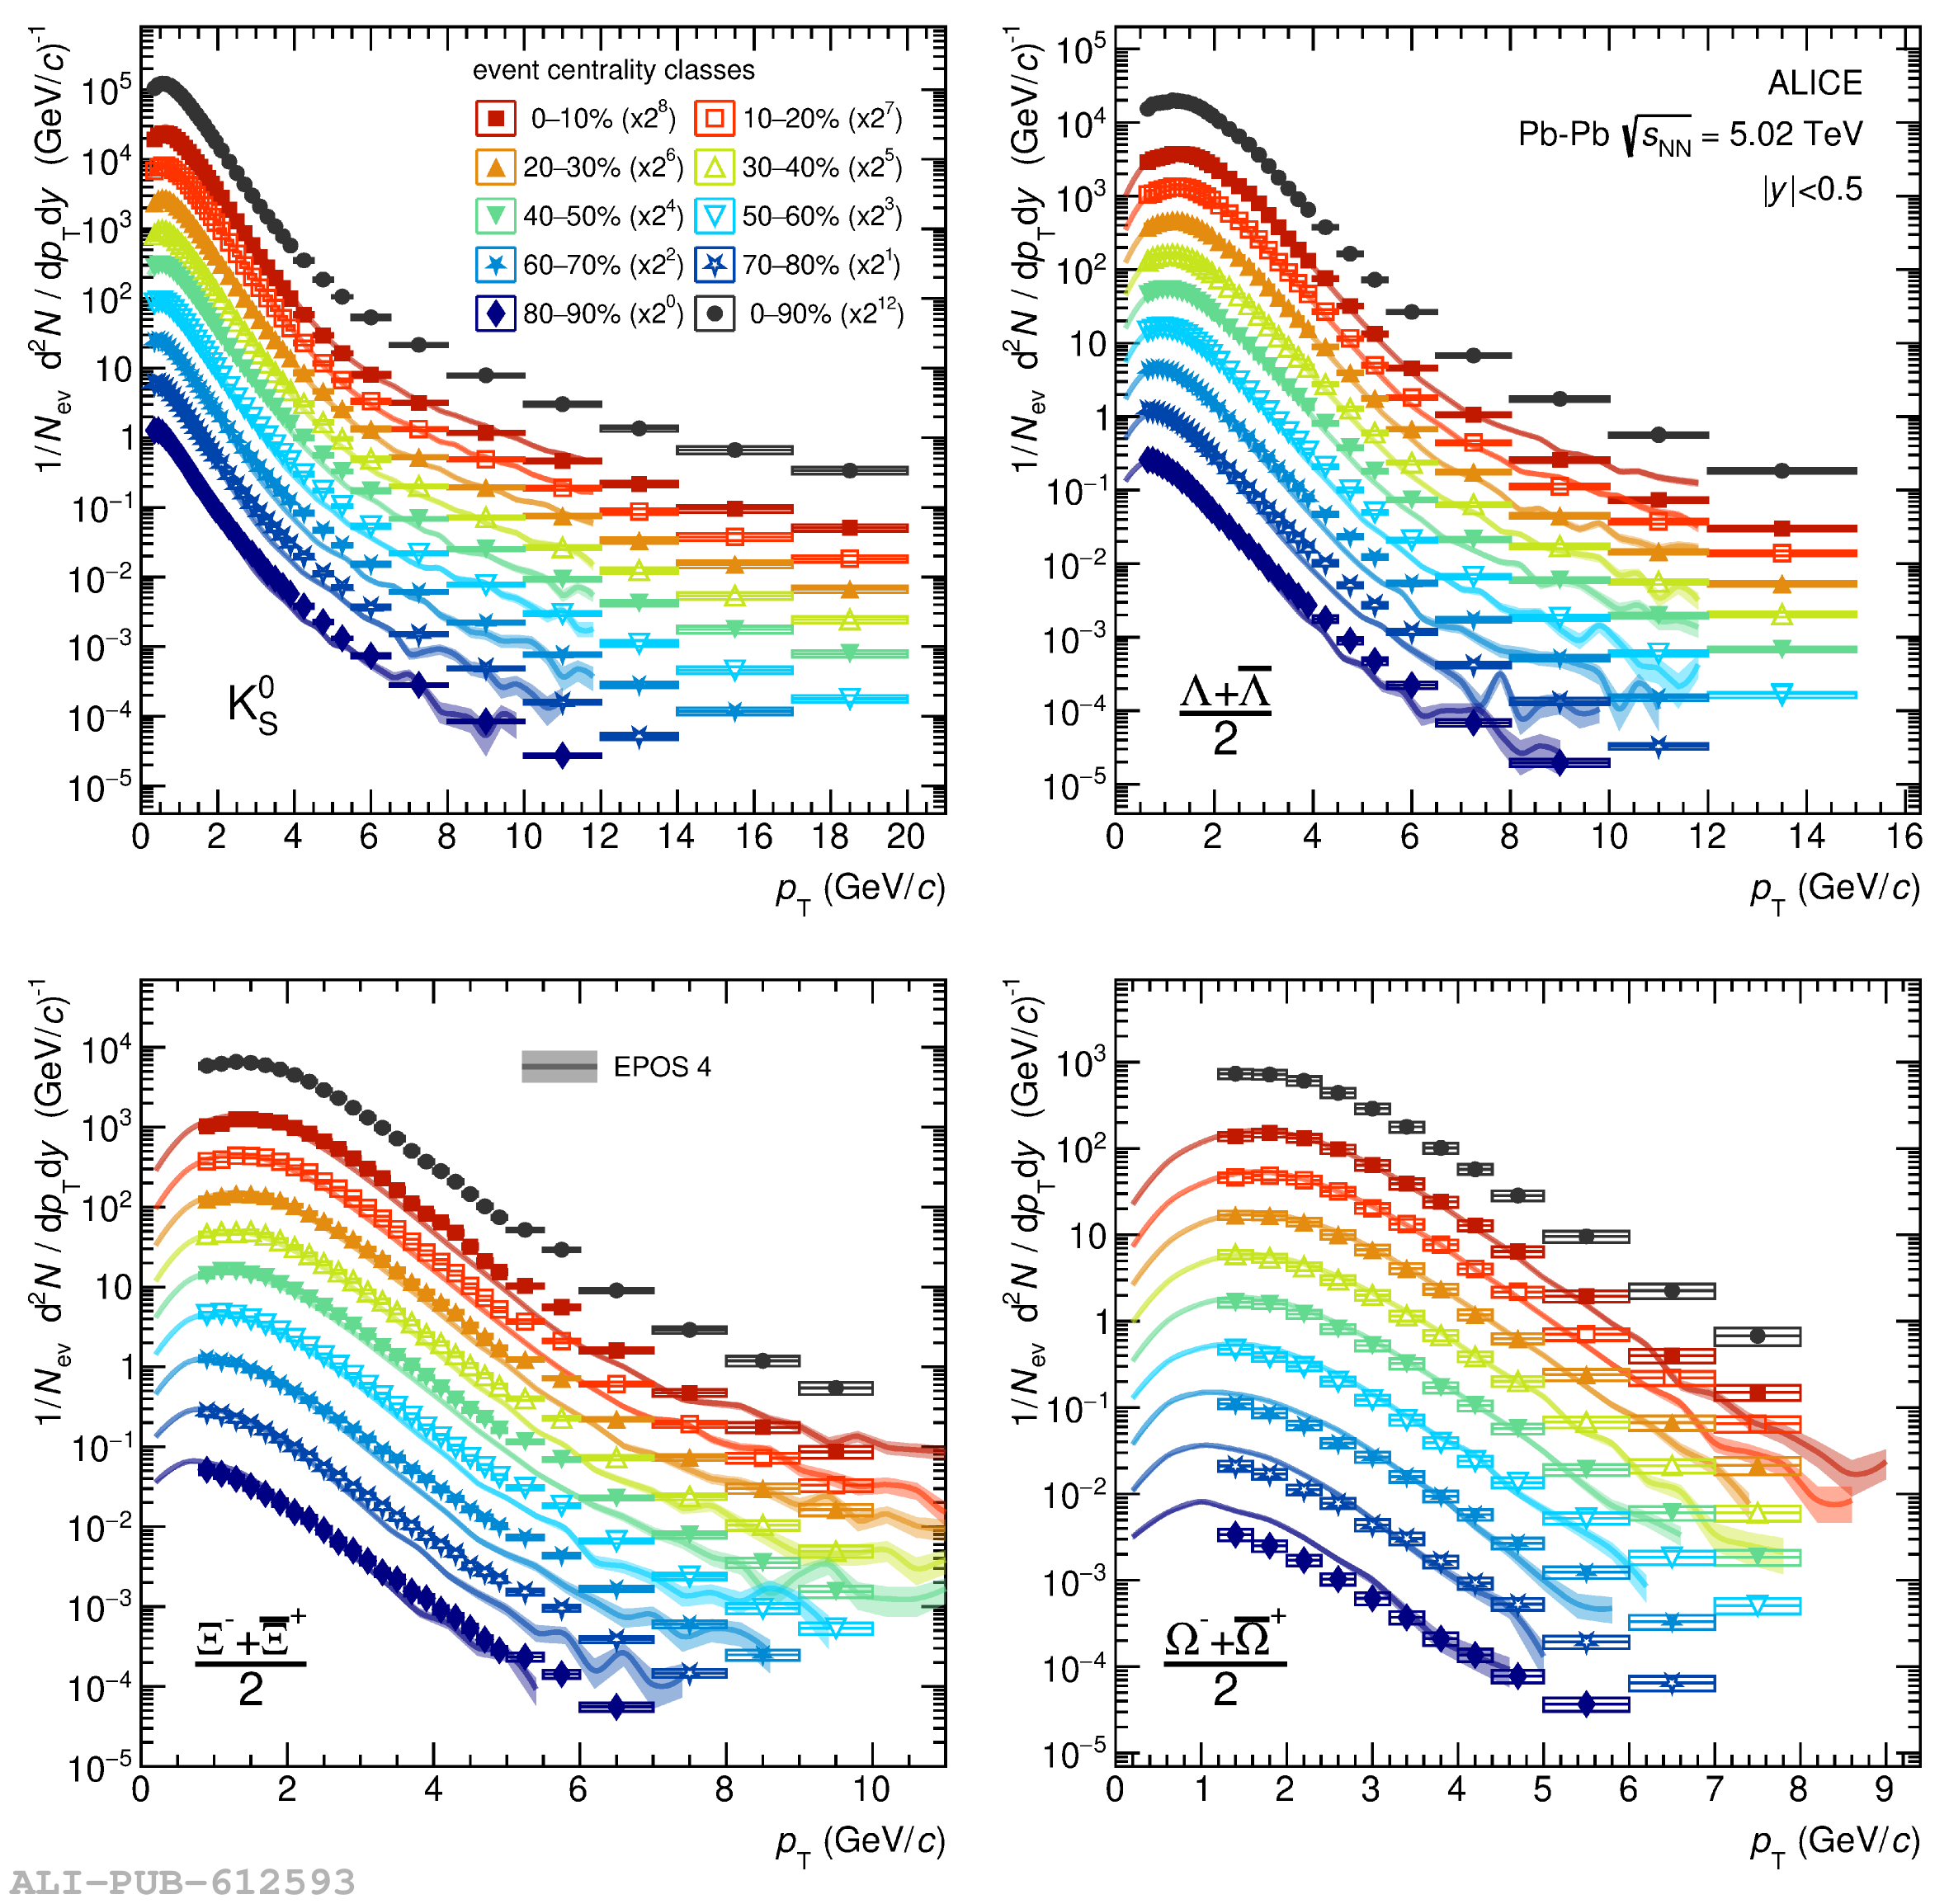 |
Figure 4
(left) \meanpt as a function of \avdndeta for \kzero, \lmb, \Xit, and \Omt particle production in \PbPb collisions at \fivenn at midrapidity (square markers). Results from \pp and \pPb collisions at the same center-of-mass energy are also reported as circles and open diamonds, respectively. Error bars correspond to the statistical uncertainty, while boxes correspond to the total systematic uncertainty. Solid lines are predictions from the \epf model. (right) \lmb/\kzero ratio as a function of \pt for the 0--10\% most central (red), 40--50\% intermediate (green) and 80--90\% most peripheral (blue) centrality classes. Error bars correspond to the statistical uncertainty, while boxes correspond to the total systematic uncertainty. \epf predictions, scaled to the total particle yields in the corresponding centrality class, are reported as solid lines. | 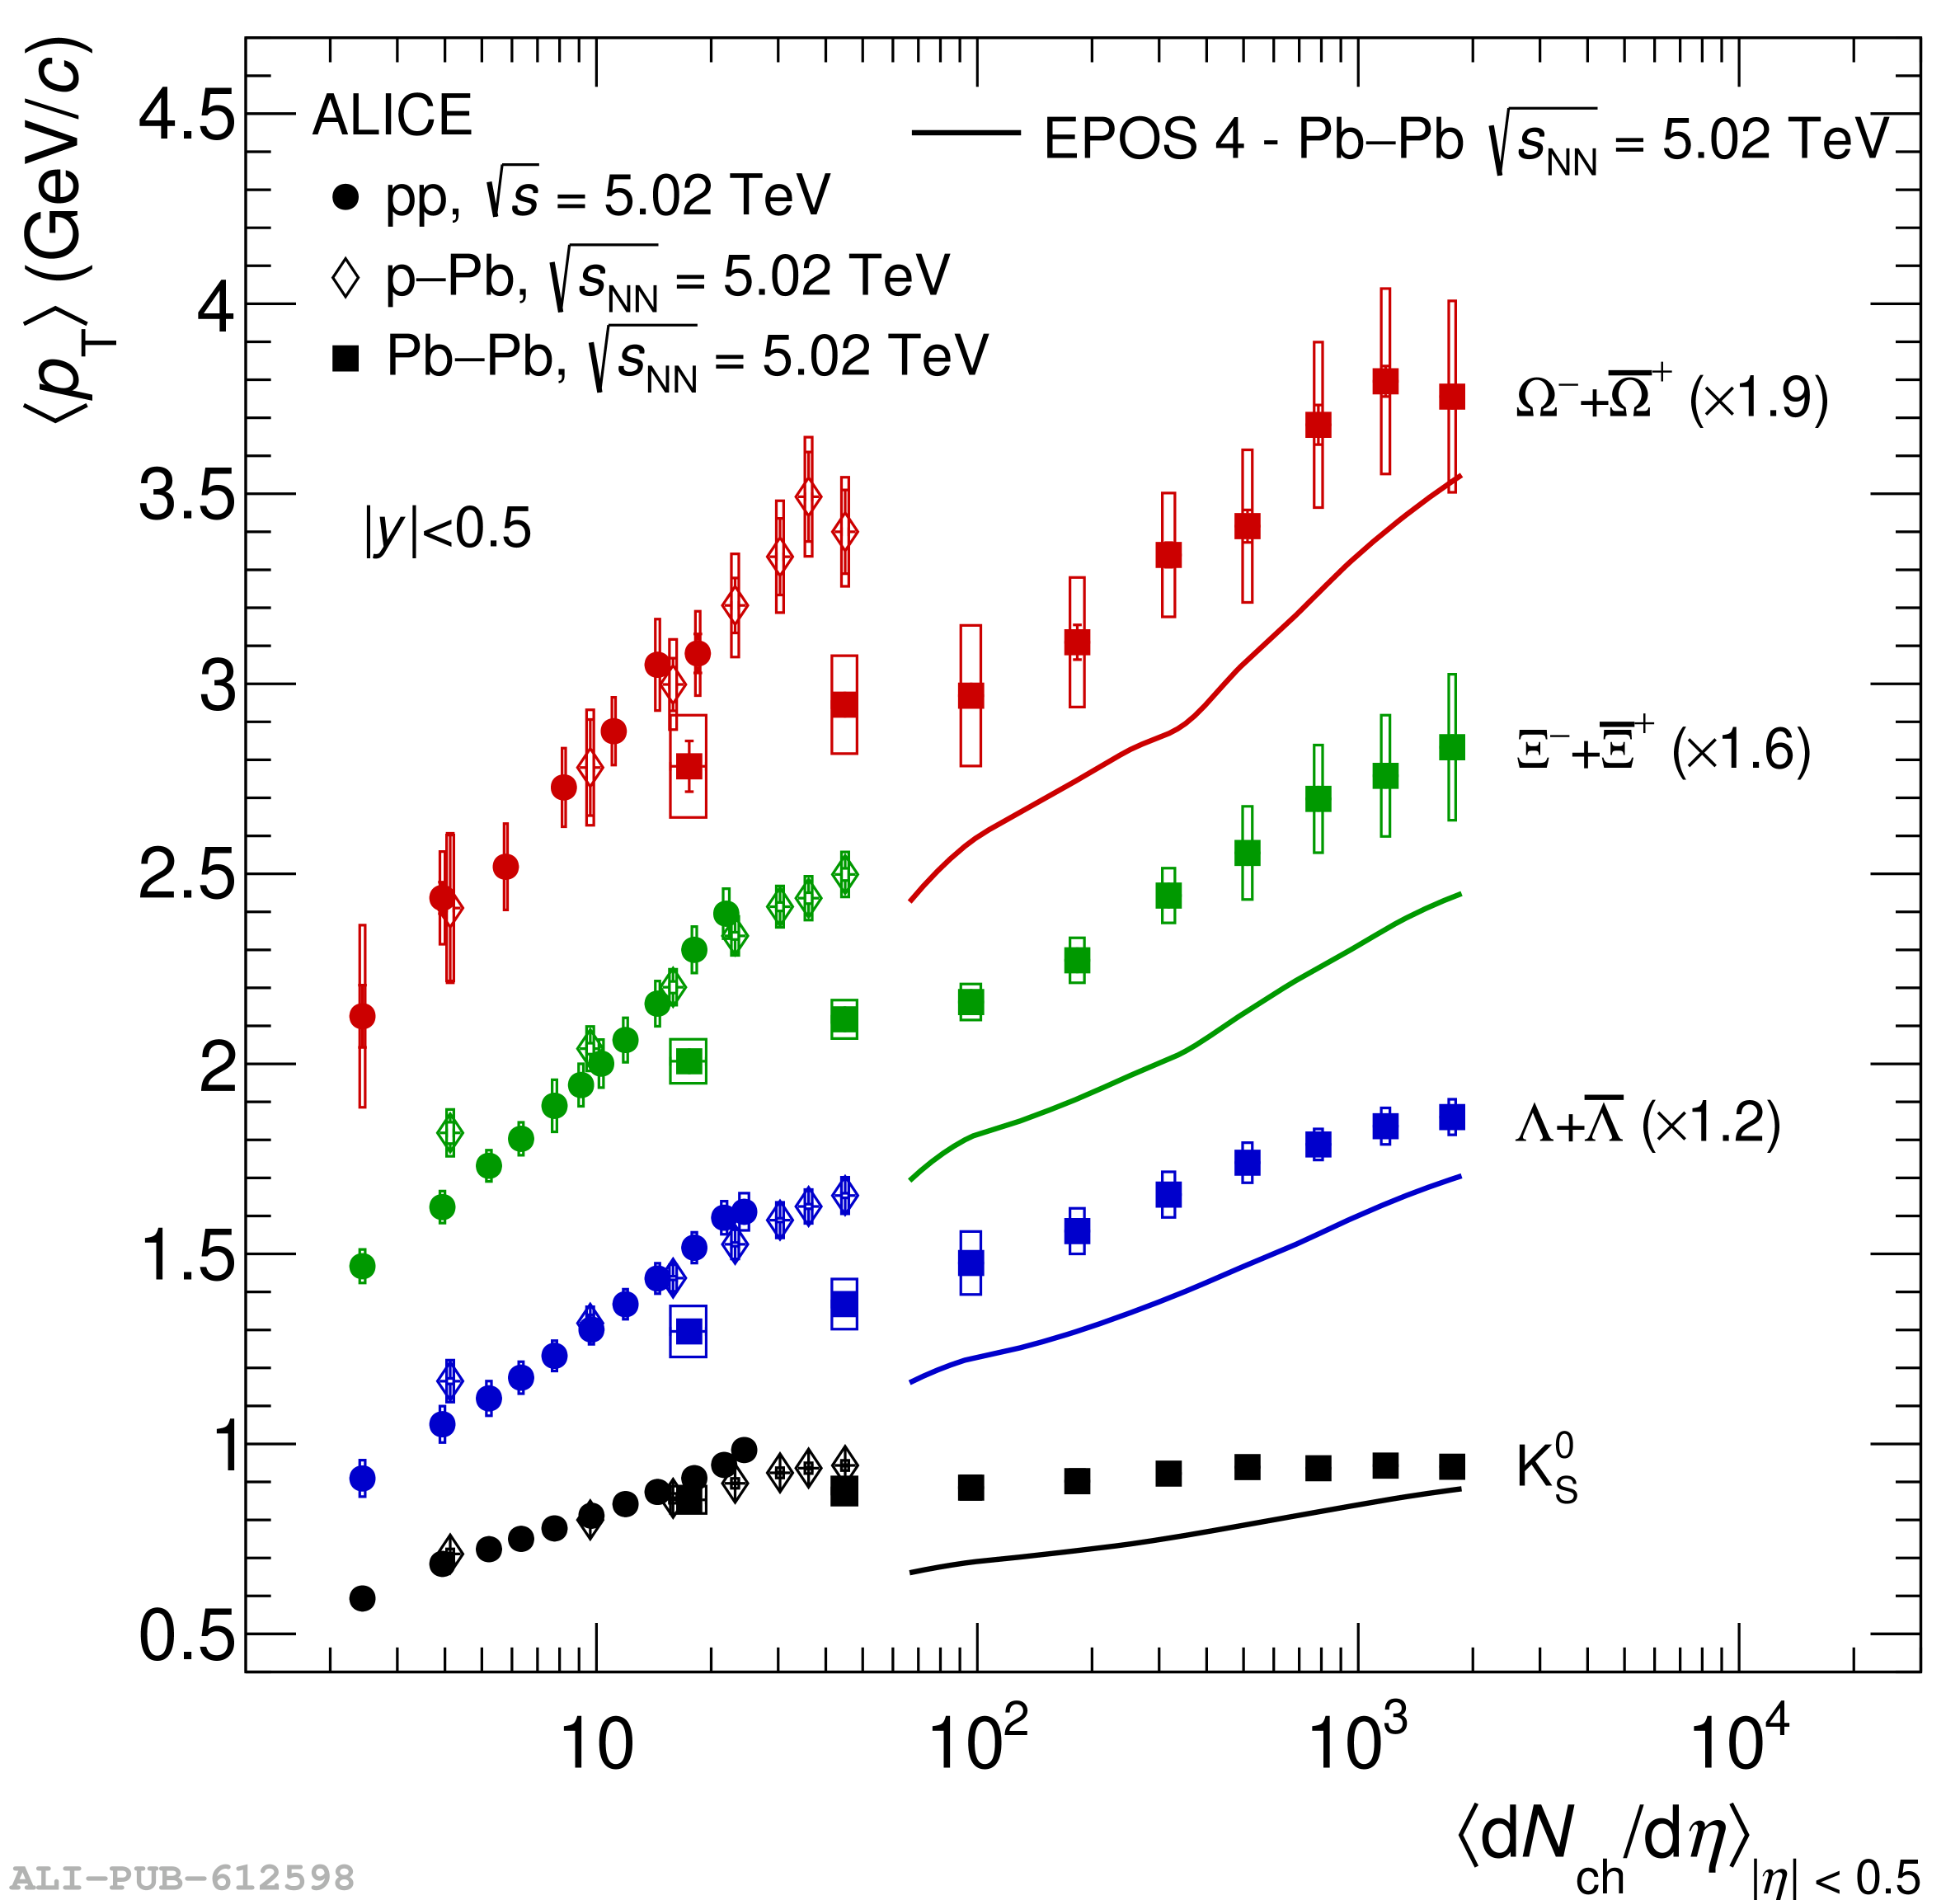 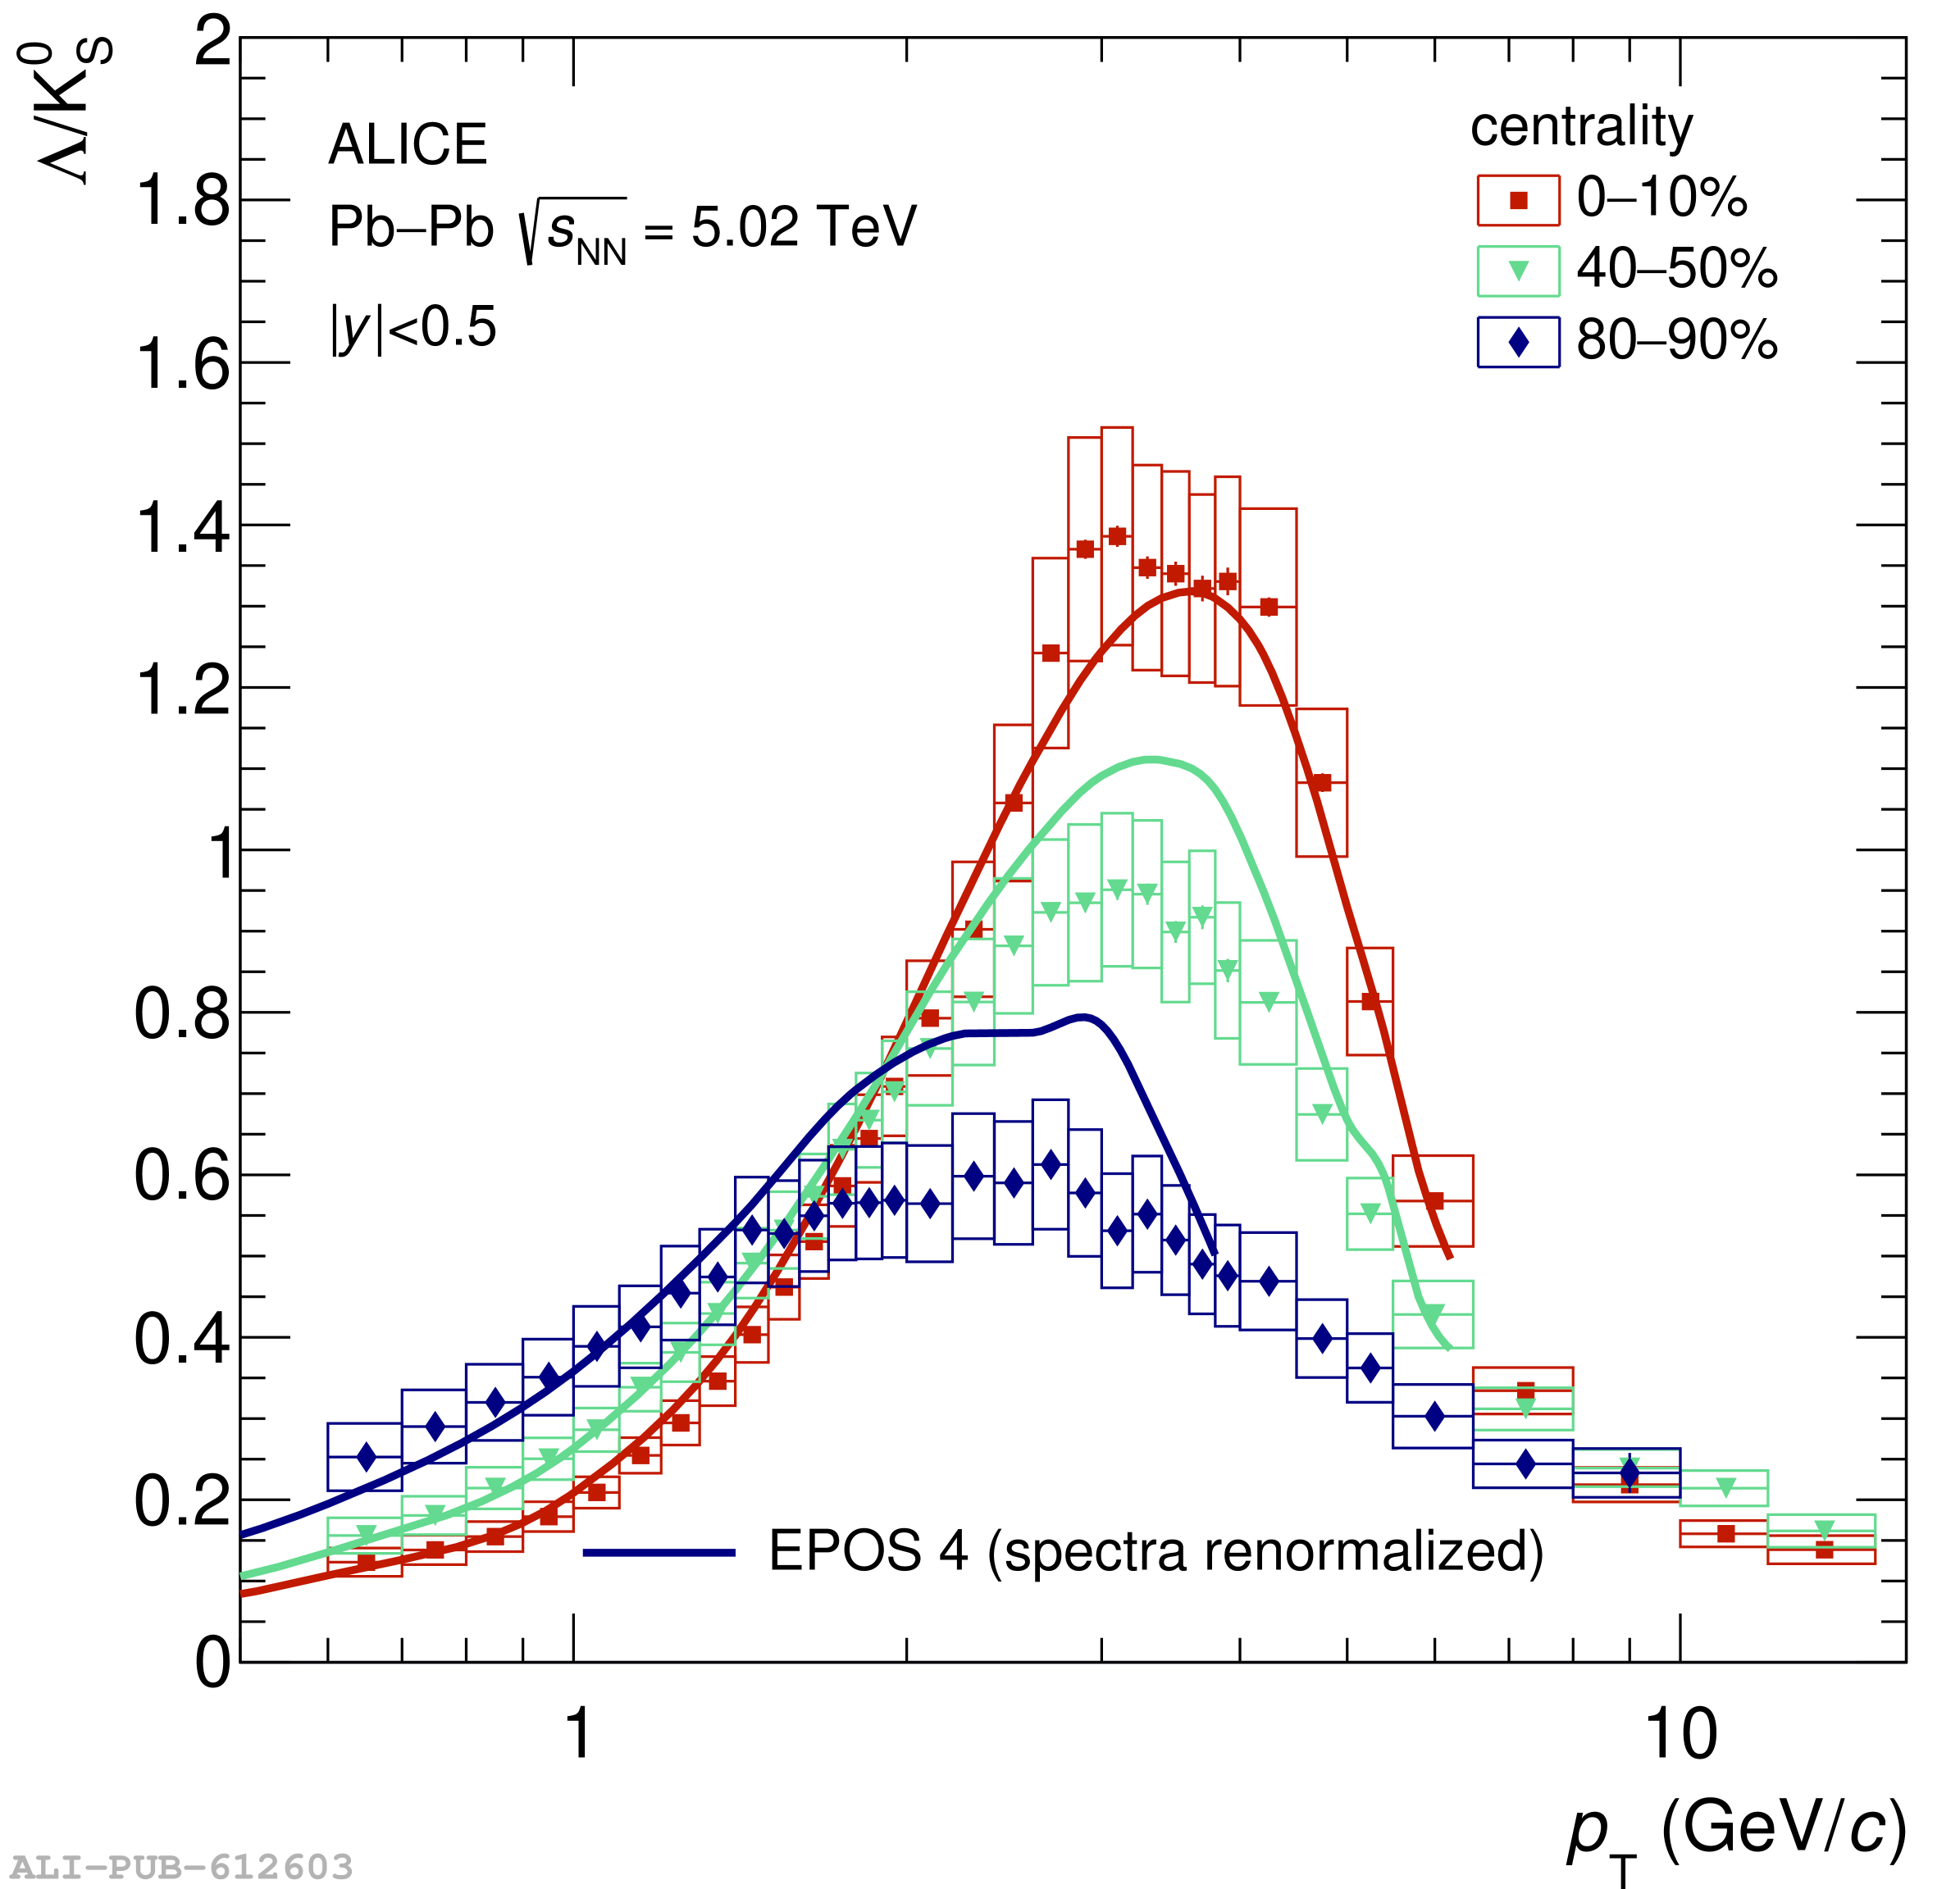 |
Figure 5
\kzero, \Lamboth, \Xiboth, and \Omboth particle yield ratios to the pion yield in \PbPb collisions at \fivenn (squares), compared to results in \pp collisions at \seven and \thirteen (hollow and full circles, respectively), in \pPb collisions at \five (hollow diamonds), and in \PbPb collisions at \twosevensixnn (stars). Error bars show the statistical uncertainty, while boxes represent the total systematic uncertainty. \epf predictions are reported for the top \PbPb energy as solid lines. | 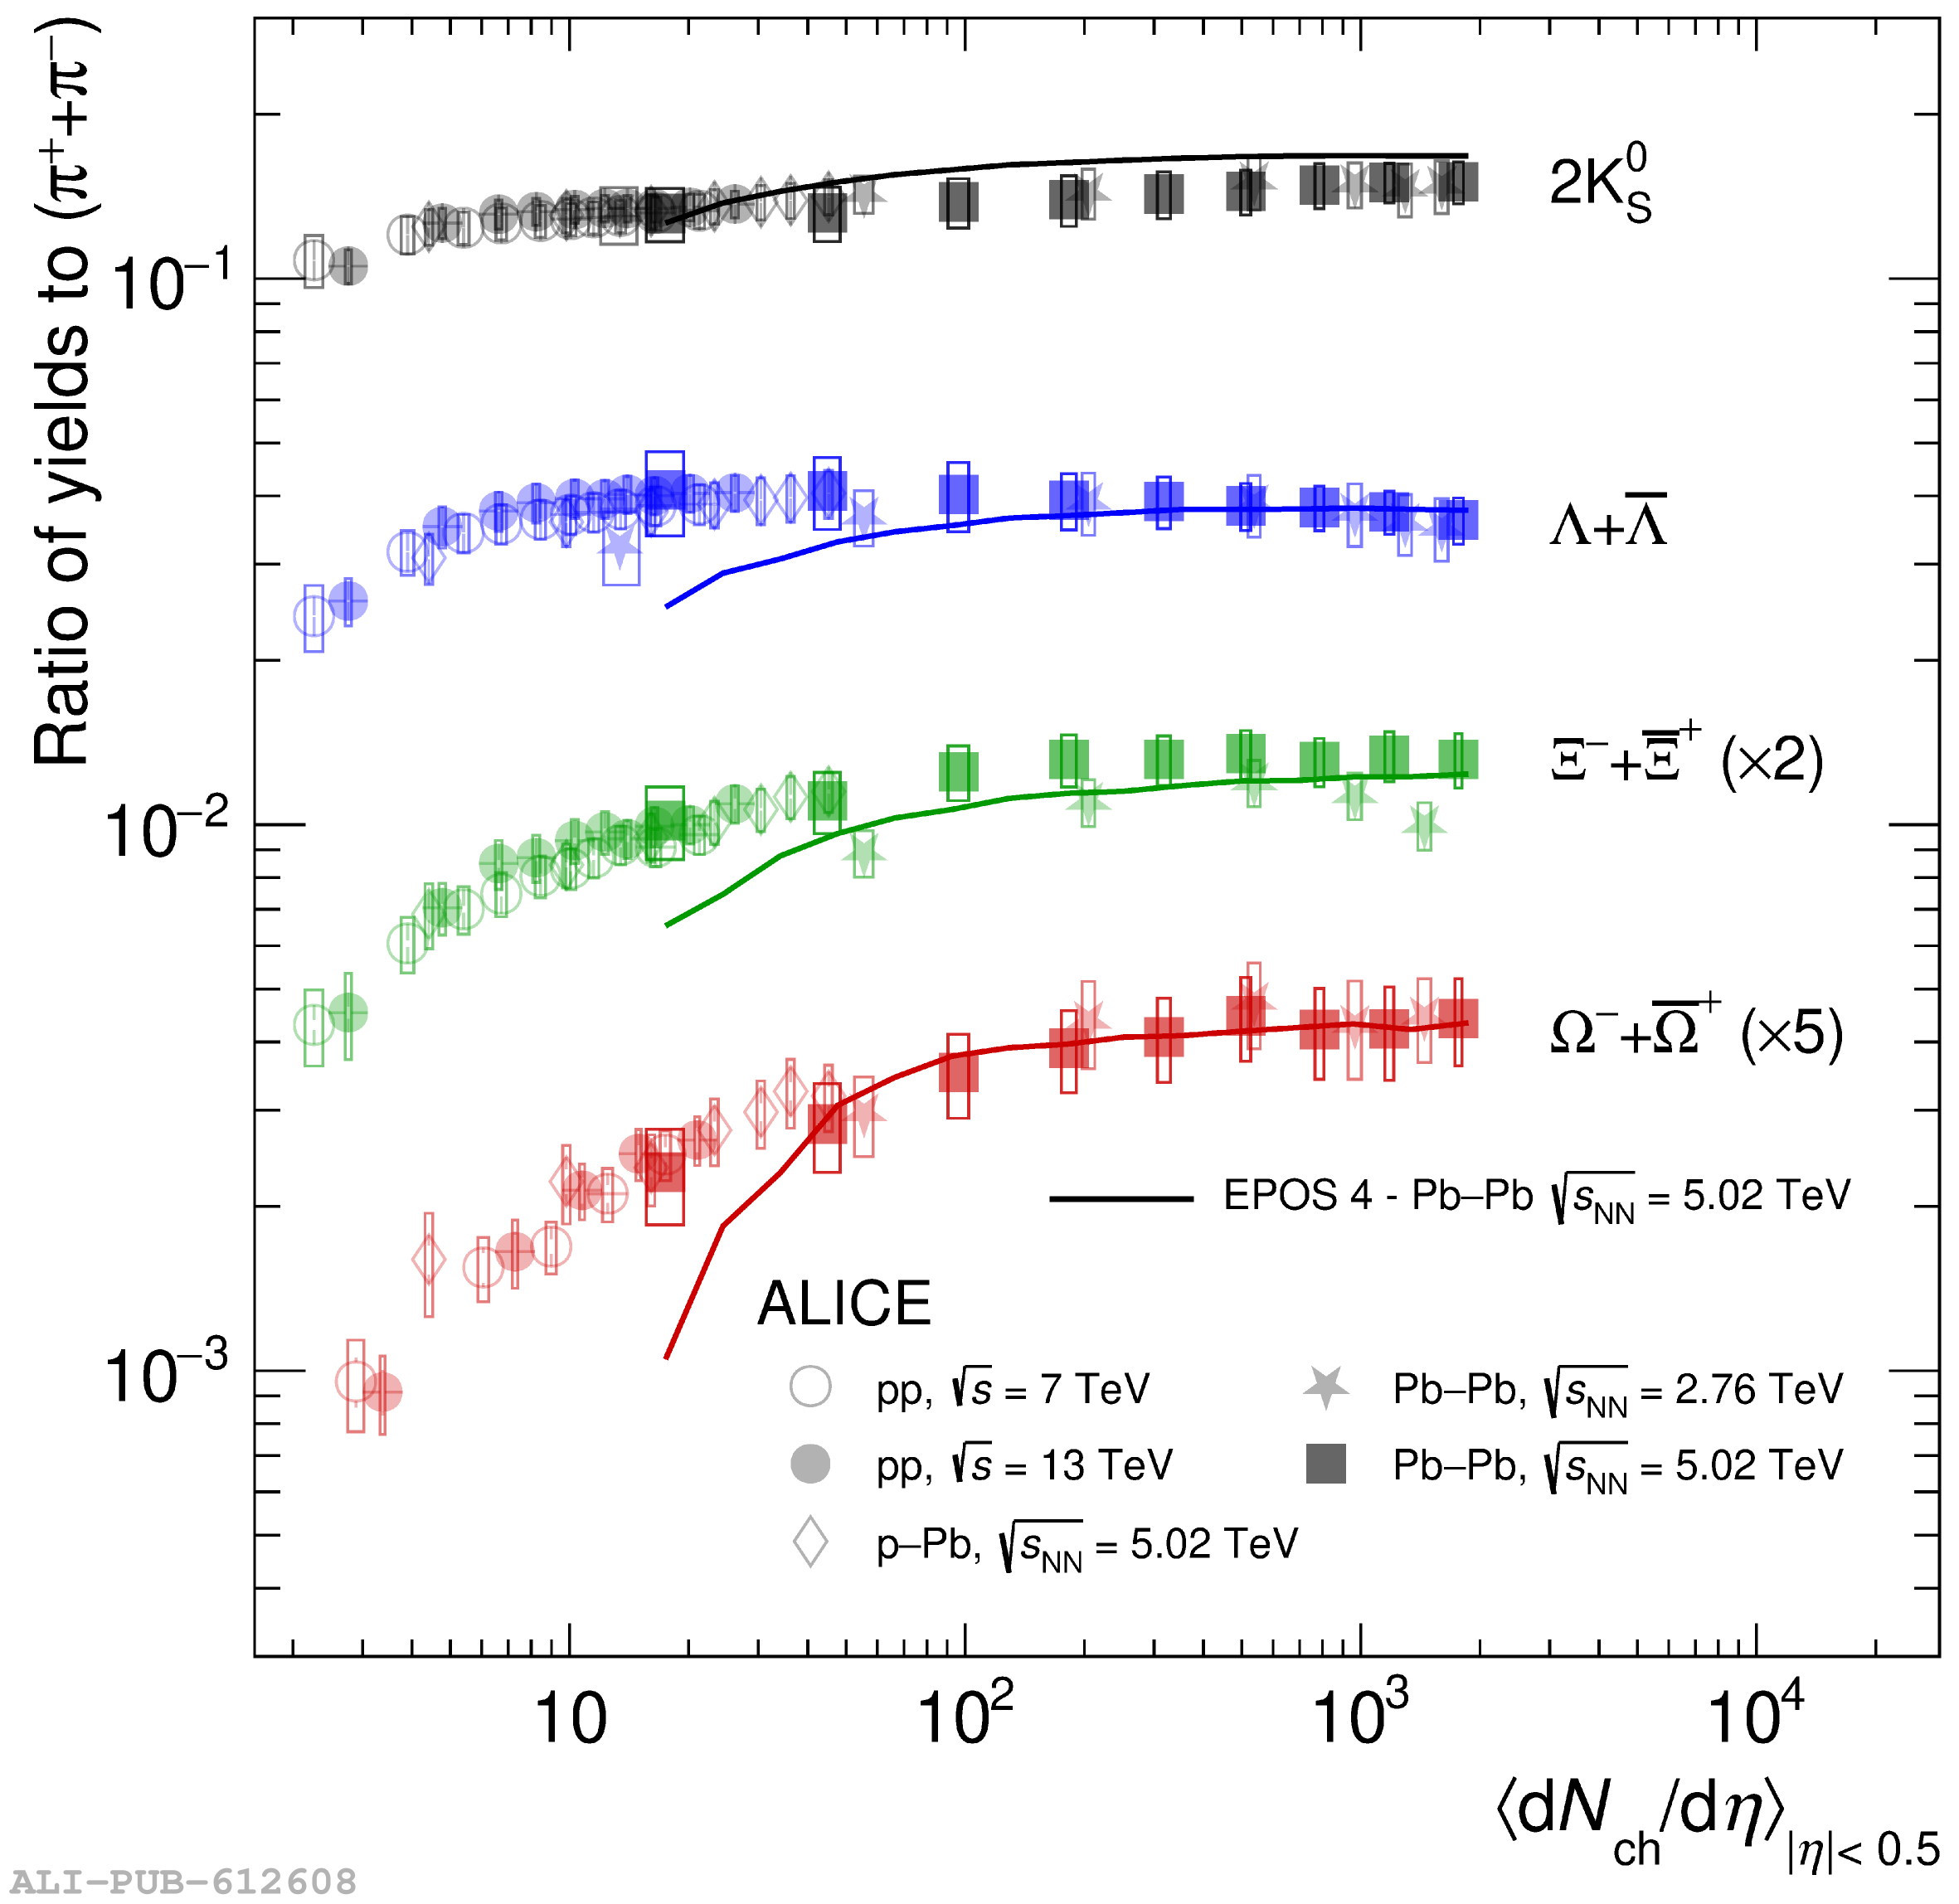 |