Mid-rapidity production of $\pi^{\pm}$, $\rm{K}^{\pm}$ and ($\bar{\rm{p}}$)p measured by the ALICE experiment at the LHC, in Pb-Pb and inelastic pp collisions at $\sqrt{s_{\rm{NN}}}$ = 5.02 TeV, is presented. The invariant yields are measured over a wide transverse momentum ($p_{\rm{T}}$) range from hundreds of MeV/$c$ up to 20 GeV/$c$. The results in Pb-Pb collisions are presented as a function of the collision centrality, in the range 0$-$90%. The comparison of the $p_{\rm{T}}$-integrated particle ratios, i.e. proton-to-pion (p/$\pi$) and kaon-to-pion (K/$\pi$) ratios, with similar measurements in Pb-Pb collisions at $\sqrt{s_{\rm{NN}}}$ = 2.76 TeV show no significant energy dependence. Blast-wave fits of the $p_{\rm{T}}$ spectra indicate that in the most central collisions radial flow is slightly larger at 5.02 TeV with respect to 2.76 TeV. Particle ratios (p/$\pi$, K/$\pi$) as a function of $p_{\rm{T}}$ show pronounced maxima at $p_{\rm{T}}$ $\approx$ 3 GeV/$c$ in central Pb-Pb collisions. At high $p_{\rm{T}}$, particle ratios at 5.02 TeV are similar to those measured in pp collisions at the same energy and in Pb-Pb collisions at $\sqrt{s_{\rm{NN}}}$ = 2.76 TeV. Using the pp reference spectra measured at the same collision energy of 5.02 TeV, the nuclear modification factors for the different particle species are derived. Within uncertainties, the nuclear modification factor is particle species independent for high $p_{\rm{T}}$ and compatible with measurements at $\sqrt{s_{\rm{NN}}}$ = 2.76 TeV. The results are compared to state-of-the-art model calculations, which are found to describe the observed trends satisfactorily.
Phys. Rev. C 101, 044907 (2020)
HEP Data
e-Print: arXiv:1910.07678 | PDF | inSPIRE
CERN-EP-2019-208
Figure 1
Separation power of hadron identification in the ITS (red), TPC (magenta), TOF (blue), and HMPID (green) as a function of \pt at mid-rapidity for inelastic pp and 0$-$90\% \pbpb collisions at \snnF TeV The left (right) panel shows the separation of pions and kaons (kaons and protons), expressed as the distance between the expected average PID signal divided by the resolution for the pion (kaon) (see eq. \ref{separ}), averaged over $|\eta| < $ 0.5 The lower panels show the range in which the ITS, TPC, TOF, and HMPID provide a separation power $\approx$ 2$\sigma$ or larger. | 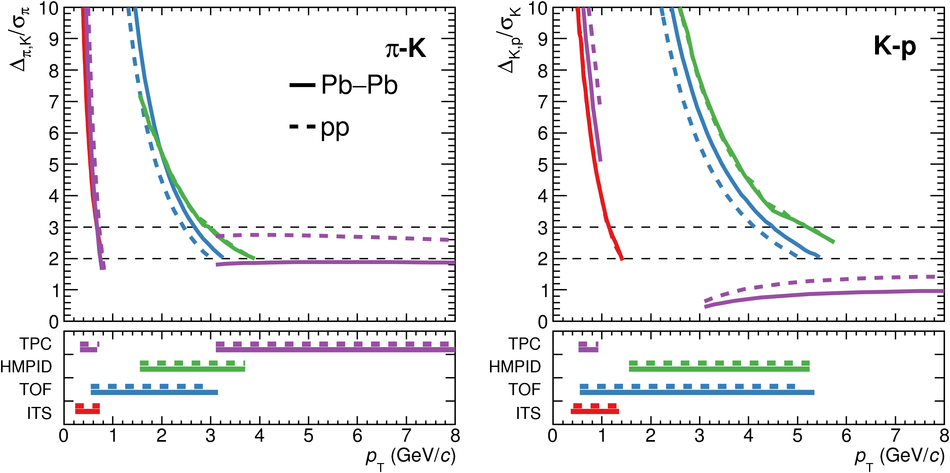 |
Figure 2
Invariant mass distribution of identified charged kaons from their decay products in pp (a) and \pbpb collisions (b) at \snnF TeV The red circles and blue lines represent the experimental data and Monte Carlo simulation, respectively, before (upper) and after (lower) the topological selection The peak centered at $M_{\mu\nu} = 0.49$ GeV/$\it{c}^2$ is for the decay channel K $\rightarrow \mu + \nu_{\mu}$ (\BR $= 63.55\%$), whereas the peak centered at $M_{\mu\nu}$ = 0.43 GeV/$\it{c}^2$ is for the decay channel K $\rightarrow \pi + \pi^0$ (\BR = 20.66\%), whose invariant mass is calculated with the wrong mass hypothesis. | 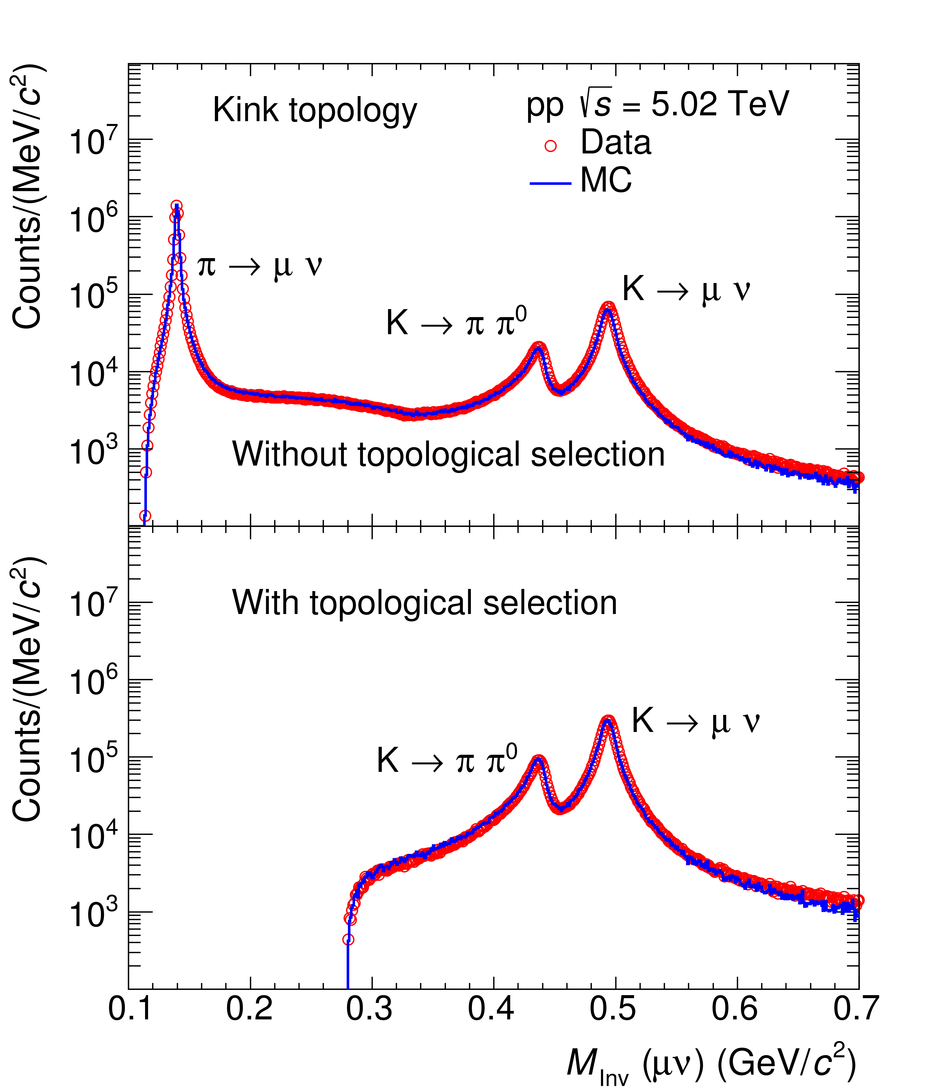 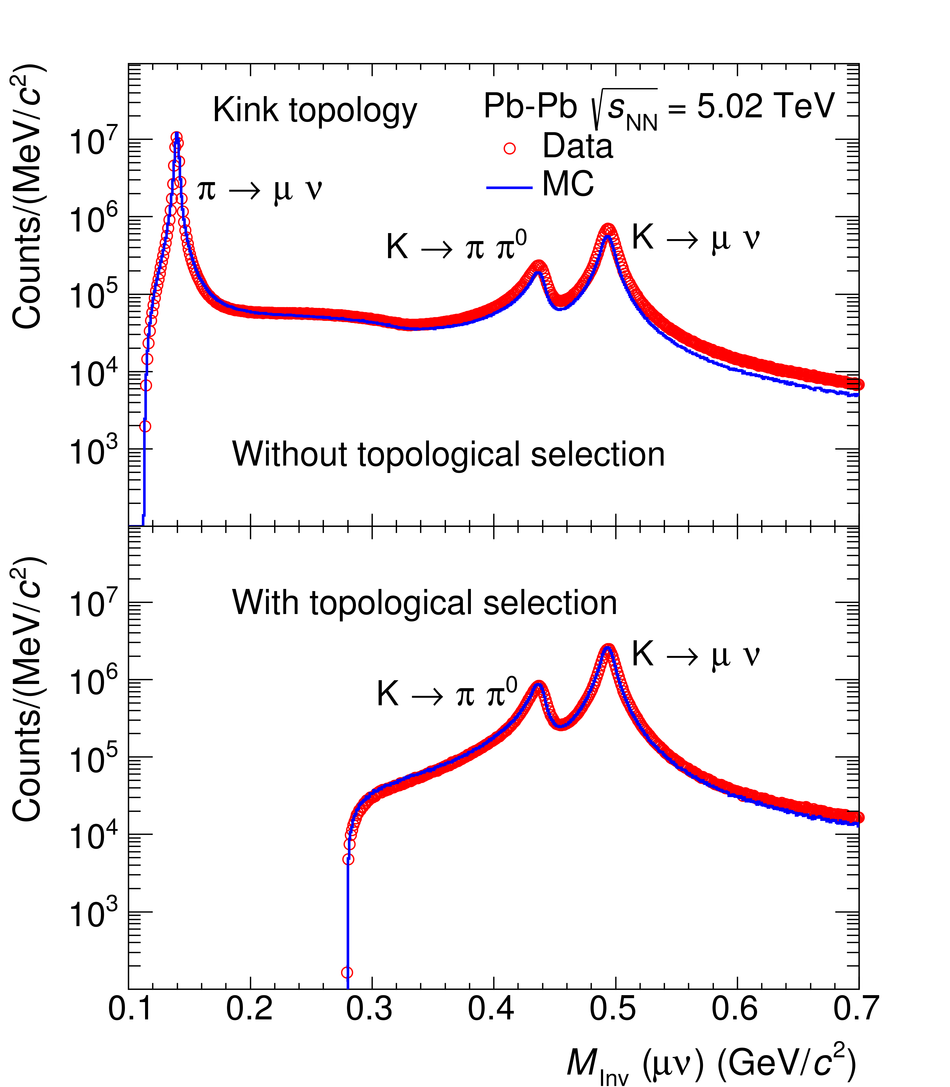 |
Figure 3
Transverse momentum spectra of pions (left), kaons (middle) and (anti-)protons (right) measured in \pbpb collisions at \snnF\,TeV for different centrality classes Scale factors are applied for better visibility The results are compared with the spectra measured in inelastic pp collisions at \sF\,TeV Statistical and systematic uncertainties are displayed as error bars and boxes around the data points, respectively. | 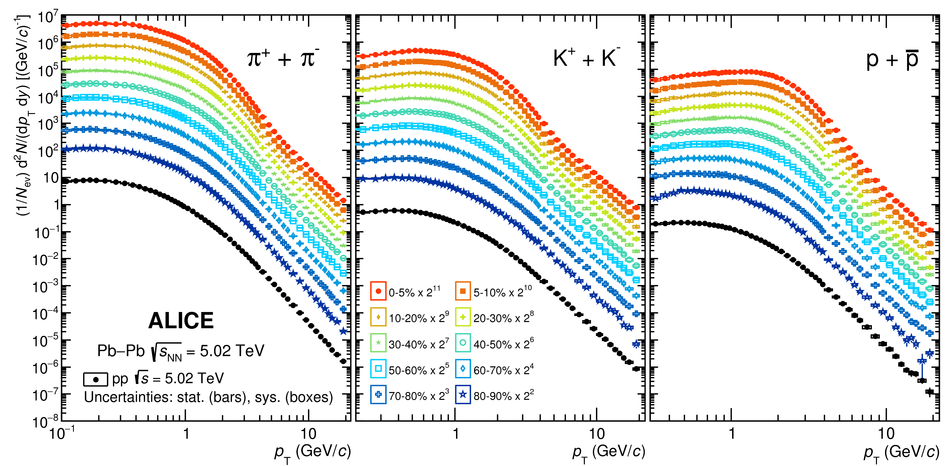 |
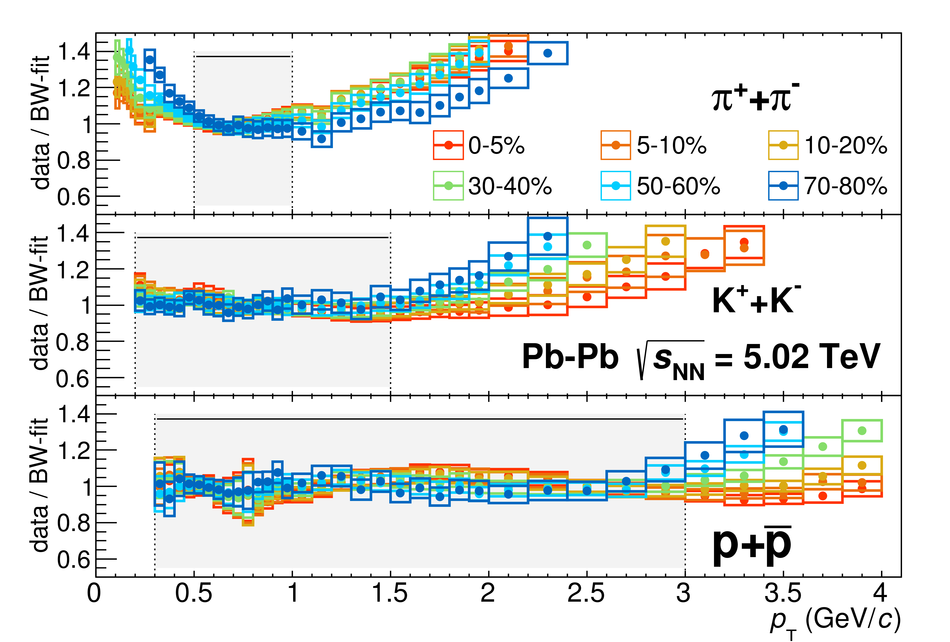
Figure 5
Average expansion velocity (\avBt) and kinetic freeze-out temperature (\Tkin) progression from the simultaneous Boltzmann-Gibbs blast-wave fit to \ppipm, \pkapm and p(\pprm) spectra measured in \pbpb collisions at \snnF and 2.76 TeV The correlated uncertainties from the global fit are shown as ellipses The elliptic contours correspond to 1$\sigma$ uncertainties, with statistical and systematic uncertainties being added in quadrature |  |
Figure 6
Mean transverse momentum as a function of \avdNchdeta for \ppipm, \pkapm and \pprpm in \pbpb collisions at \snnF (full color markers) and 2.76 TeV (full black markers) and in inelastic pp collisions at \sF\ and 2.76 TeV (empty color markers) The empty boxes show the total systematic uncertainty; the shaded boxes indicate the contribution uncorrelated across centrality bins (not estimated in \pbpb collisions at \snnT TeV) Continuous lines represent the Bayesian analysis predictions | 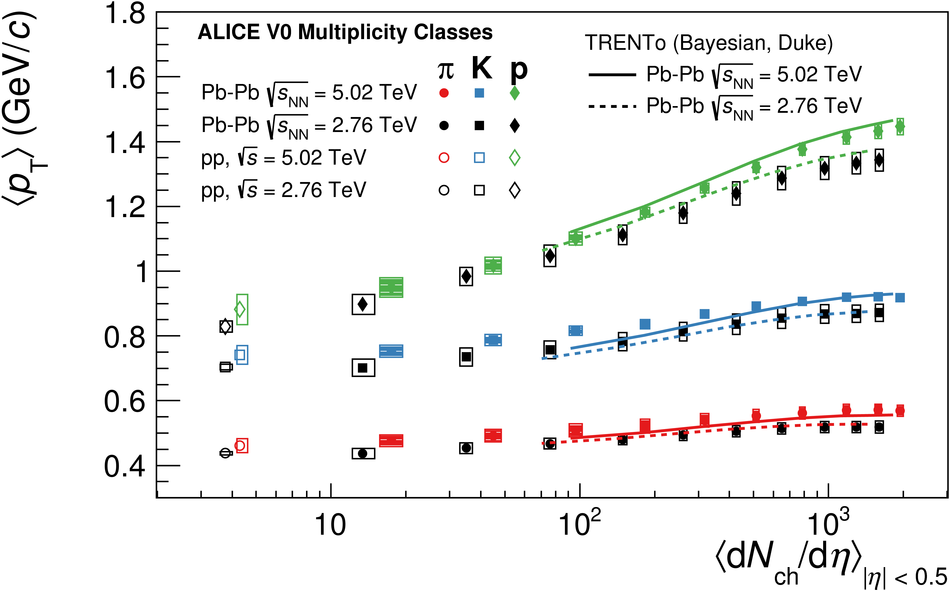 |
Figure 7
Transverse momentum integrated K/\ppi (top) and p/\ppi (bottom) ratios as a function of \avdNchdeta in \pbpb collisions at \snnF TeV, compared to \pbpb at 2.76 TeV The values in pp collisions at \sF and 2.76 TeV are also shown The empty boxes show the total systematic uncertainty; the shaded boxes indicate the contribution uncorrelated across centrality bins (not estimated in \pbpb collisions at \snnT TeV) Continuous lines represent the Bayesian analysis predictions. | 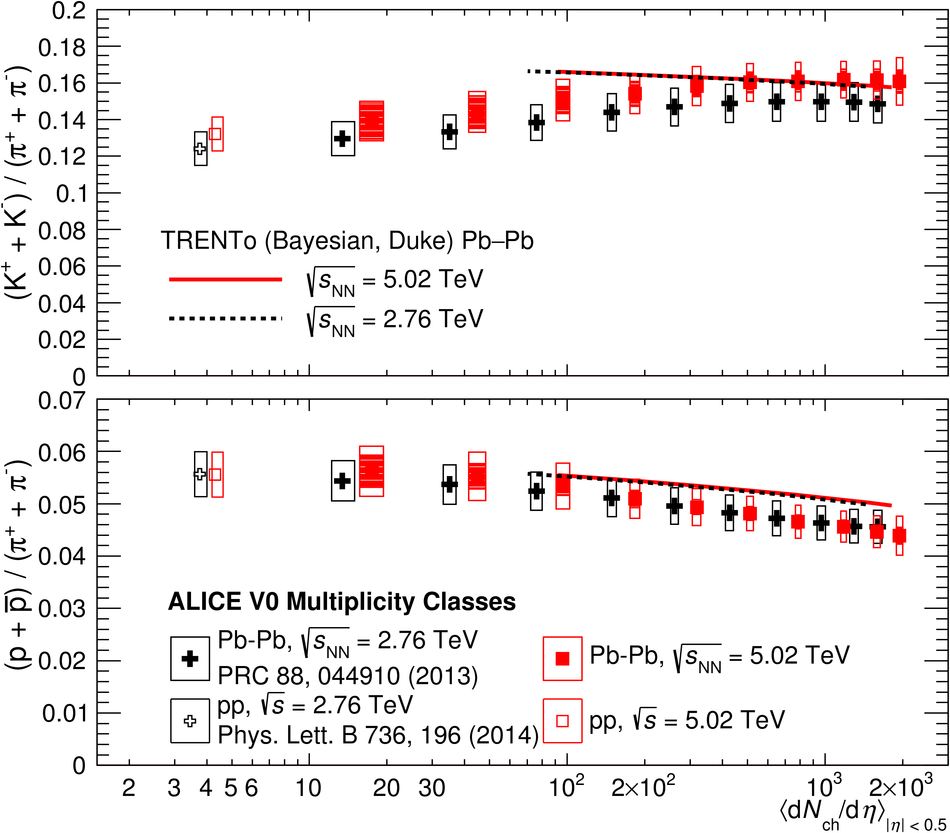 |
Figure 8
Centrality dependence of the K/\ppi (top) and p/\ppi (bottom) ratios as a function of transverse momentum, measured in \pbpb collisions at \snnF and 2.76 TeV The ratios in pp collisions at \sF TeV is also shown The statistical and systematic uncertainties are shown as error bars and boxes around the data points, respectively. | 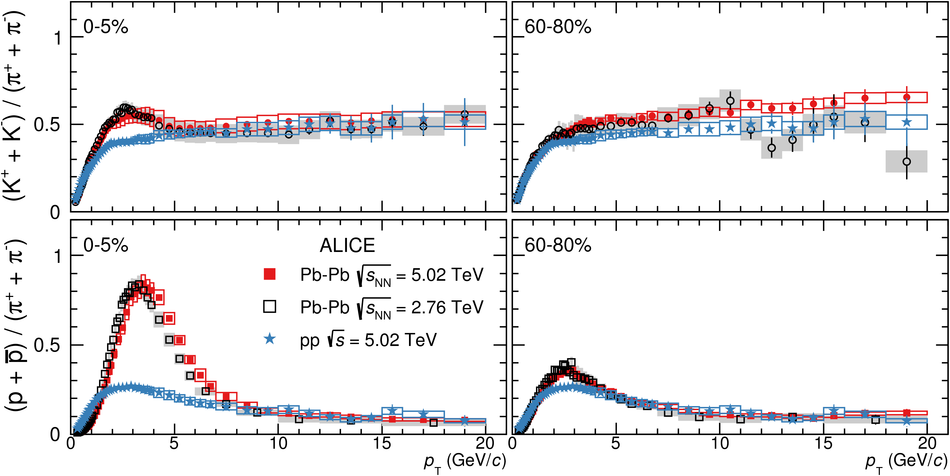 |
Figure 9
Centrality dependence of the nuclear modification factor of charged \ppipm, \pkapm and \pprpm as a function of transverse momentum, measured in \pbpb collisions at \snnF TeV The statistical and systematic uncertainties are shown as error bars and boxes around the data points The total normalization uncertainty (pp and \pbpb) is indicated in each panel by the vertical scale of the box centered at \pt = 1 GeV$/c$ and \raa = 1. | 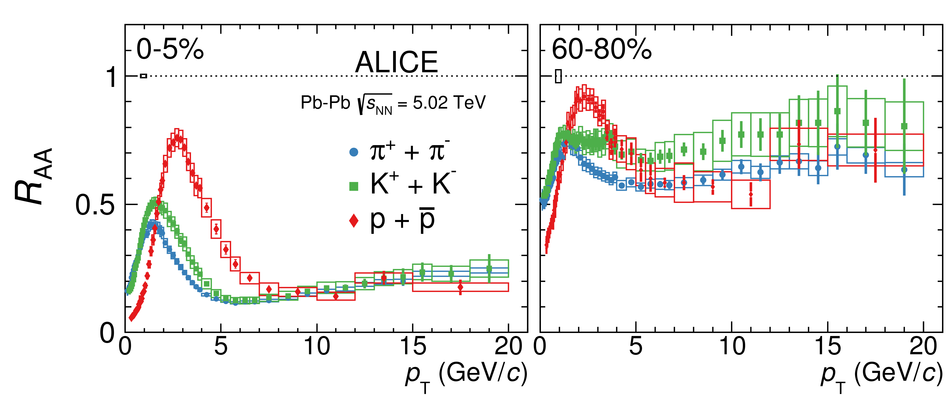 |
Figure 10
Centrality dependence of the nuclear modification factor of charged \ppipm, \pkapm and \pprpm as a function of transverse momentum, measured in \pbpb collisions at \snnT and 5.02 TeV, for 0$-$5\% and 60$-$80\% centrality classes The statistical and systematic uncertainties are shown as error bars and boxes around the data points The total normalization uncertainty (pp and \pbpb) is indicated in each panel by the vertical scale of the box centered at \pt = 1 \gevc and \raa = 1. | 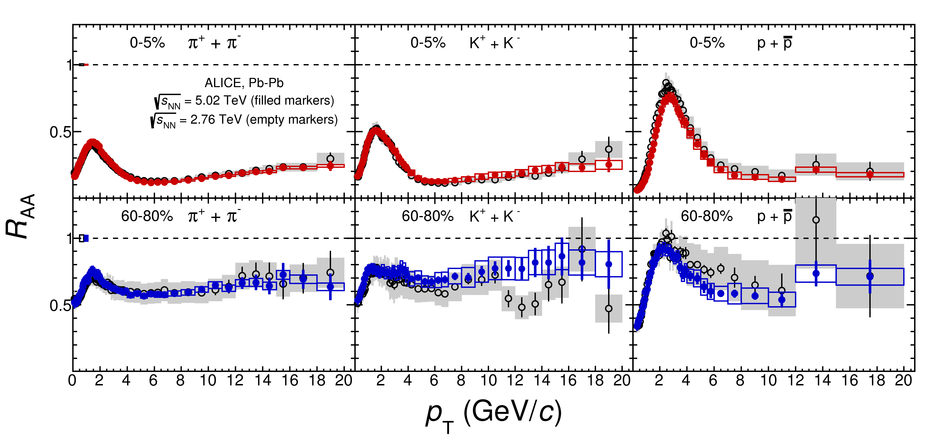 |
Figure 11
Ratios of data to iEBE-VISHNU and McGill models (see text for details), for \ppipm, \pkapm and \pprpm \pt spectra in \pbpb collisions at \snnF\,TeV for centrality classes 0-5\%, 30-40\% and 70-80\% The statistical and systematic uncertainties are shown as error bars and bands around the data points, respectively. | 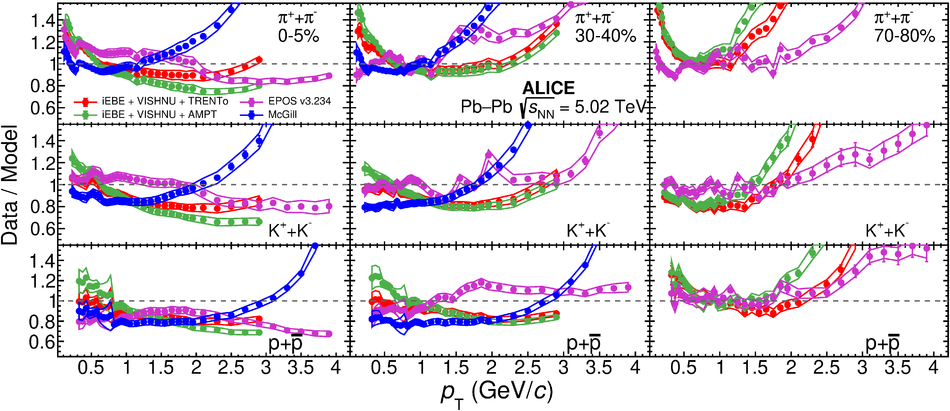 |
Figure 12
Ratios of data to EPOS3 model (see text for details), for \ppipm, \pkapm and \pprpm \pt spectra in \pbpb collisions at \snnF\,TeV for centrality classes 0-5\%, 30-40\% and 70-80\% The statistical and systematic uncertainties are shown as error bars and bands around the data points, respectively. | 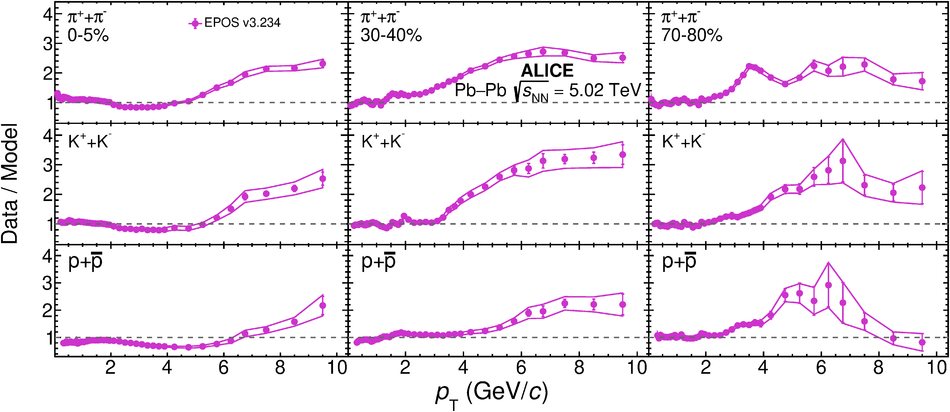 |
Figure 13
(Top) K/\ppi and p/\ppi ratios in \pbpb collisions at \snnF TeV in 0-5\% centrality class, compared to iEBE-VISHNU, McGill and EPOS3 model predictions, see text for details The statistical and systematic uncertainties are shown as error bars and boxes around the data points, respectively For model predictions the statistical uncertainties are represented by the band width (Bottom) Data-to-model ratio, the statistical and systematic uncertainties are shown as error bars and bands around the data points, respectively. | 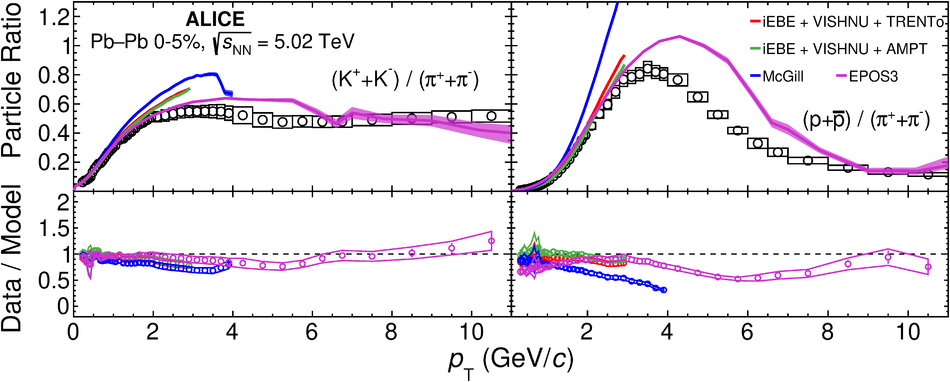 |
Figure 14
(Top) K/\ppi and p/\ppi ratios in \pbpb collisions at \snnF TeV in 30-40\% centrality class, compared to iEBE-VISHNU, McGill and EPOS3 model predictions, see text for details The statistical and systematic uncertainties are shown as error bars and boxes around the data points, respectively For model predictions the statistical uncertainties are represented by the band width (Bottom) Data-to-model ratio, the statistical and systematic uncertainties are shown as error bars and bands around the data points, respectively. | 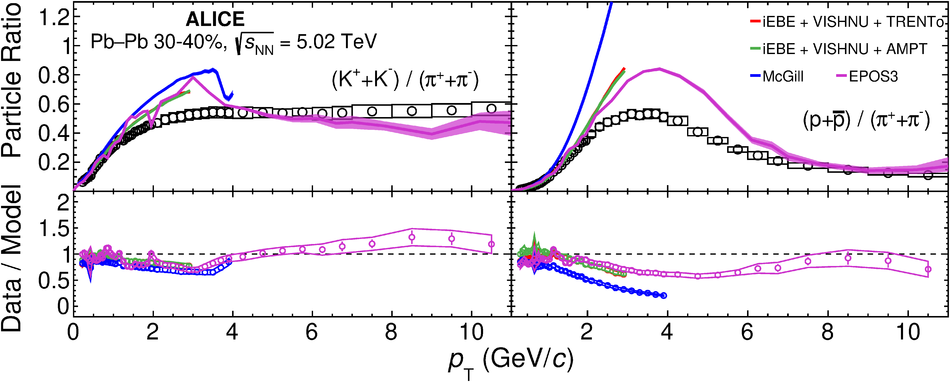 |
Figure 15
(Top) K/\ppi and p/\ppi ratios in \pbpb collisions at \snnF TeV in 70-80\% centrality class, compared to iEBE-VISHNU, McGill and EPOS3 model predictions, see text for details The statistical and systematic uncertainties are shown as error bars and boxes around the data points, respectively For model predictions the statistical uncertainties are represented by the band width (Bottom) Data-to-model ratio, the statistical and systematic uncertainties are shown as error bars and bands around the data points, respectively. | 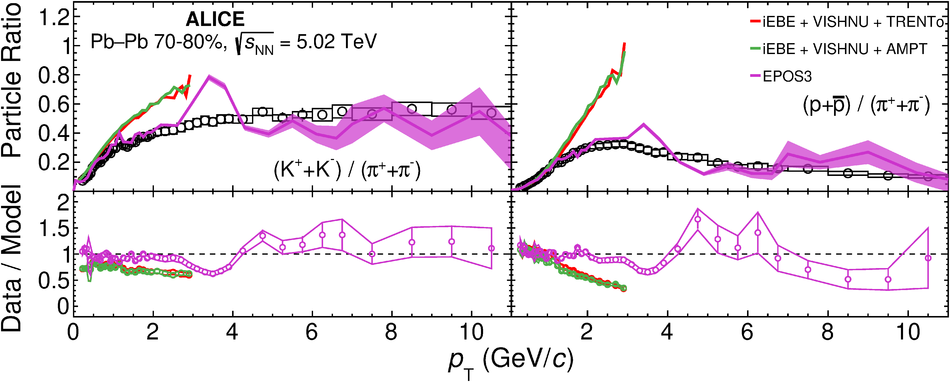 |
Figure 16
\ppipm, \pkapm and \pprpm \pt spectra in \pbpb collisions at \snnF\,TeV divided for the same spectra measured in \pbpb collisions at \snnT\,TeV for centrality classes 0-5\%, 30-40\% and 70-80\%, compared to iEBE-VISHNU, McGill and EPOS3 model predictions, see text for details The statistical and systematic uncertainties are shown as error bars and boxes around the data points, respectively For model predictions the statistical uncertainties are represented by the band width. | 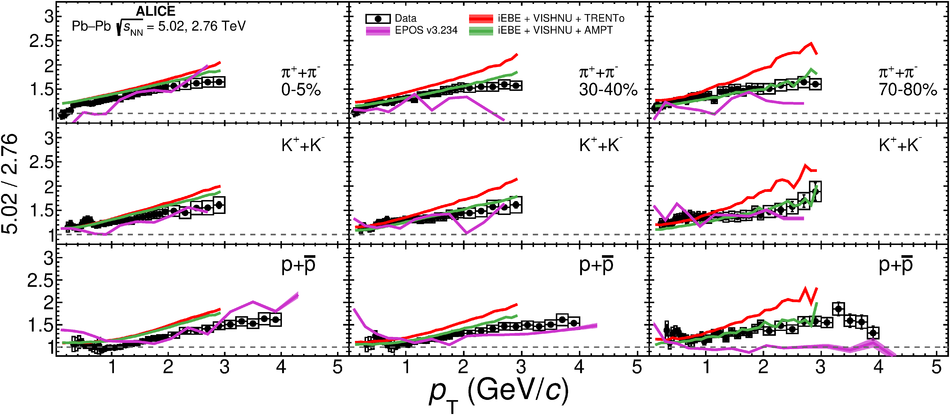 |