Invariant mass distribution of identified charged kaons from their decay products in pp (a) and \pbpb collisions (b) at \snnF TeV The red circles and blue lines represent the experimental data and Monte Carlo simulation, respectively, before (upper) and after (lower) the topological selection The peak centered at $M_{\mu\nu} = 0.49$ GeV/$\it{c}^2$ is for the decay channel K $\rightarrow \mu + \nu_{\mu}$ (\BR $= 63.55\%$), whereas the peak centered at $M_{\mu\nu}$ = 0.43 GeV/$\it{c}^2$ is for the decay channel K $\rightarrow \pi + \pi^0$ (\BR = 20.66\%), whose invariant mass is calculated with the wrong mass hypothesis. | 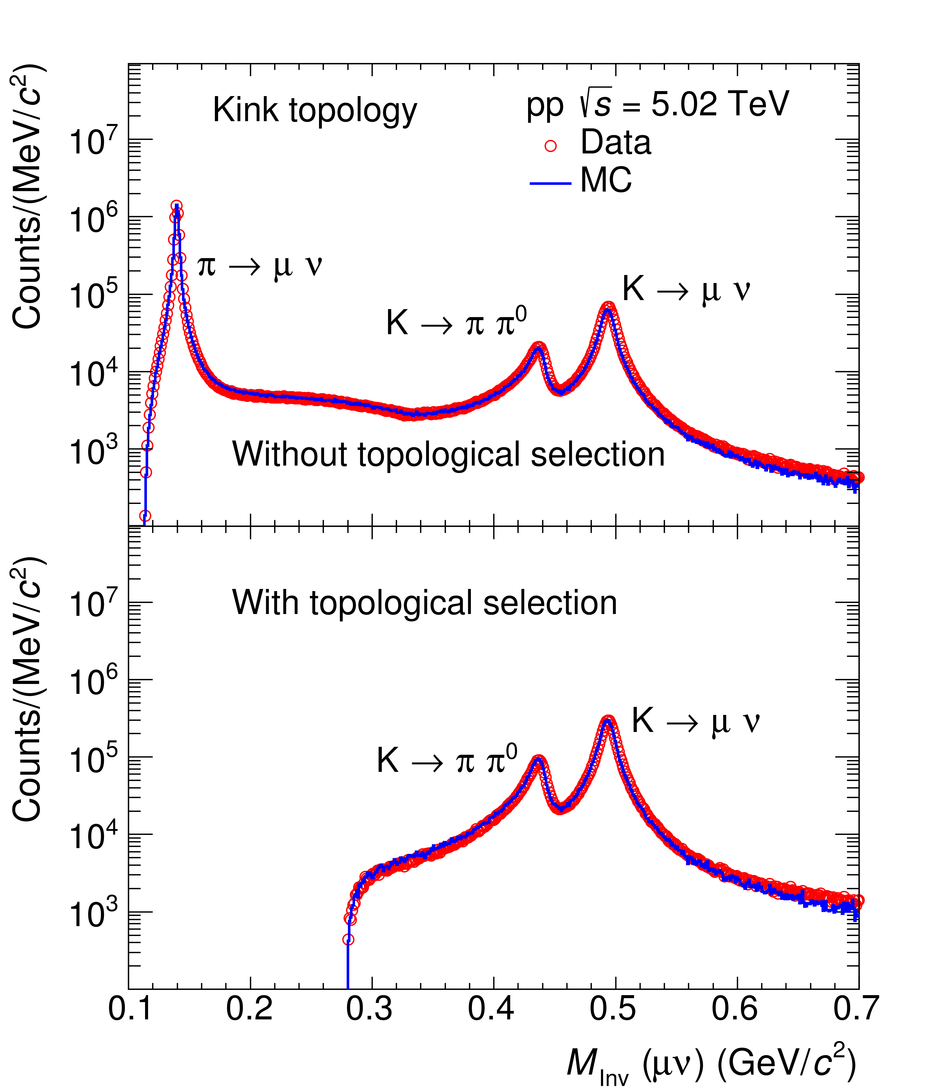 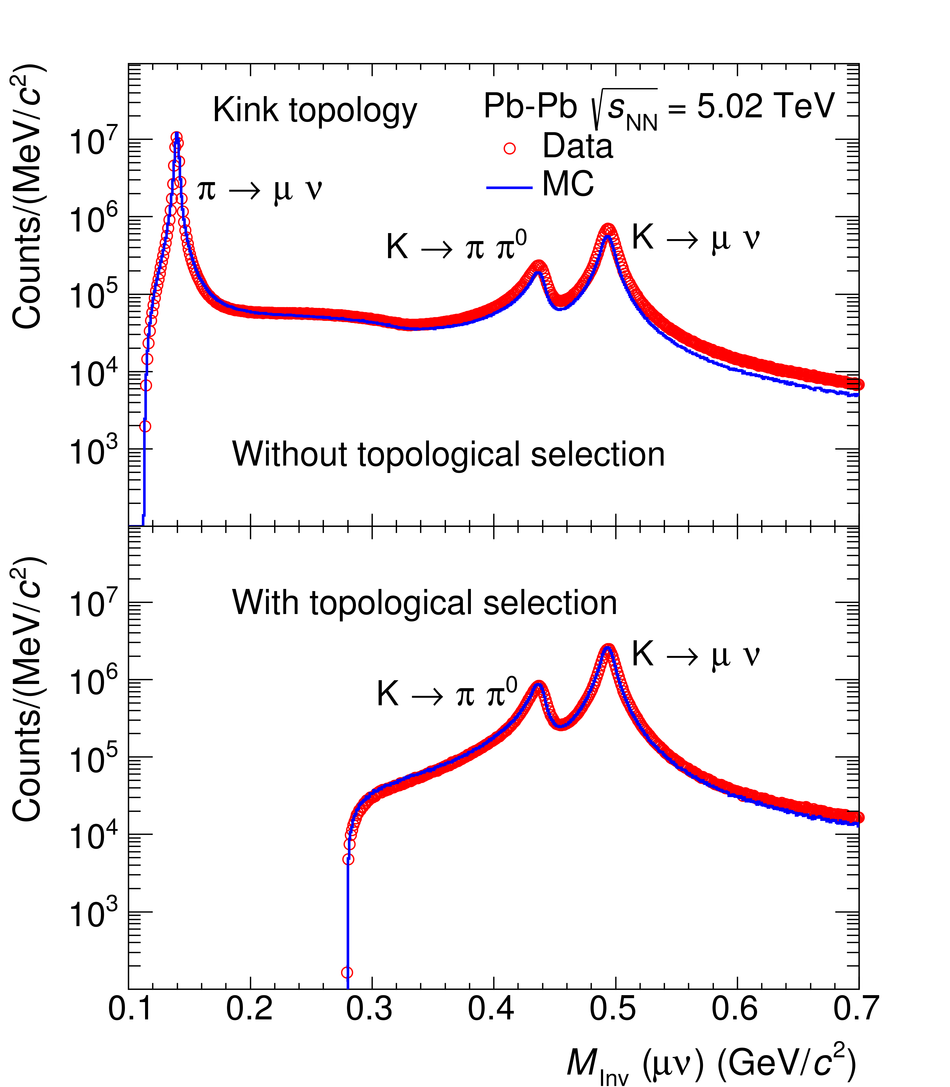 |