Mean transverse momentum as a function of \avdNchdeta for \ppipm, \pkapm and \pprpm in \pbpb collisions at \snnF (full color markers) and 2.76 TeV (full black markers) and in inelastic pp collisions at \sF\ and 2.76 TeV (empty color markers) The empty boxes show the total systematic uncertainty; the shaded boxes indicate the contribution uncorrelated across centrality bins (not estimated in \pbpb collisions at \snnT TeV) Continuous lines represent the Bayesian analysis predictions | 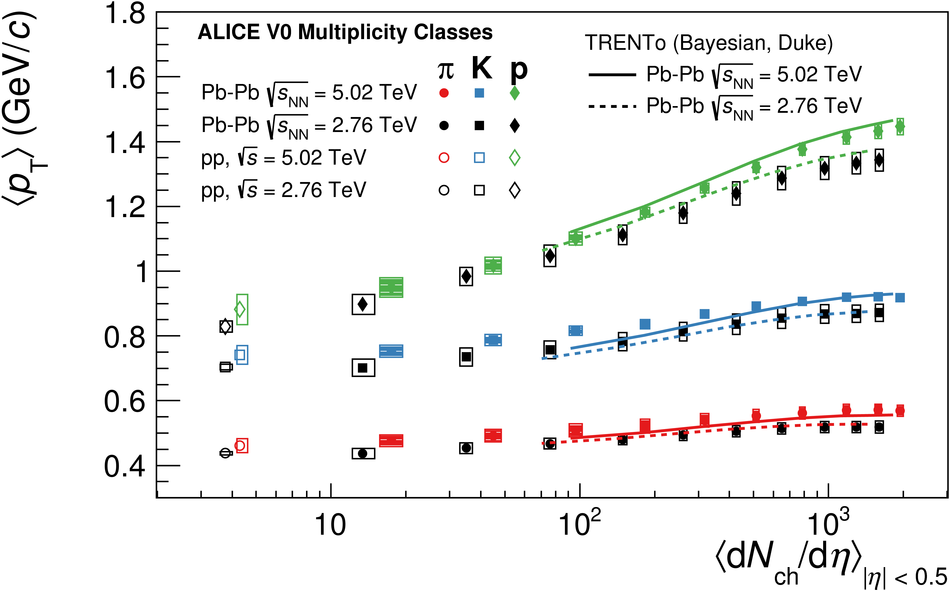 |