Distribution of the invariant mass of the $^{3}_{\Lambda}{\rm H}$ and $^{3}_{\bar{\Lambda}}\bar{{\rm H}}$ candidates in nine $ct$ intervals from 1 to 35 cm. The statistical uncertainties of the bin counts are represented with vertical lines. The distribution is fitted with a two-component model; the blue line depicts the overall fit, and the orange dashed line displays the background component. | 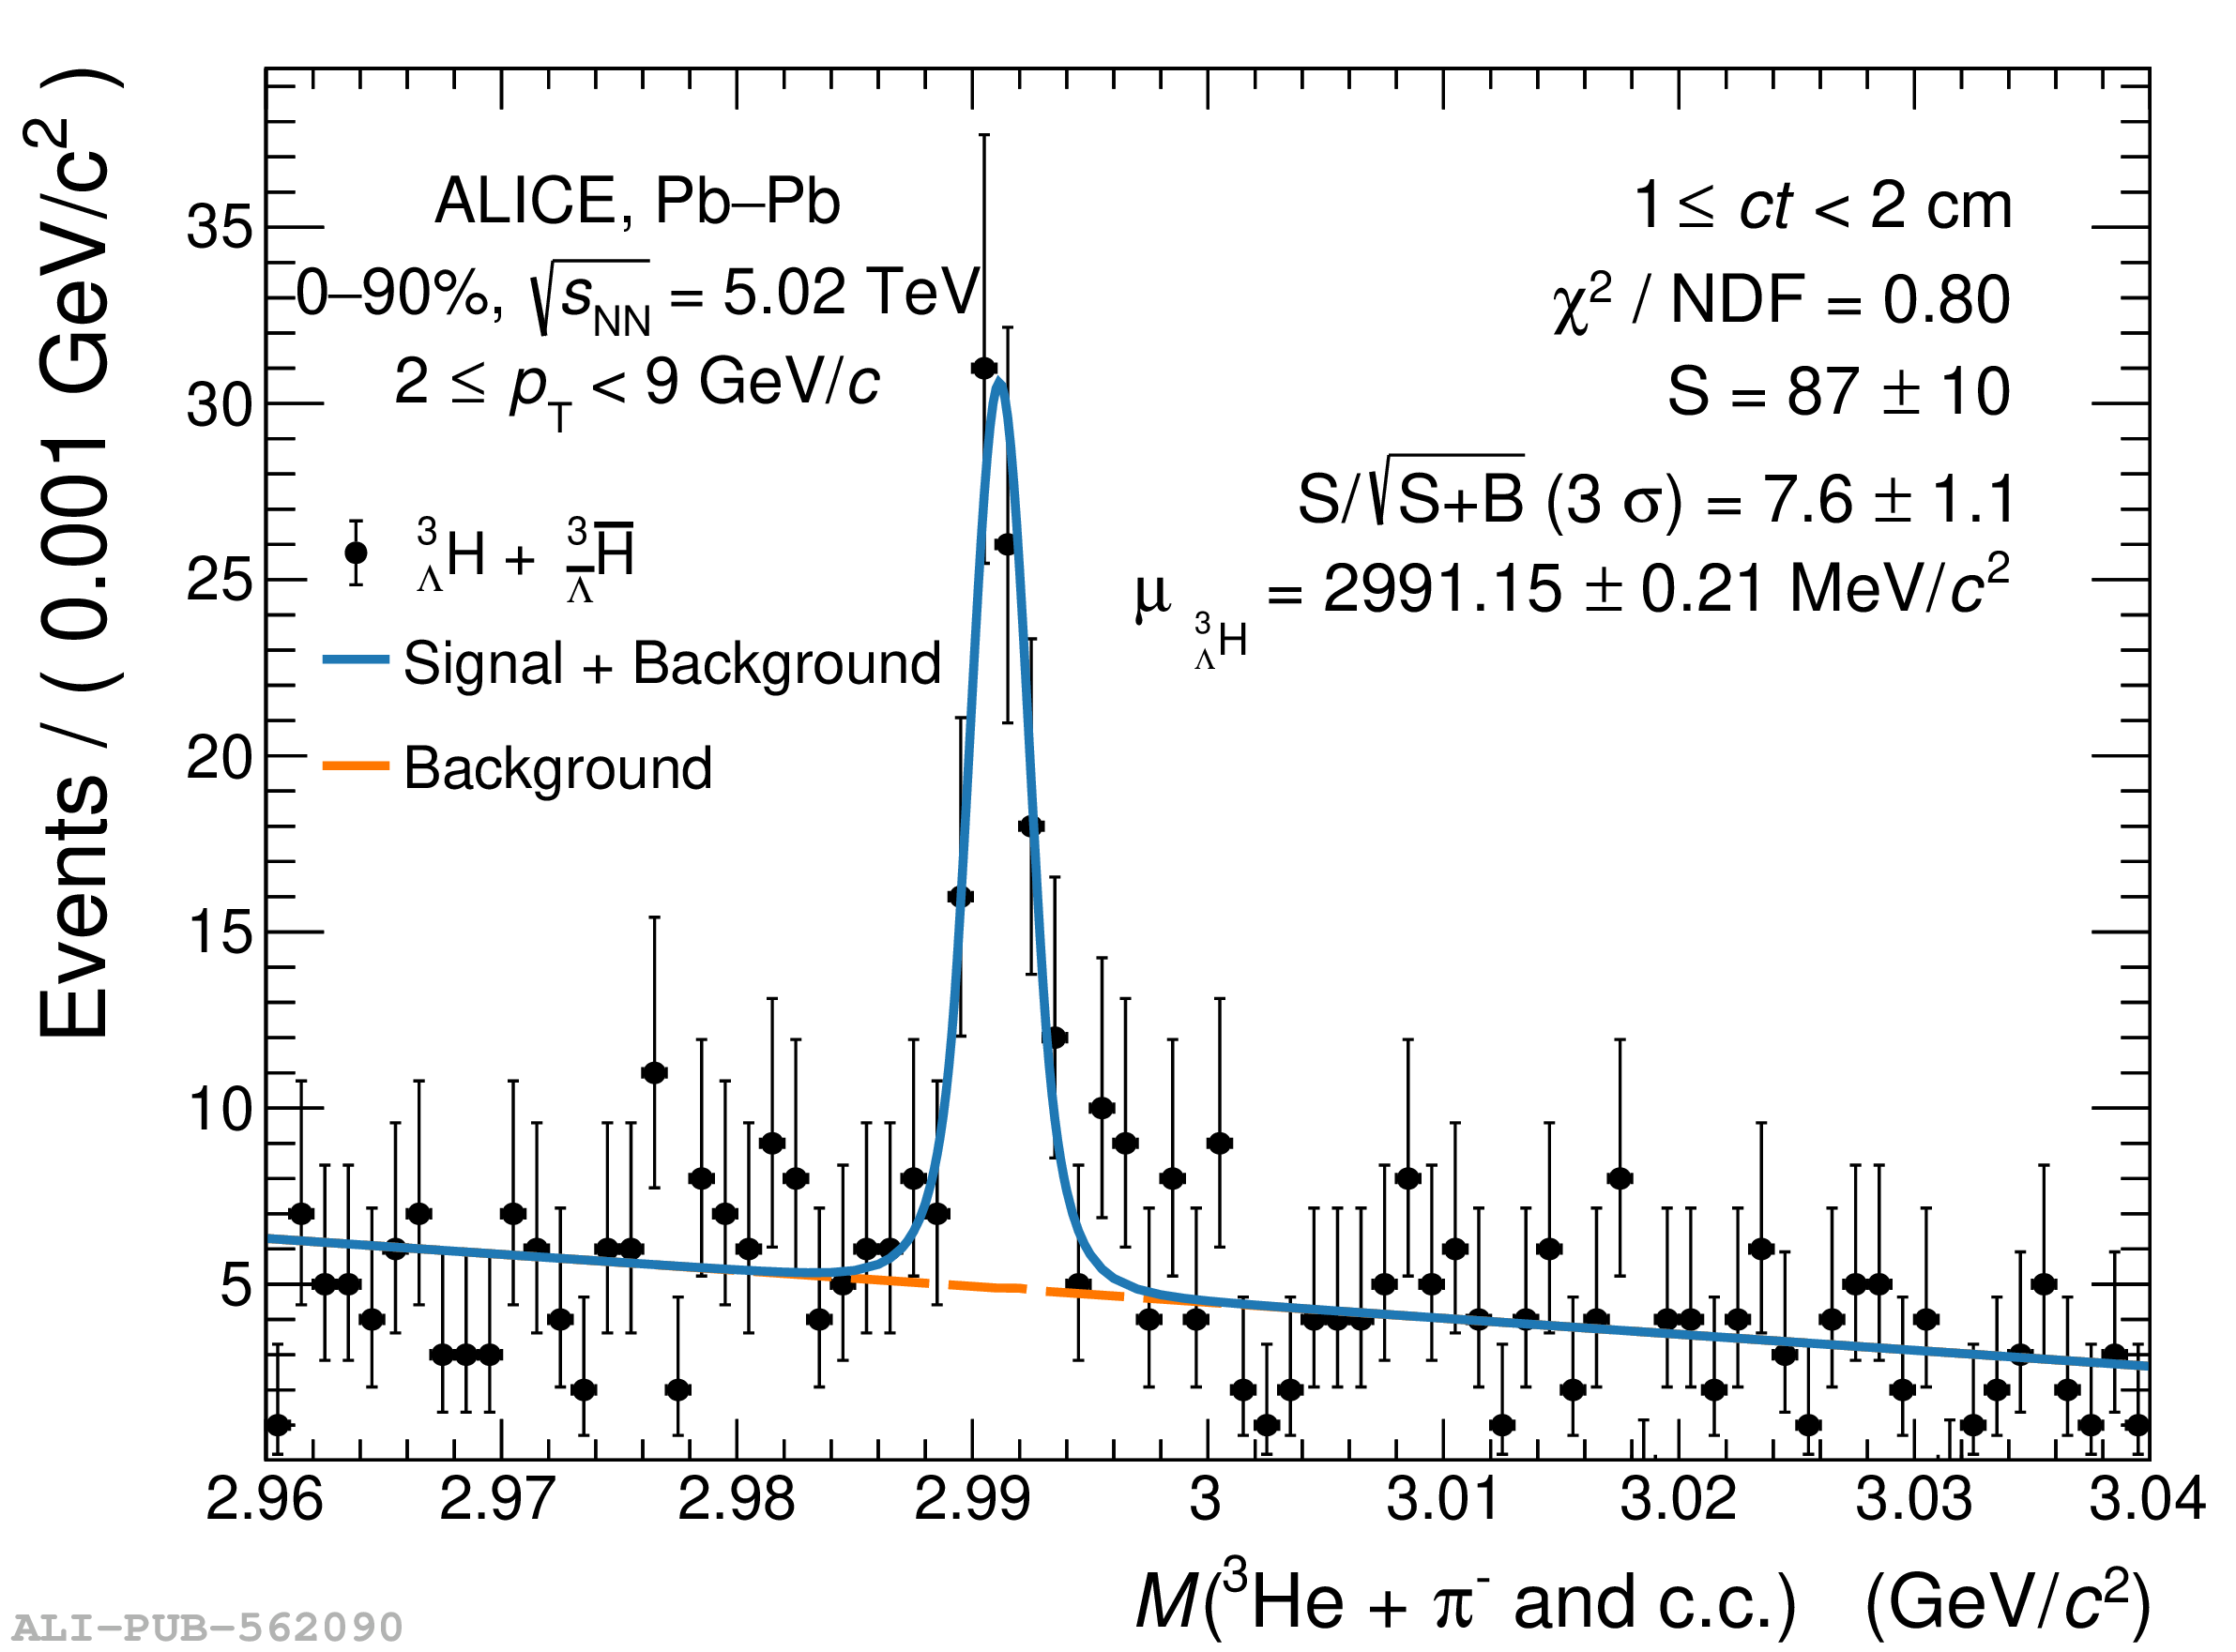 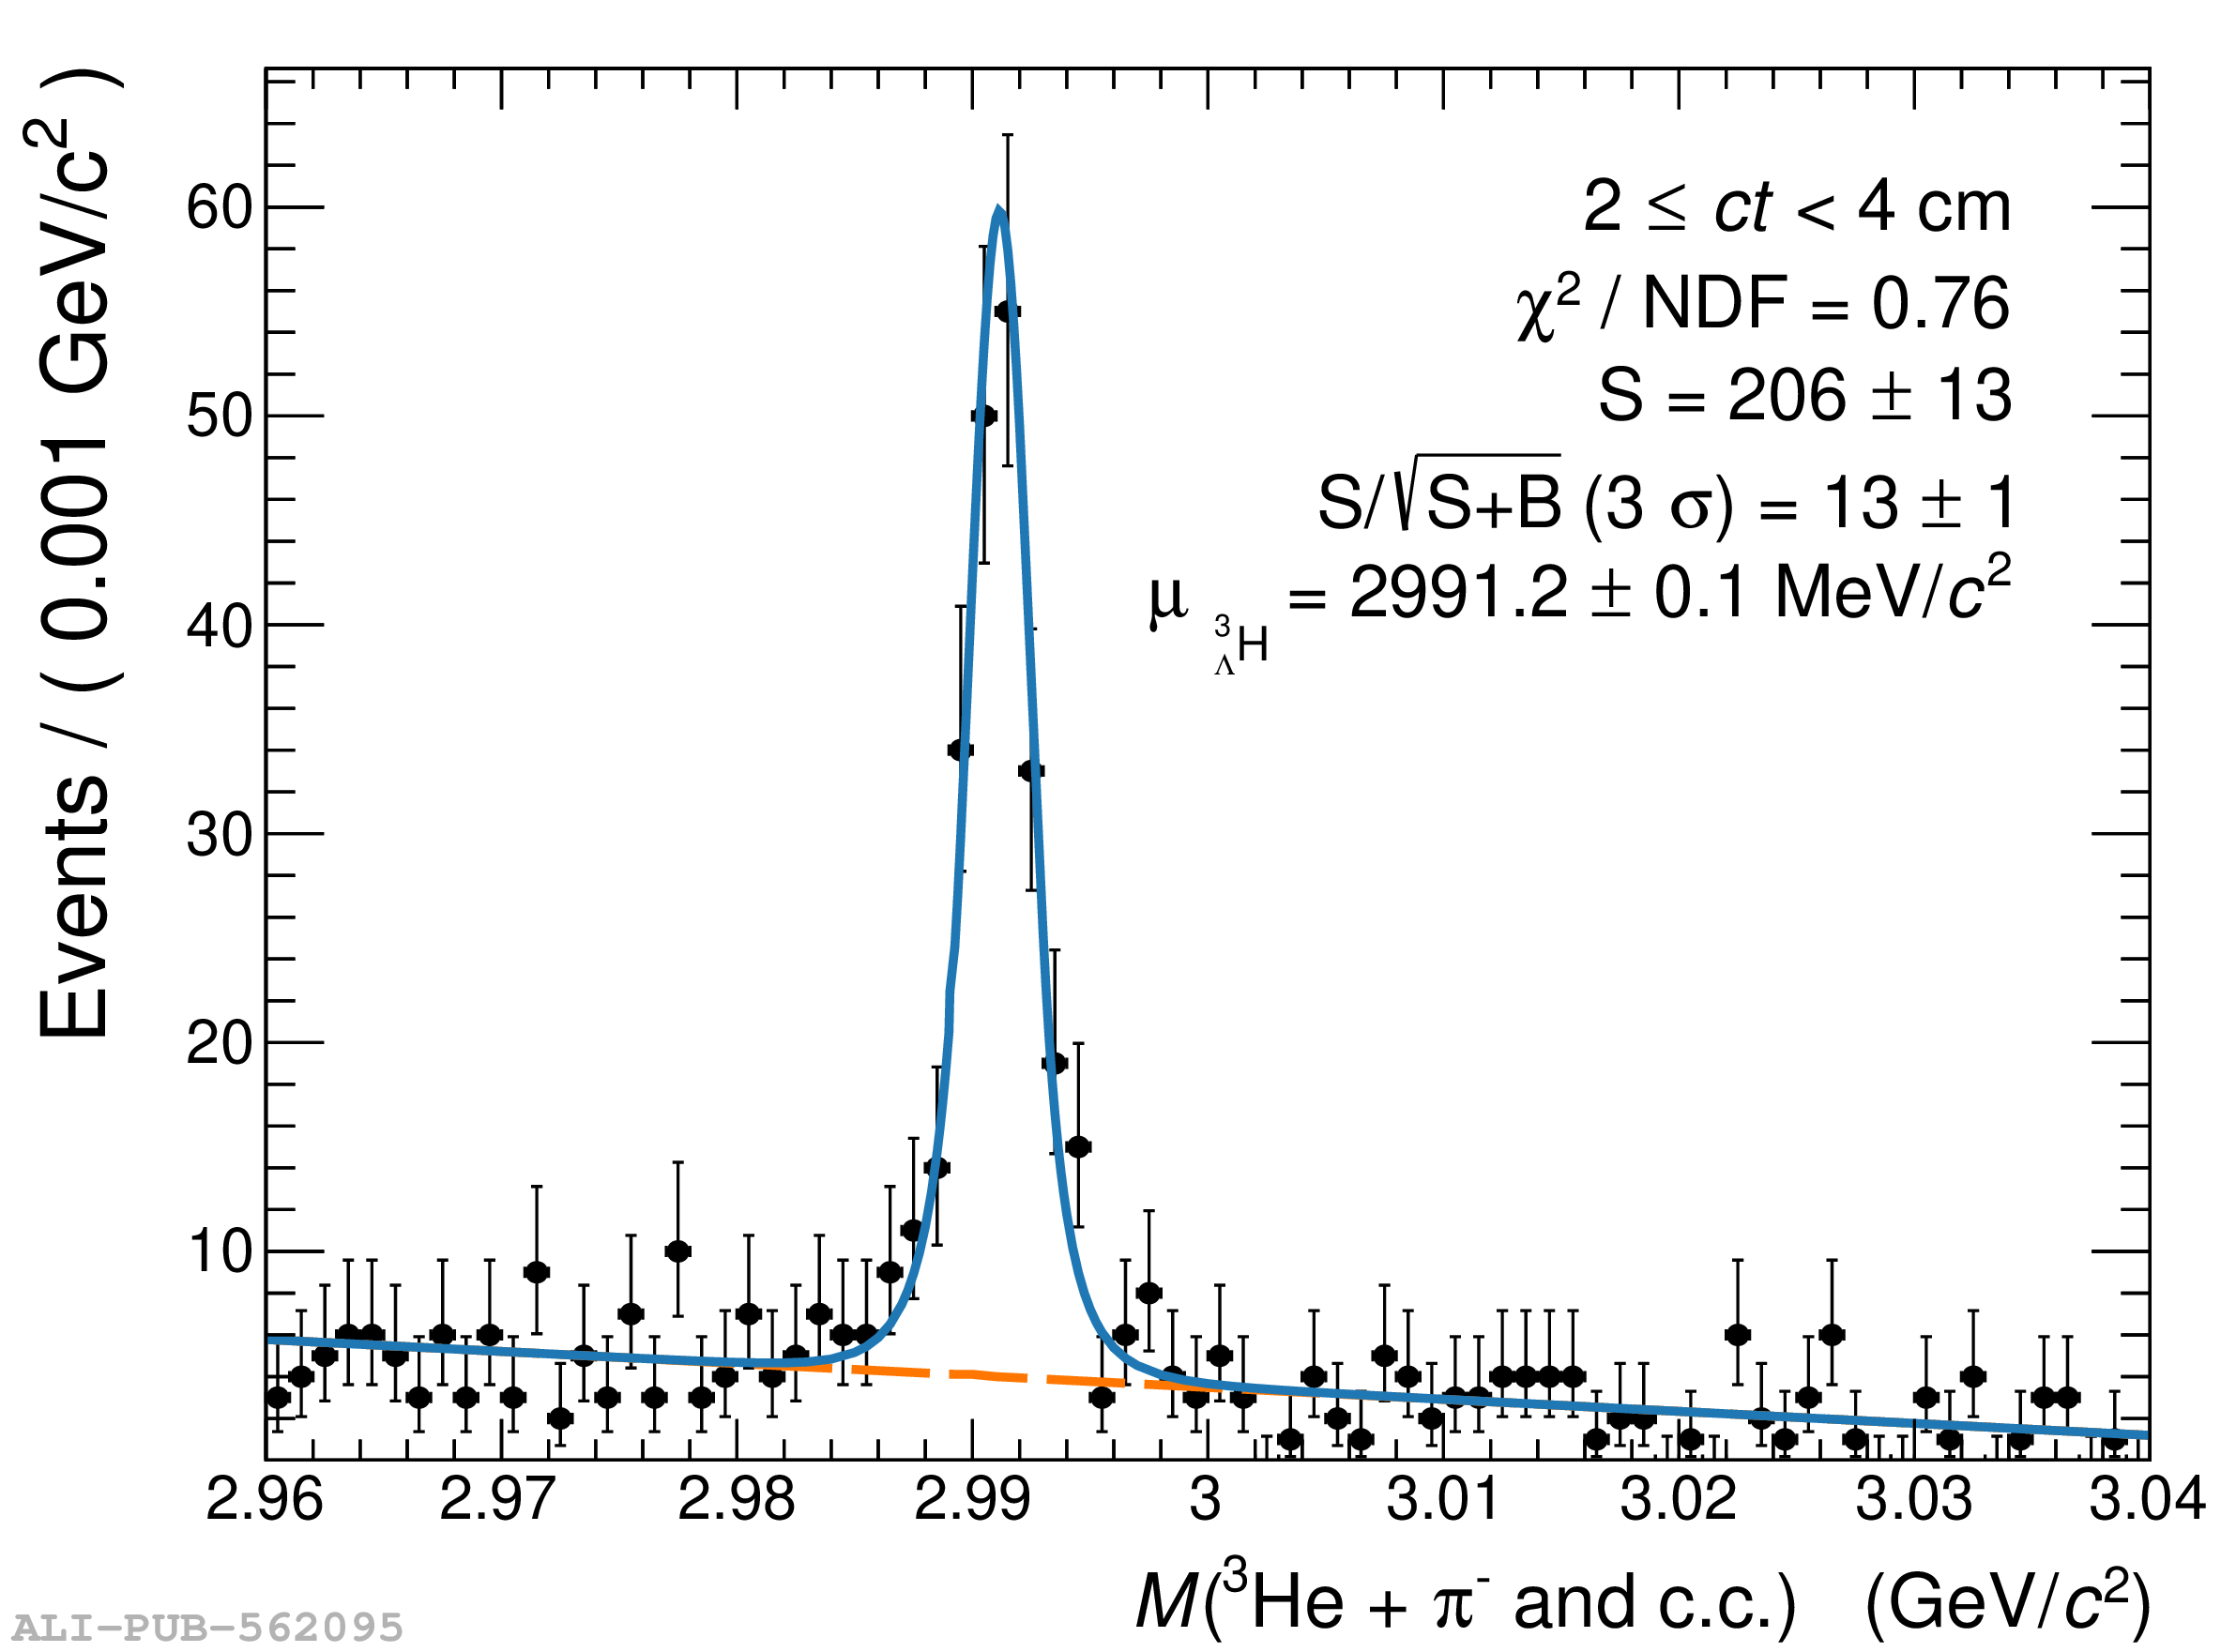  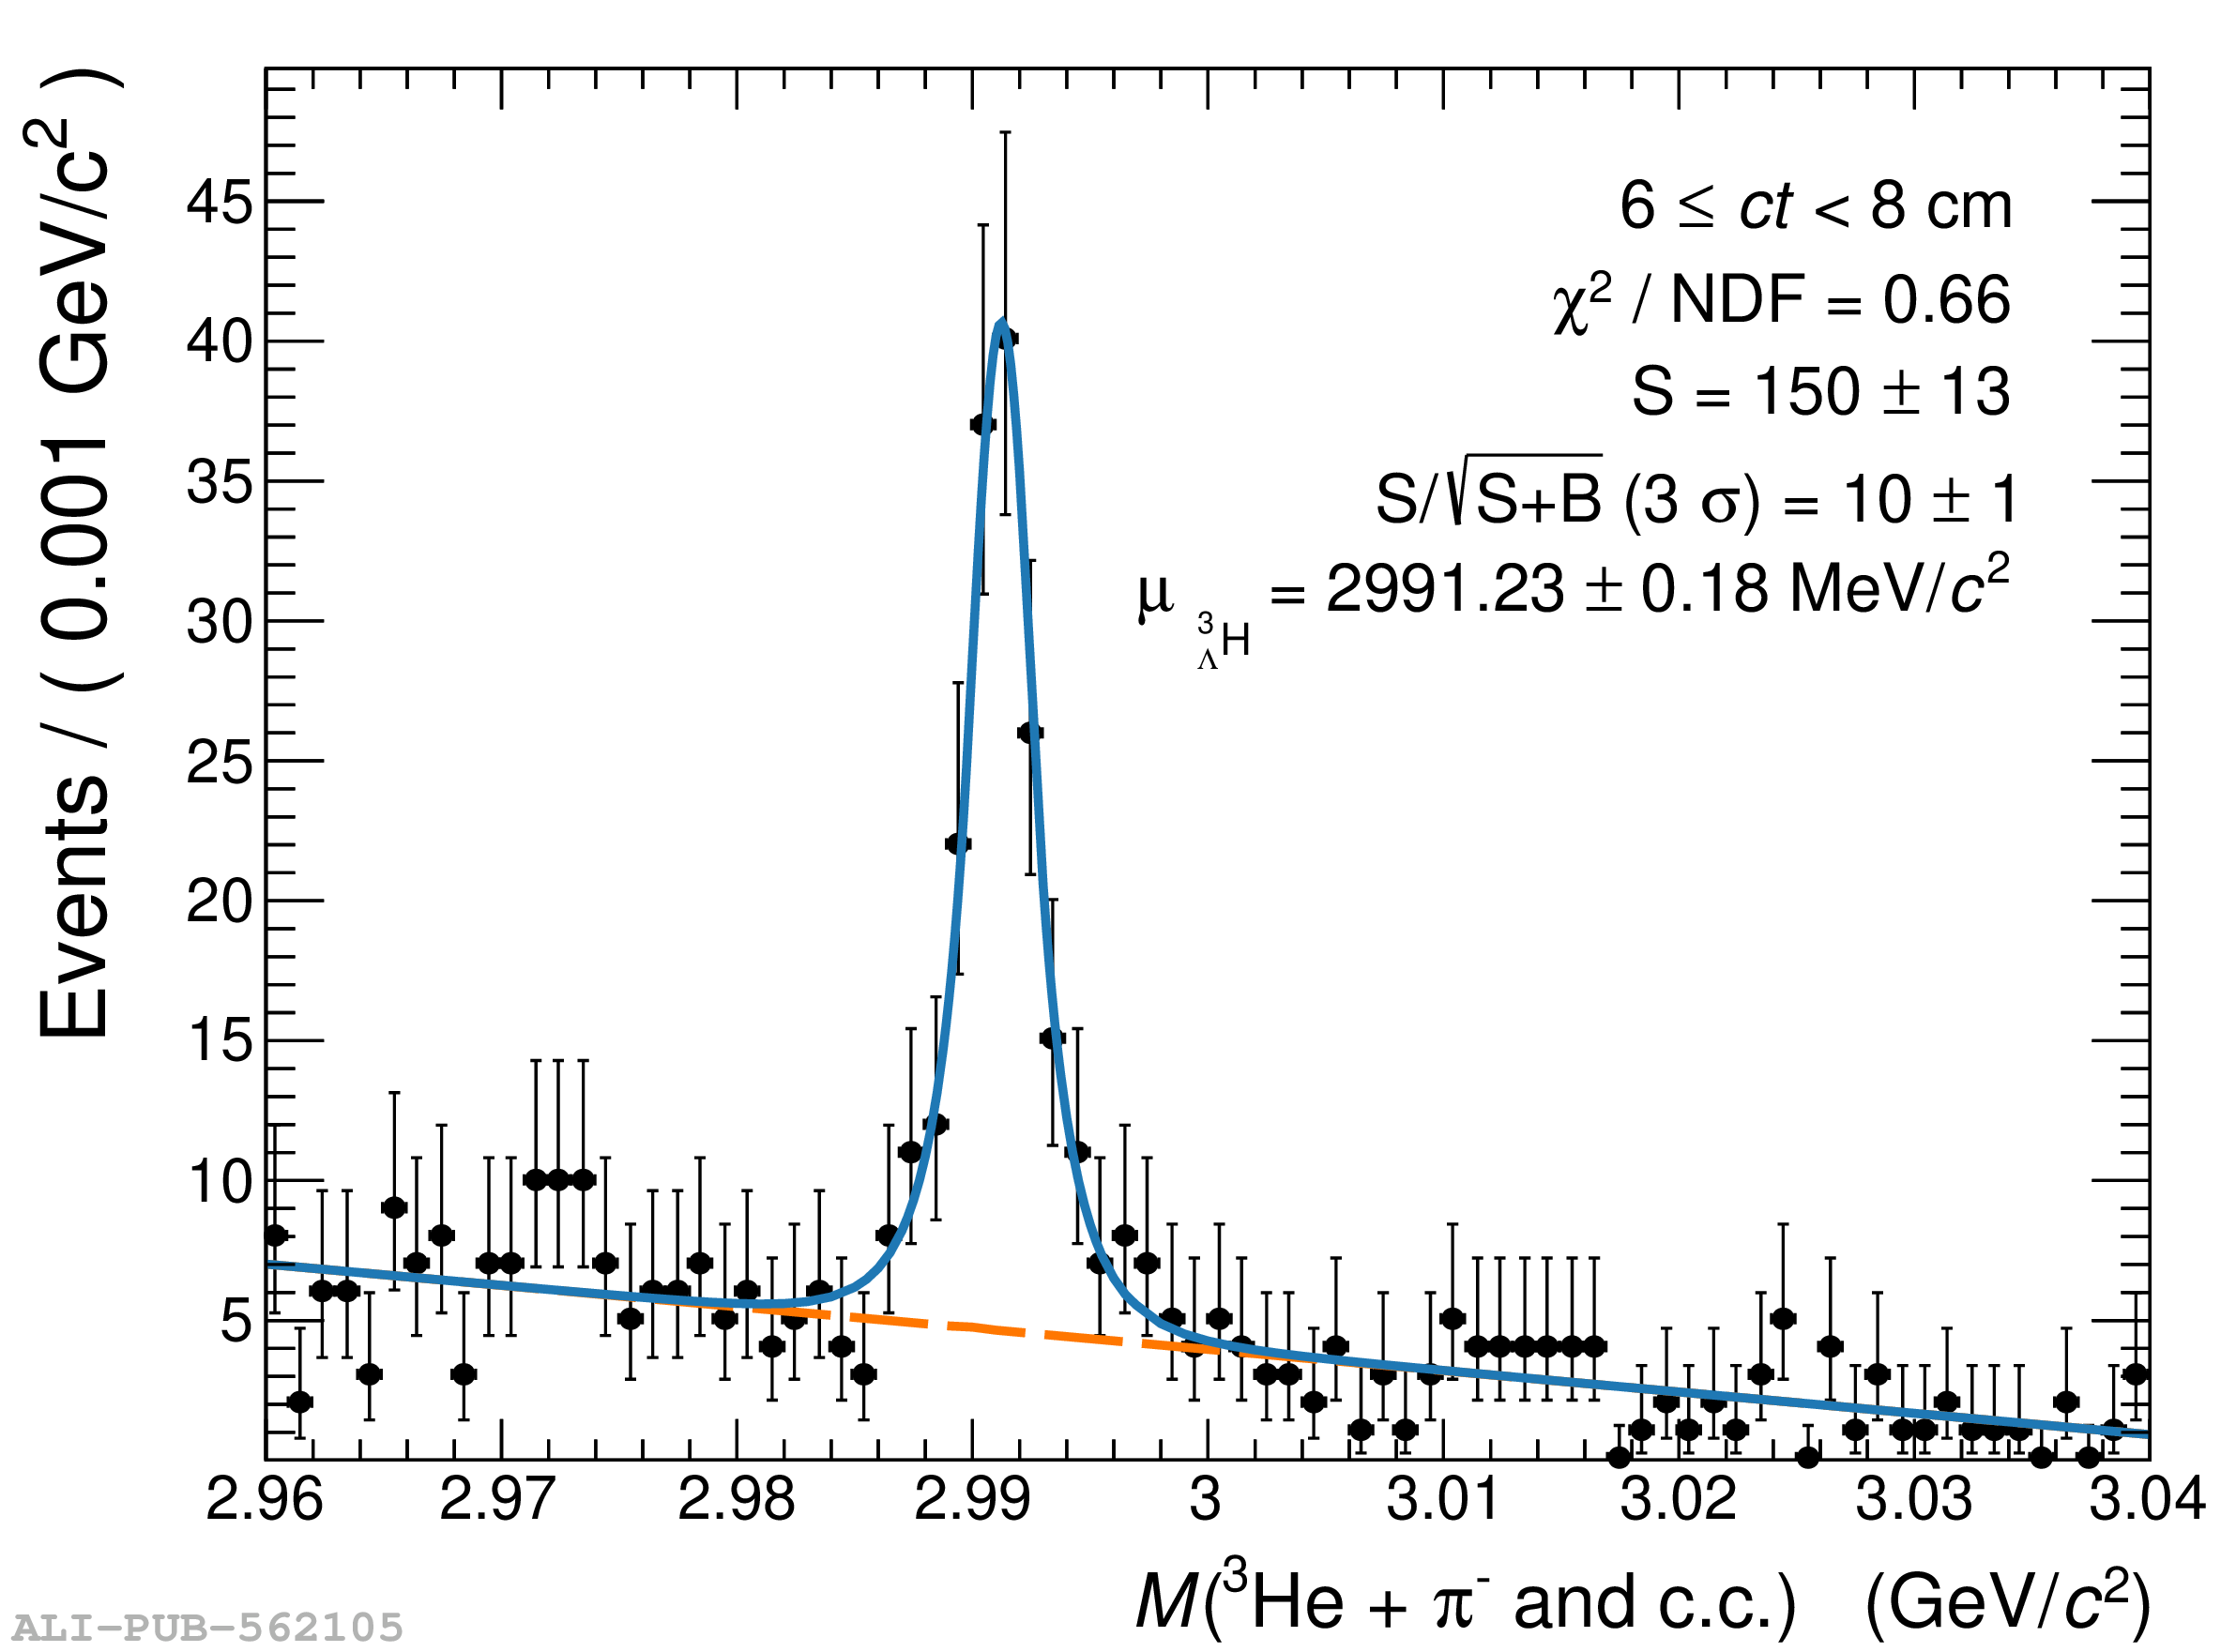 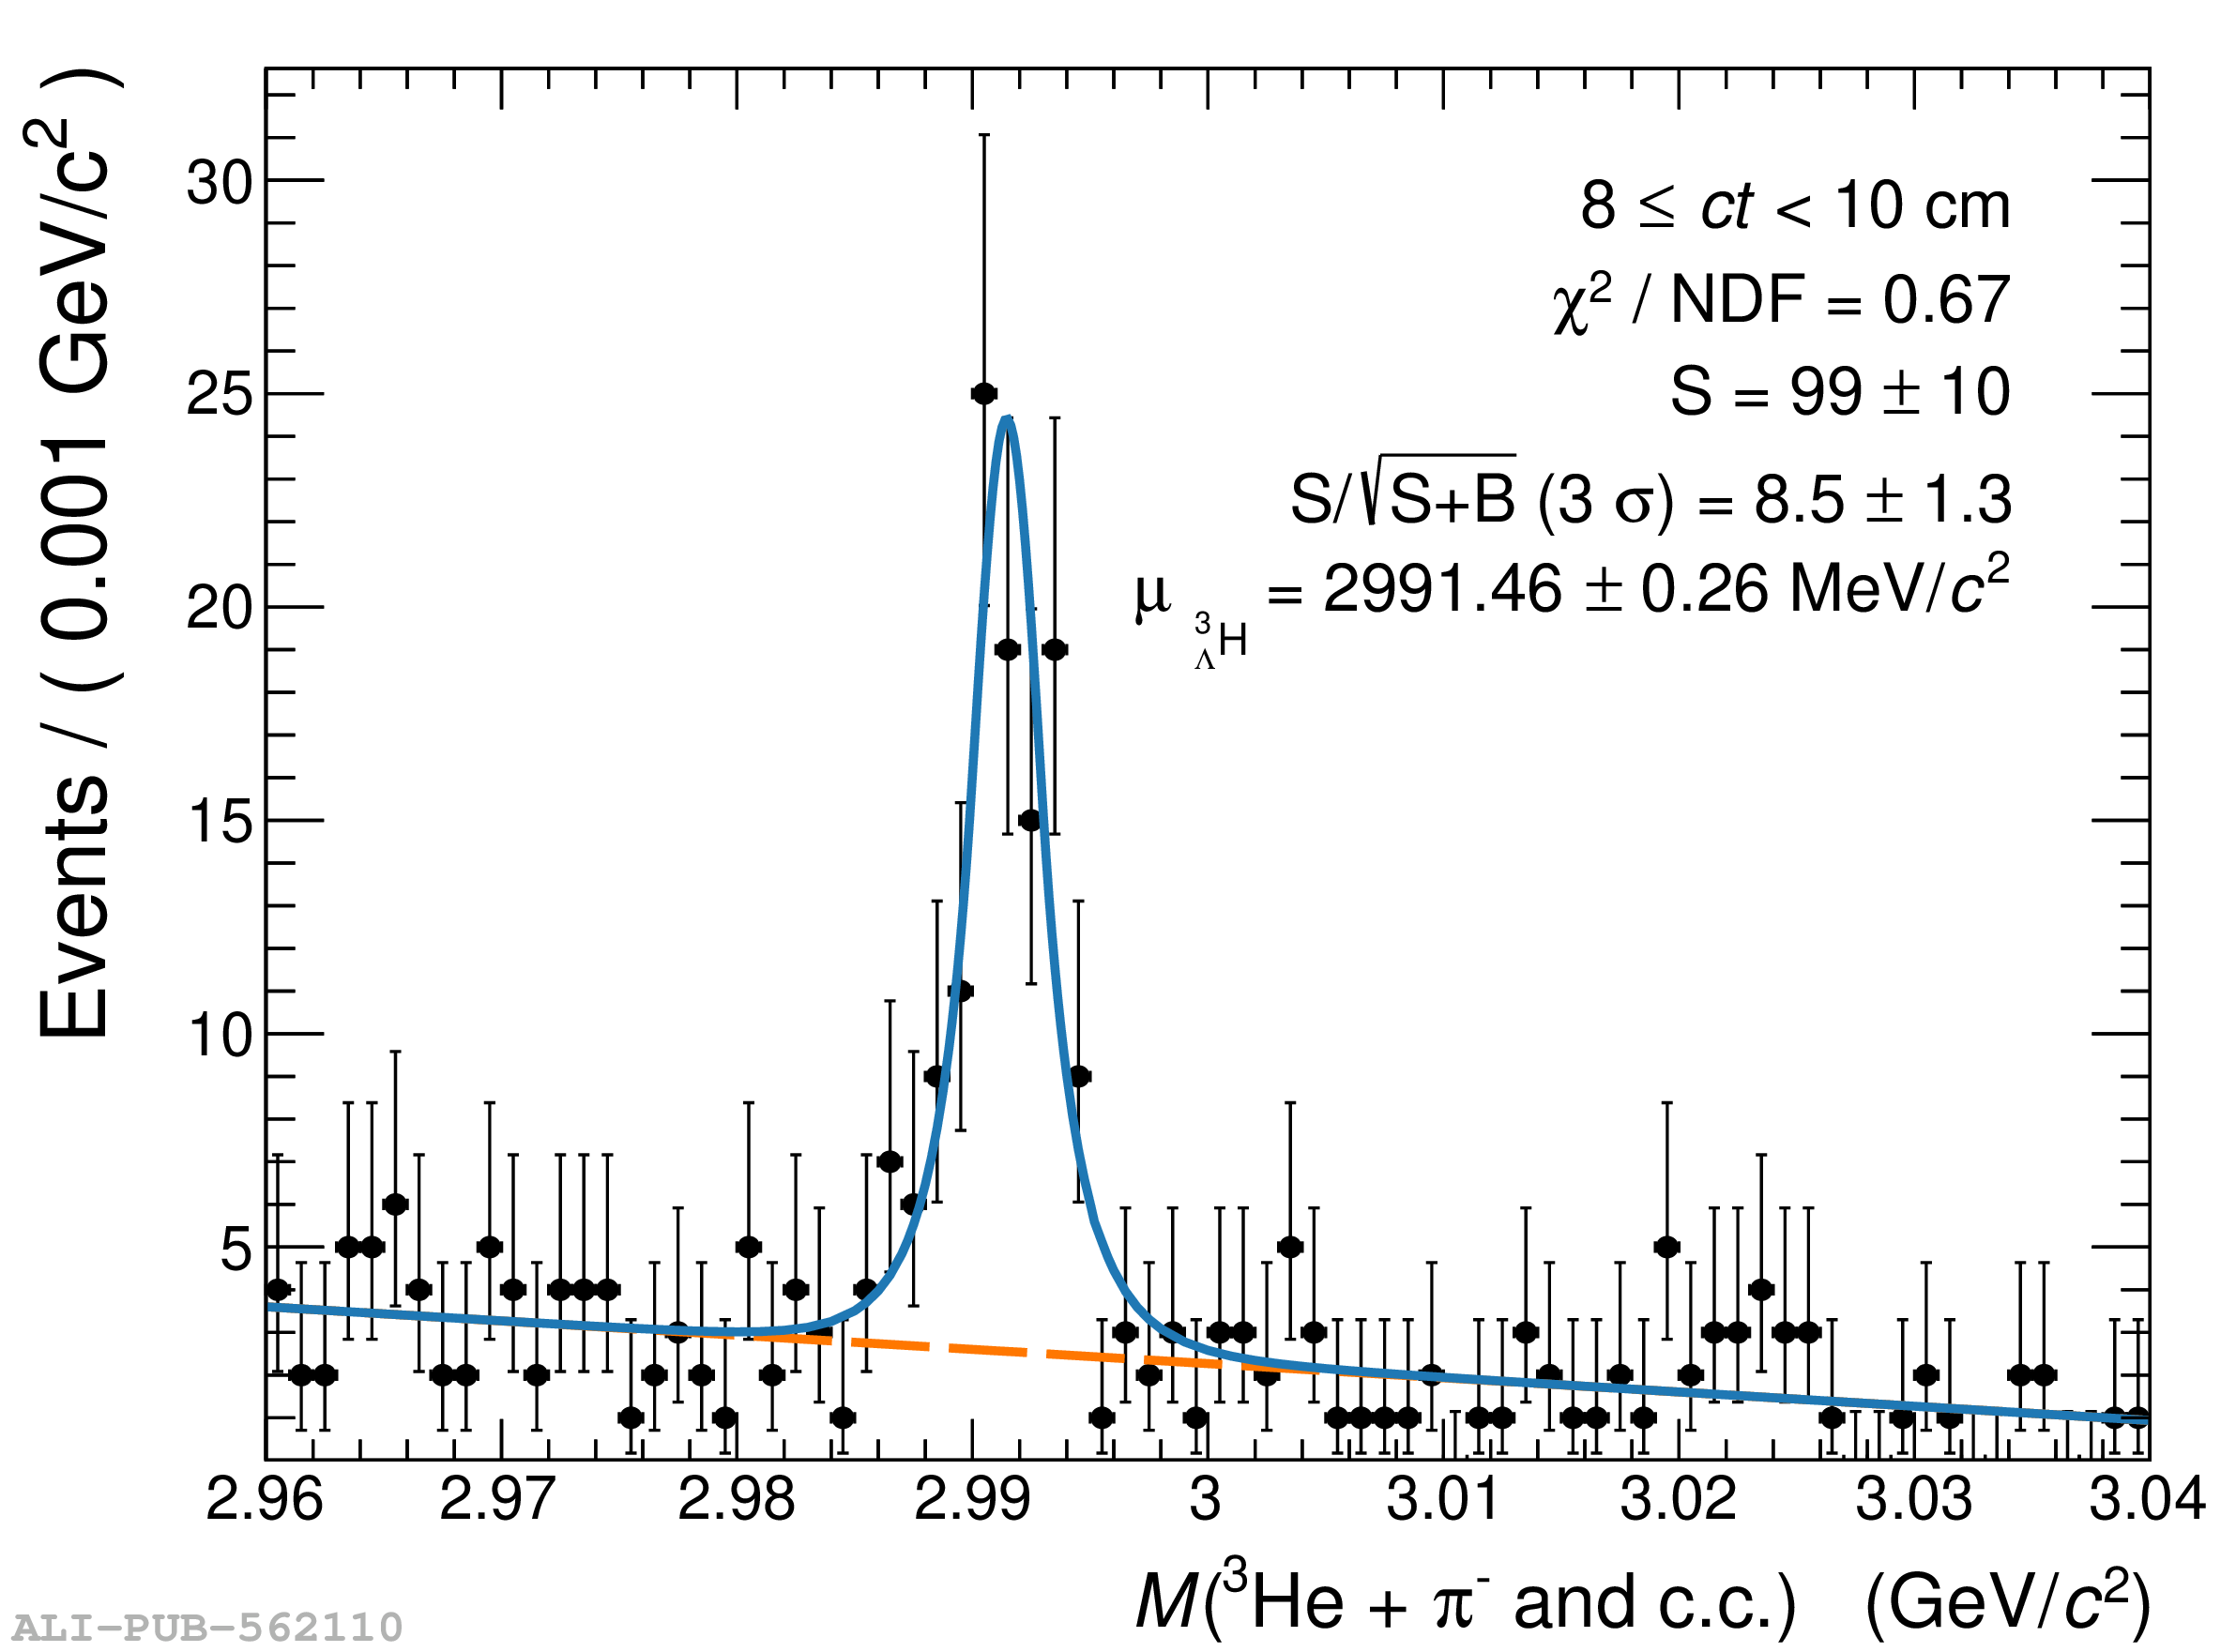 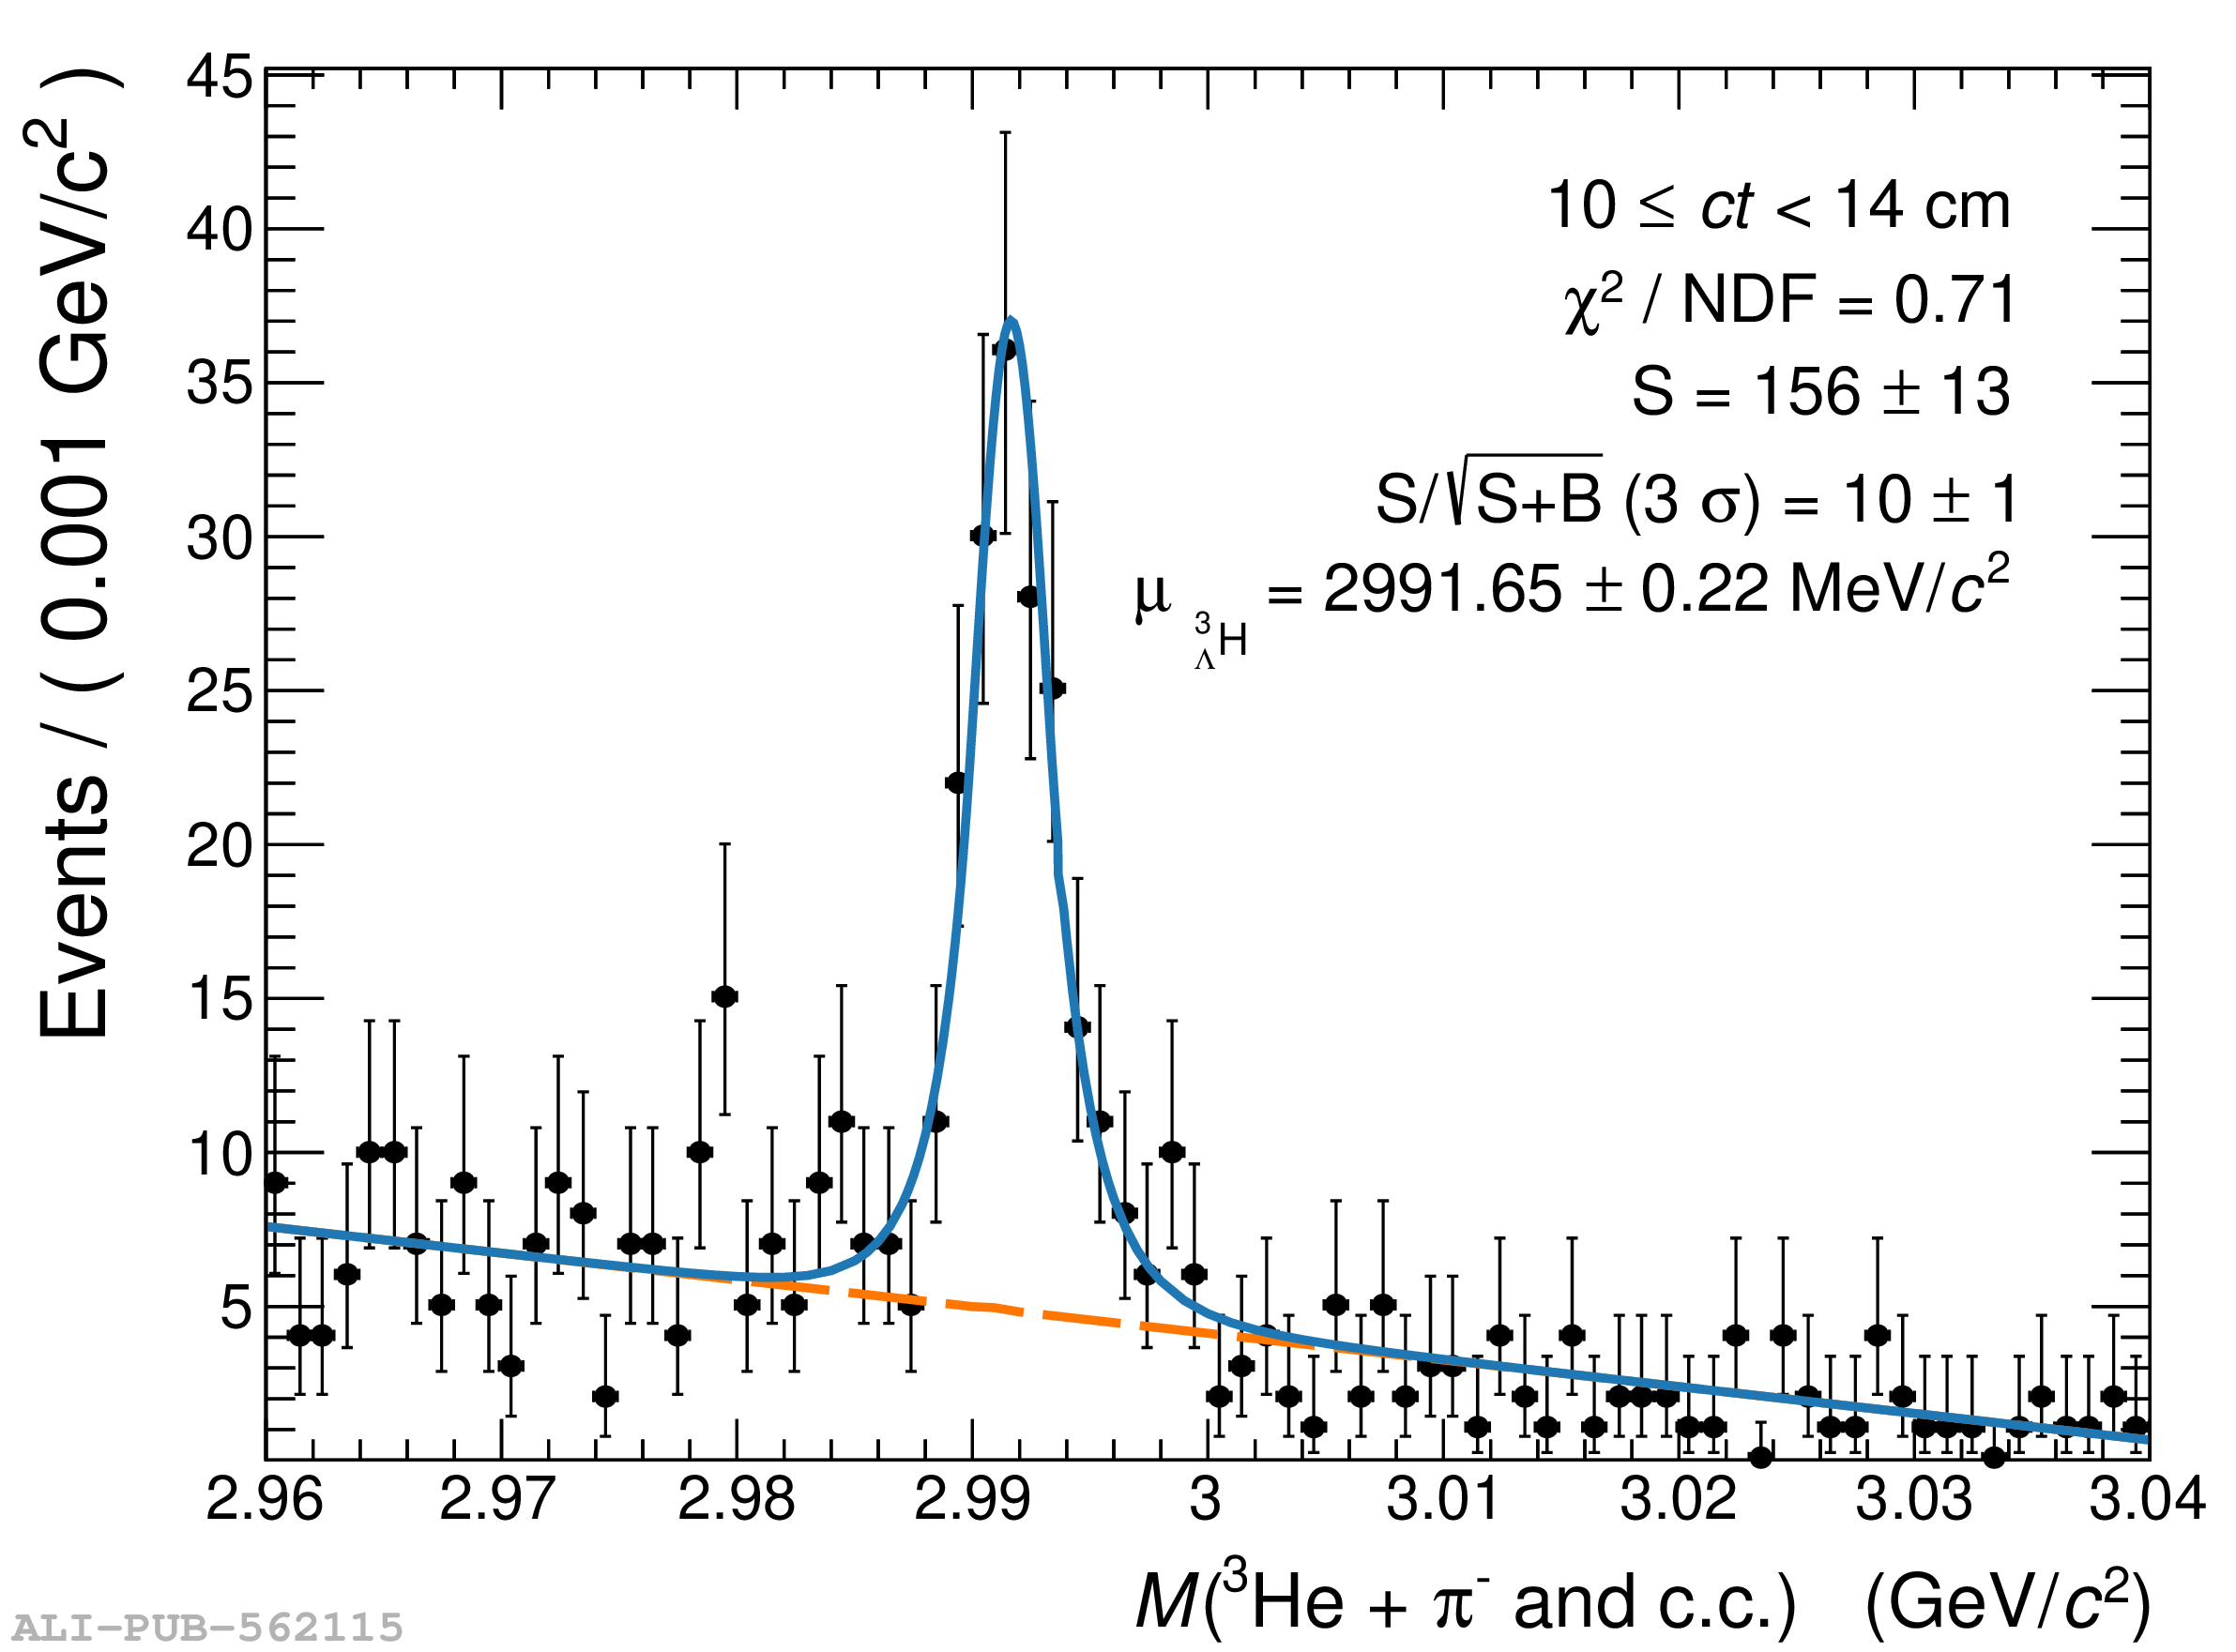 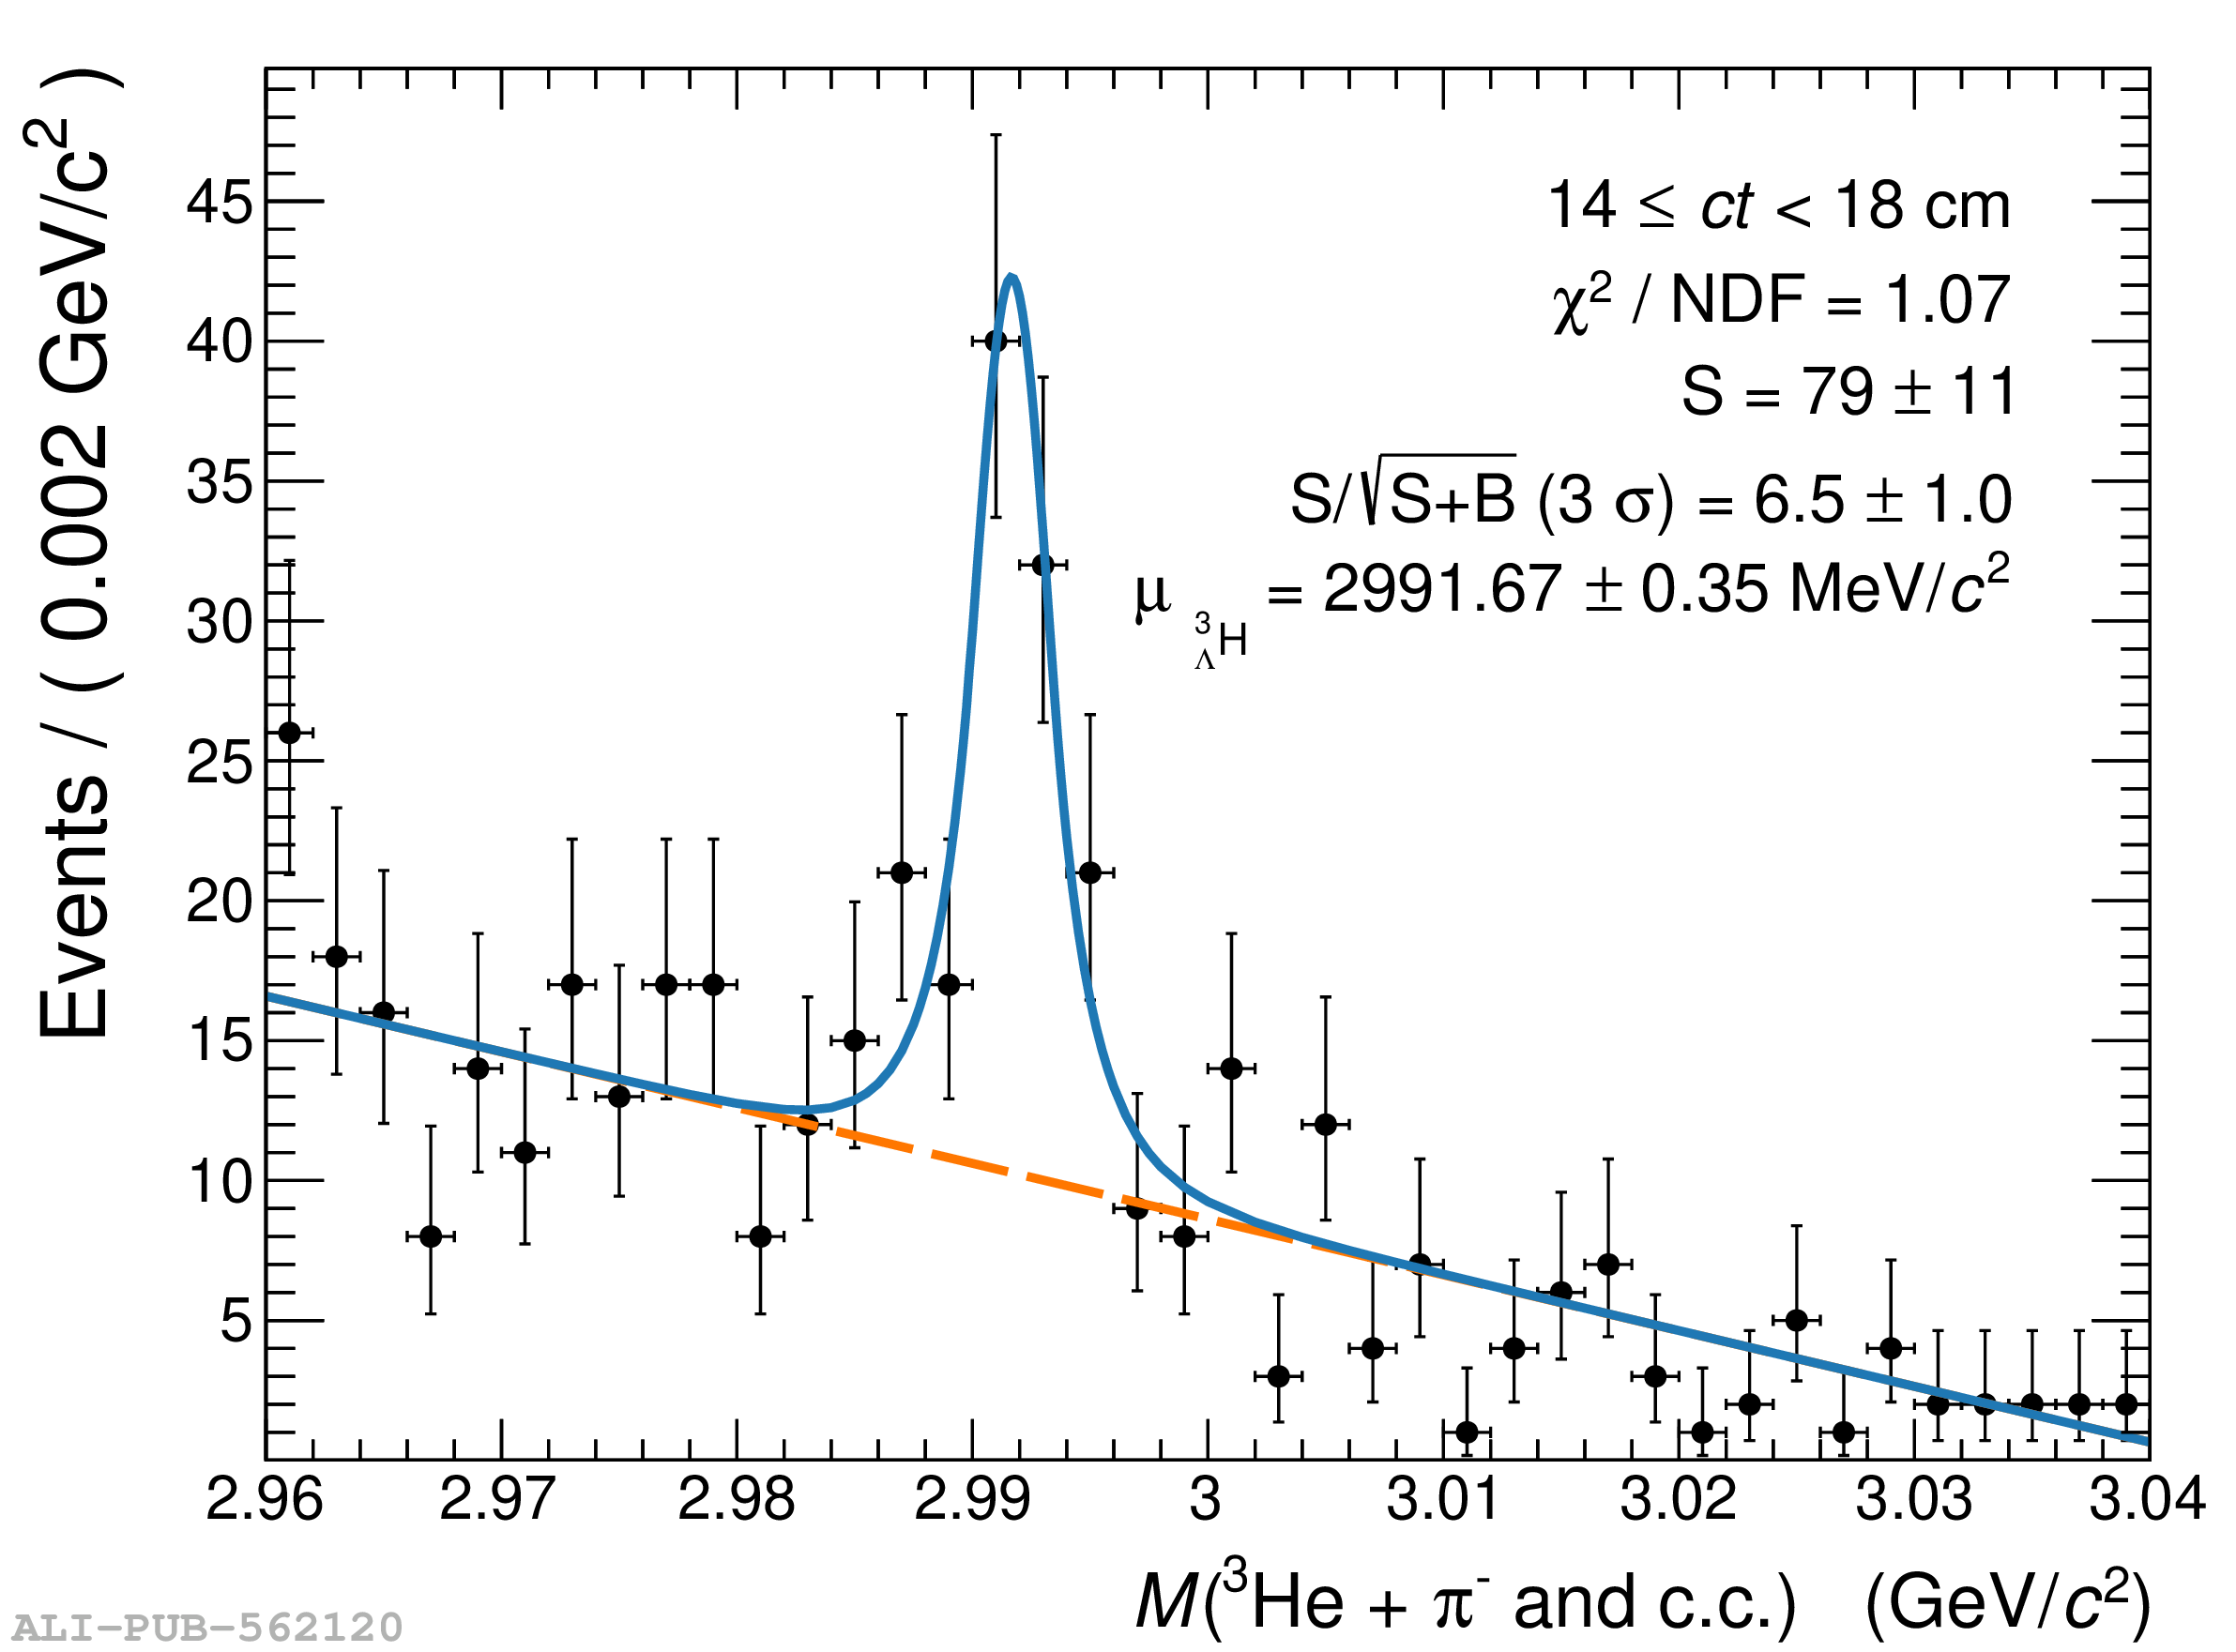 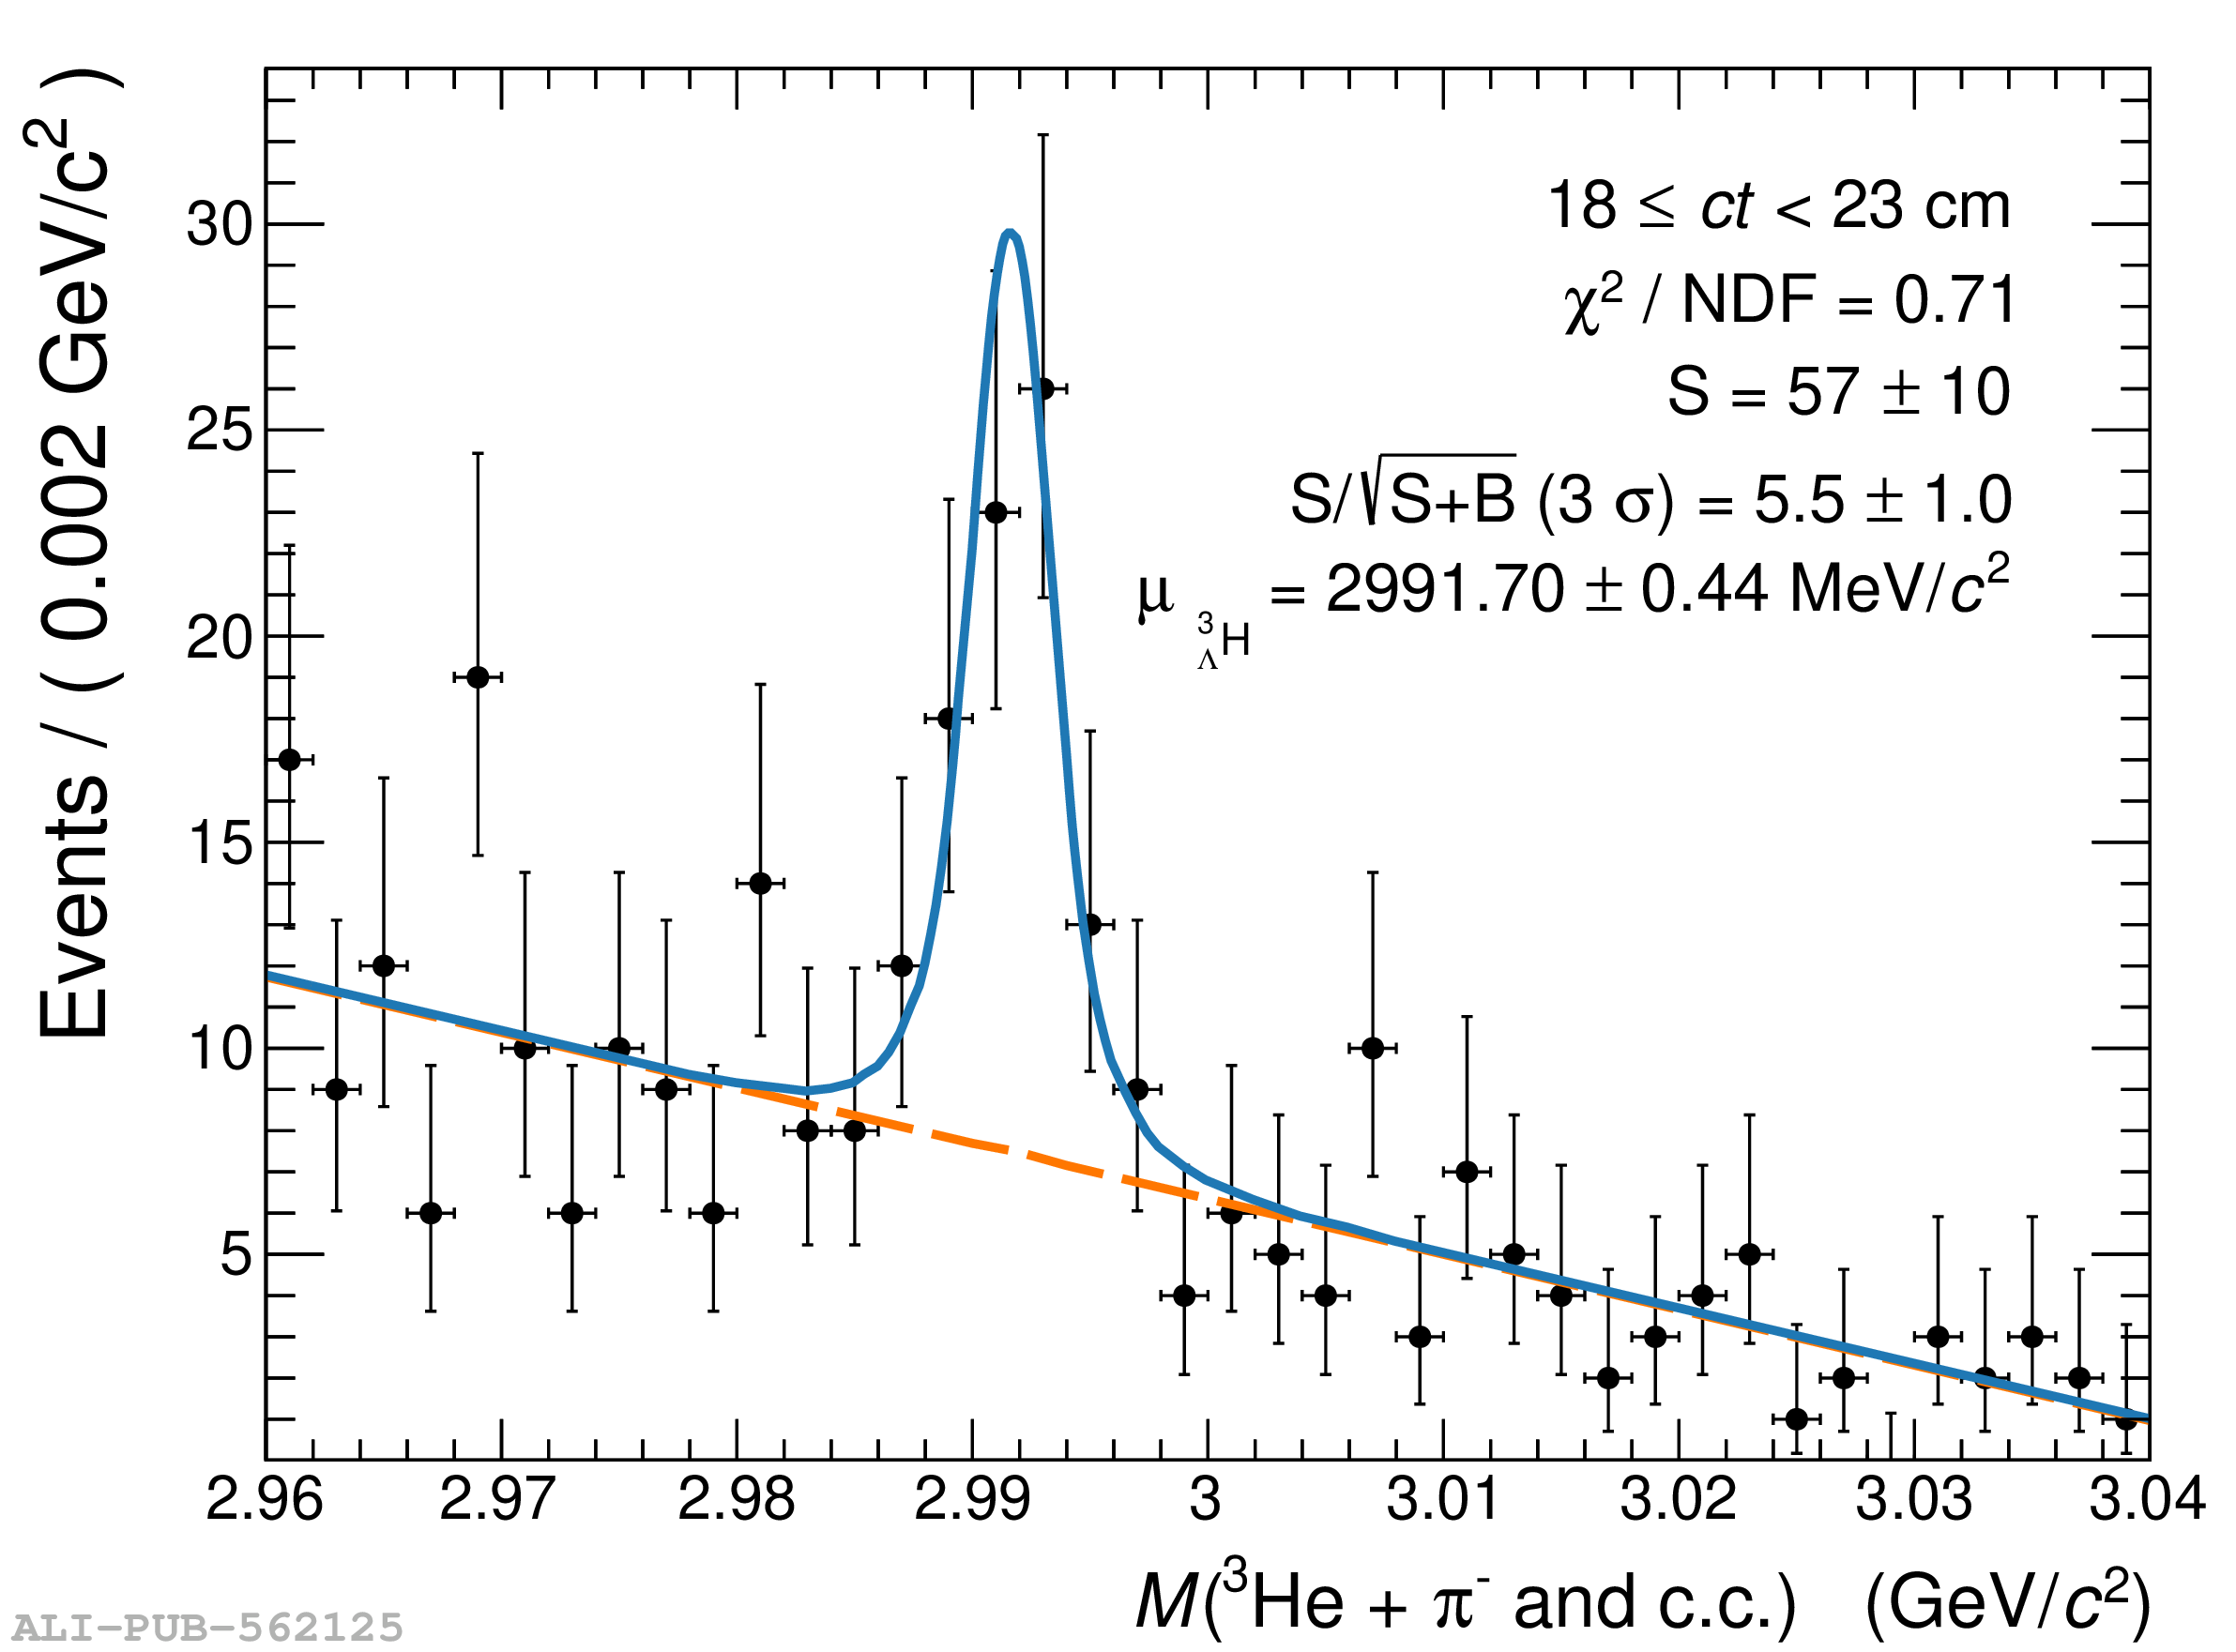 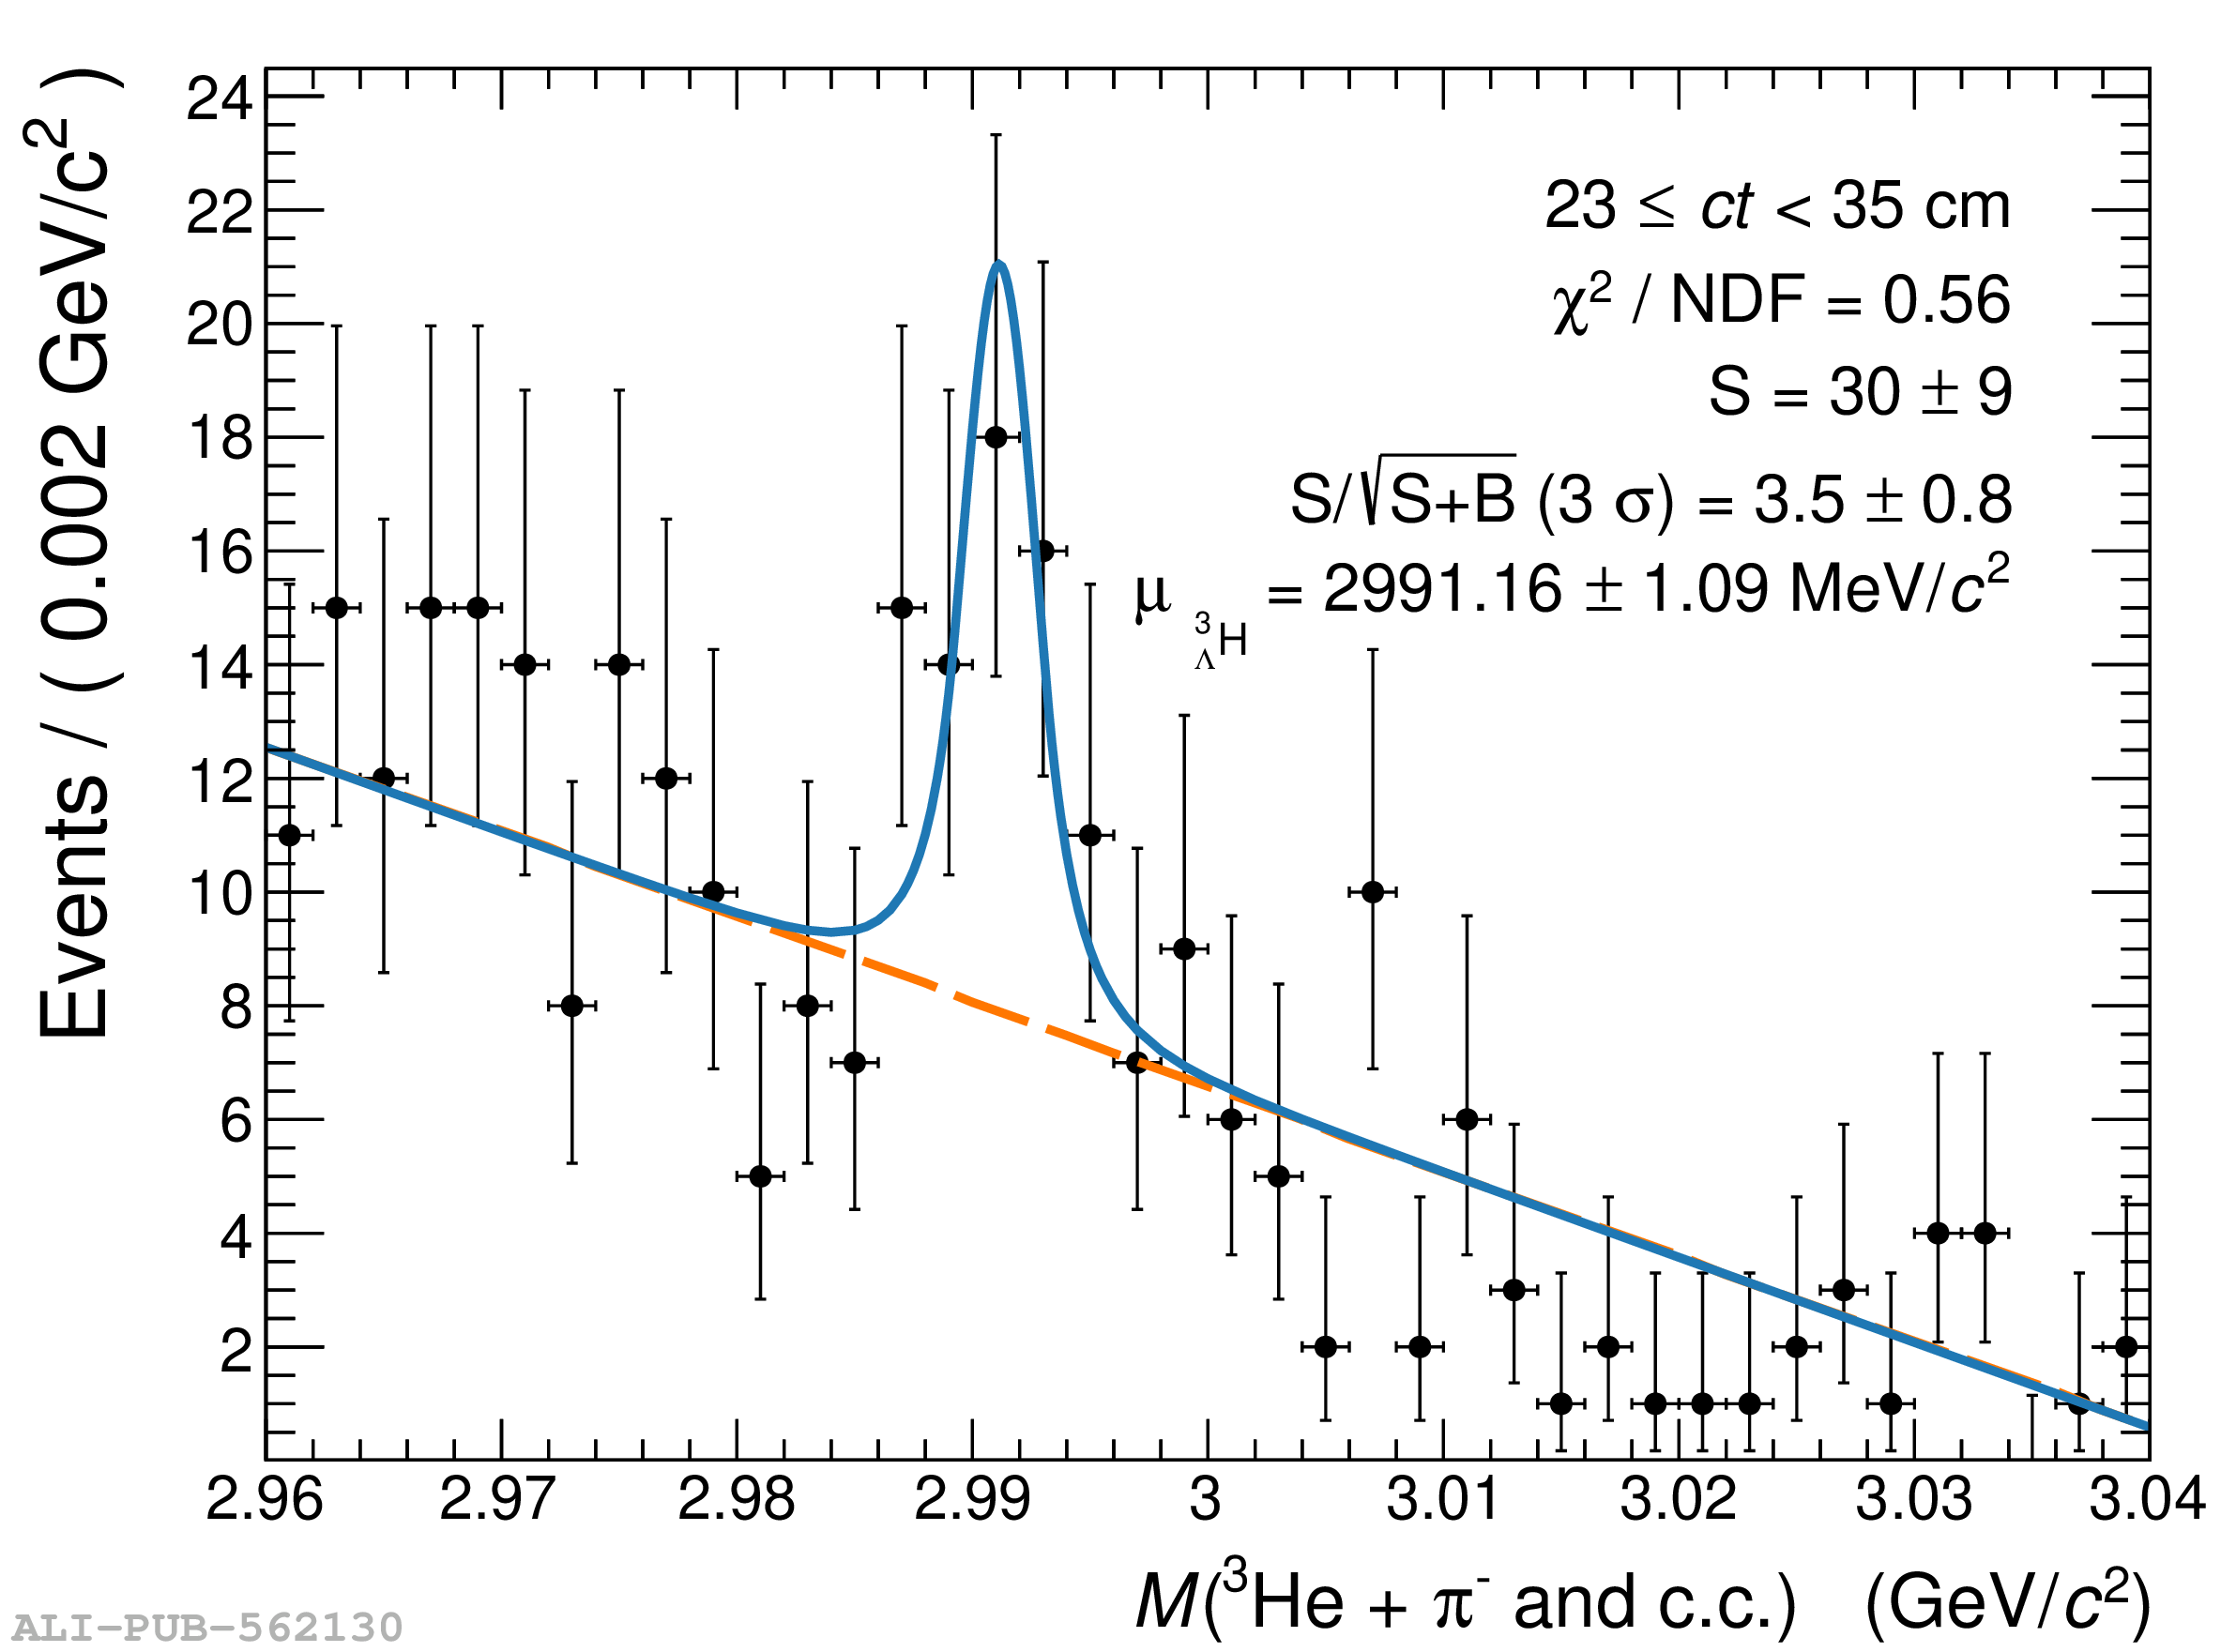 |