Collection of the $^{3}_{\Lambda}{\rm H}$ lifetime (left) and ${\rm B}_{\Lambda}$ (right) measurements obtained with different experimental techniques. The horizontal lines and boxes are the statistical and systematic uncertainties, respectively. The dashed and dash-dotted lines are the corresponding theoretical predictions. Two predictions are reported in: prediction A assumes ${\rm B}_{\Lambda} = 130$ keV, while prediction B assumes ${\rm B}_{\Lambda} = 69$ keV. |  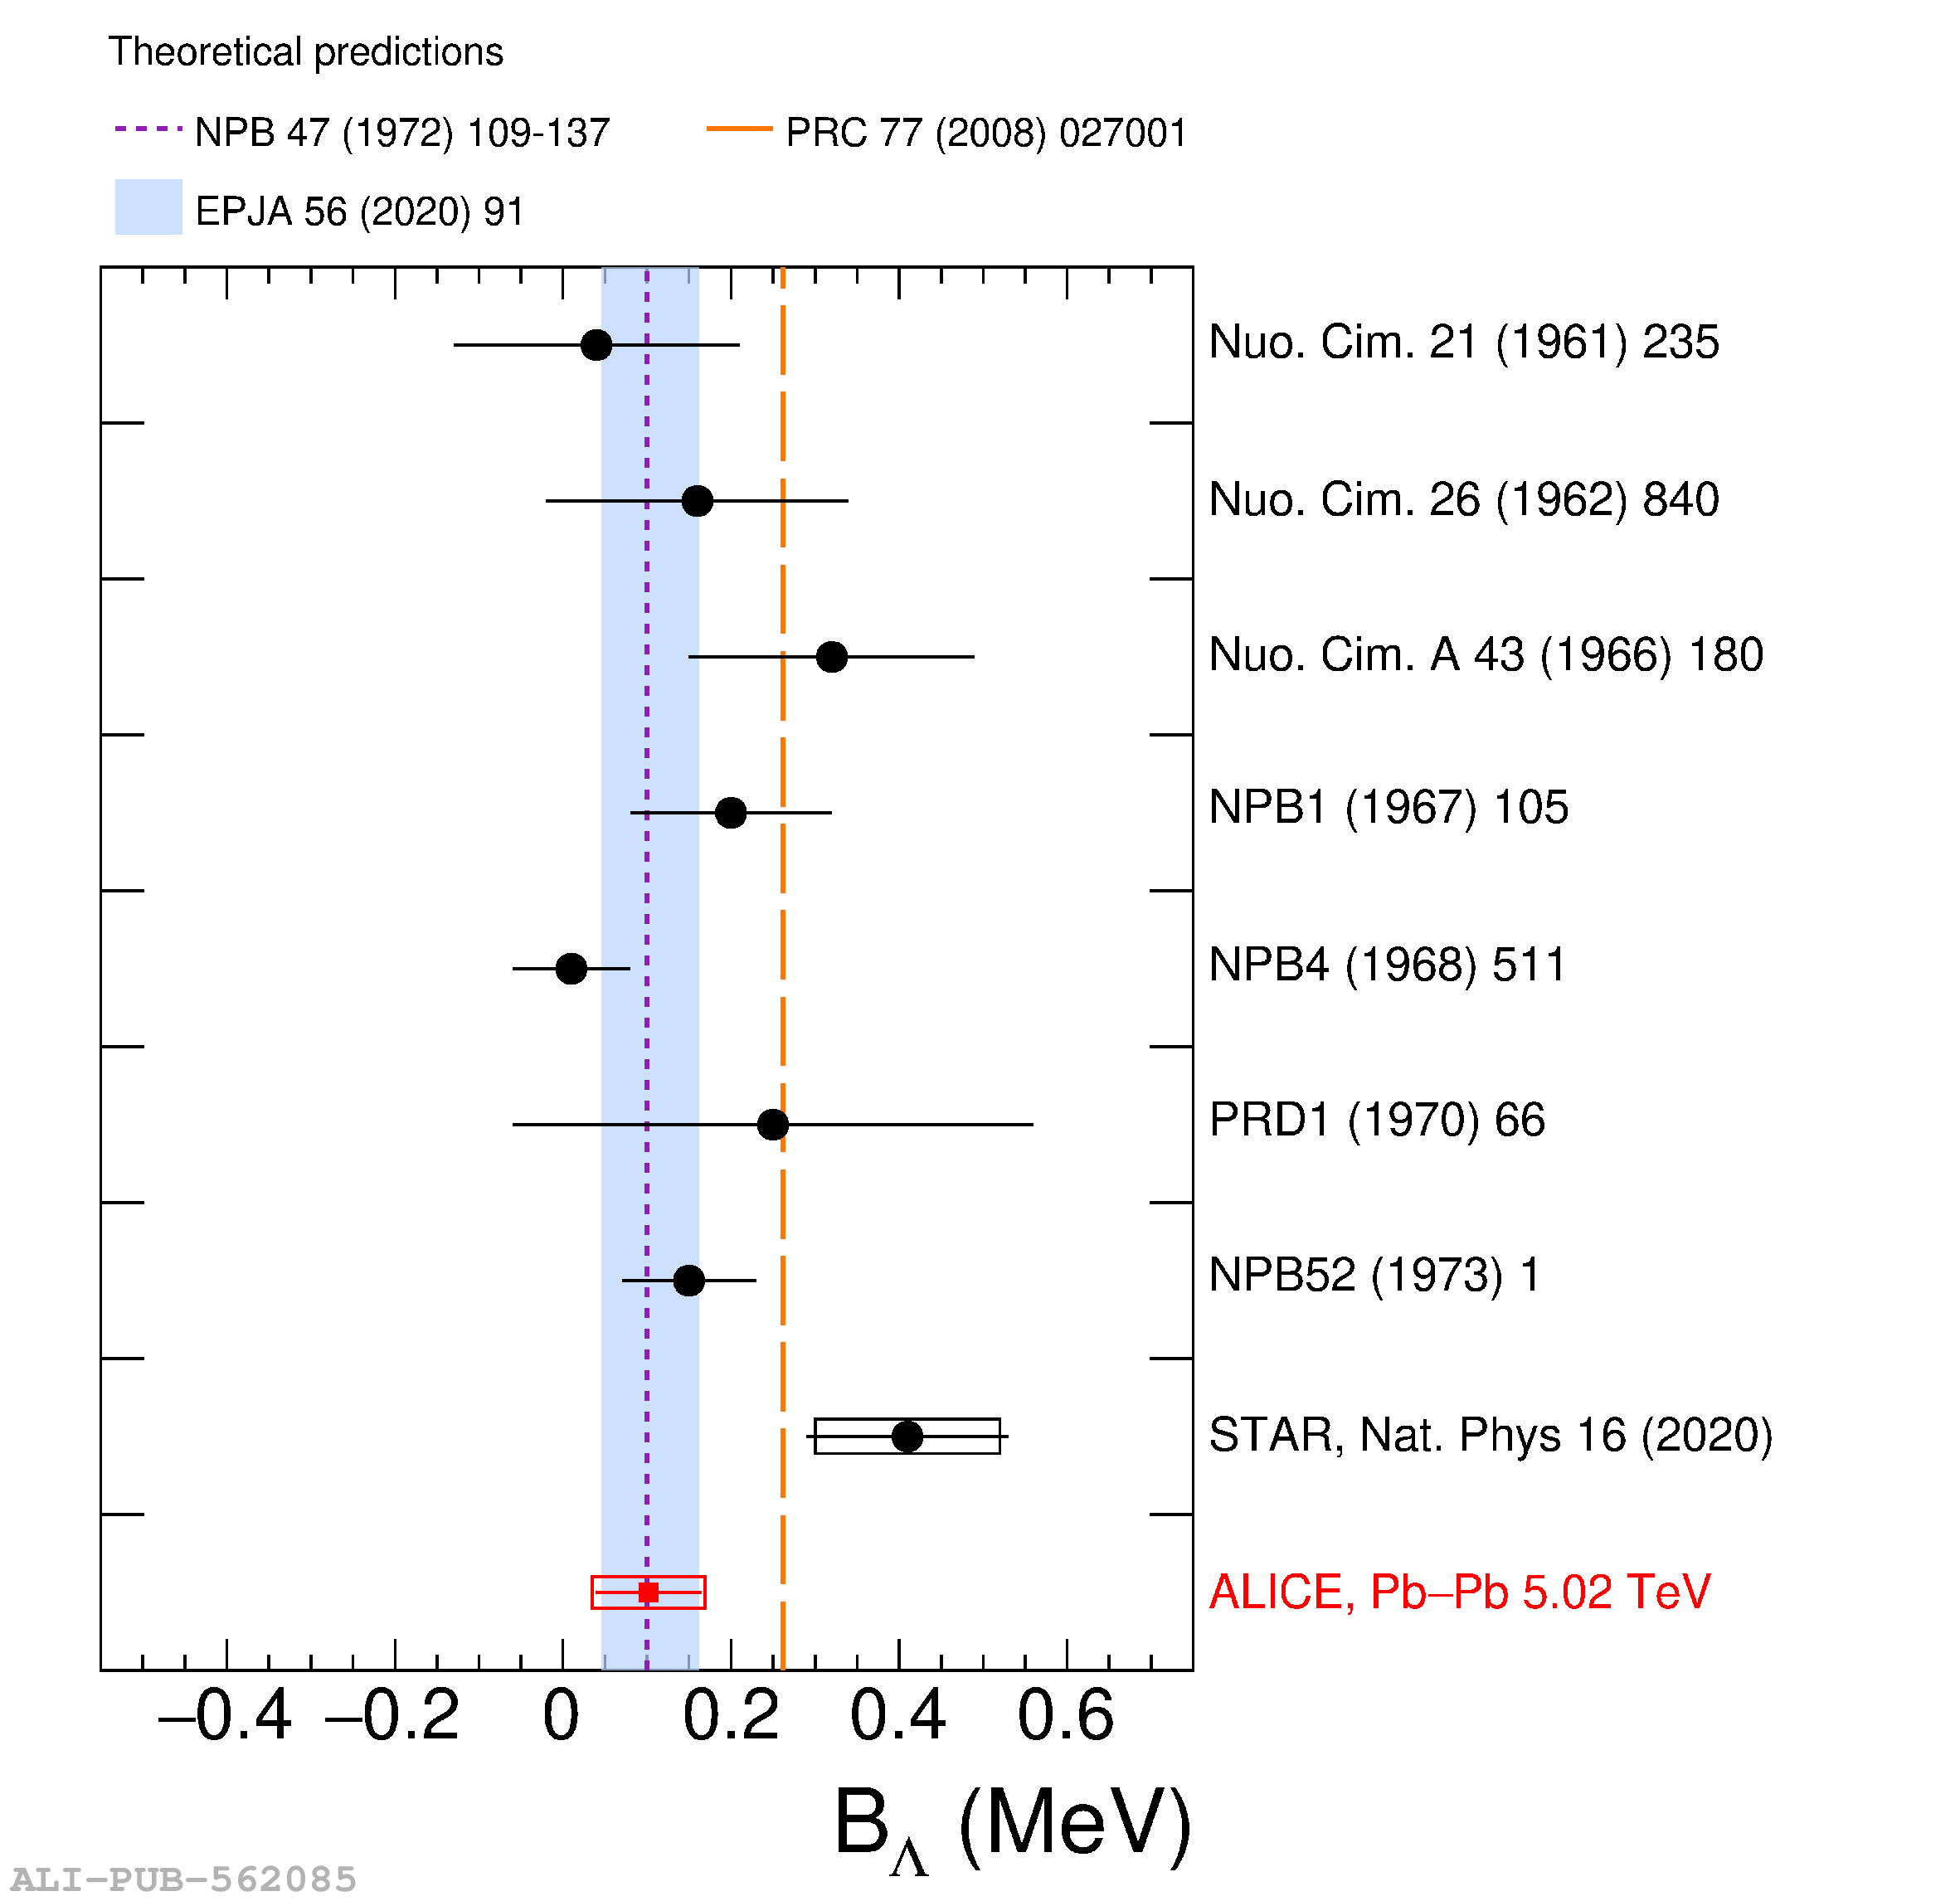 |