Invariant mass ($M$) distributions of $\Lambda_{\rm c}^+ \rightarrow {\rm pK^0_S} \rightarrow {\rm p}\pi^+\pi^-$ candidates and charge conjugates in different $p_{\rm T}$ intervals in central (0$-$10%; top) and mid-central (30$-$50%; bottom) Pb$-$Pb collisions at $\sqrt{s_{\rm NN}}$ = 5.02 TeV. The blue solid lines show the total fit functions and the red dashed lines are the combinatorial-background terms. The values of the mean ($\mu$) and the width ($\sigma$) of the signal peak are reported together with the signal counts ($S$) and the signal-over-background ratio ($S/B$) in the mass interval ($\mu-3\sigma,\mu+3\sigma$). | 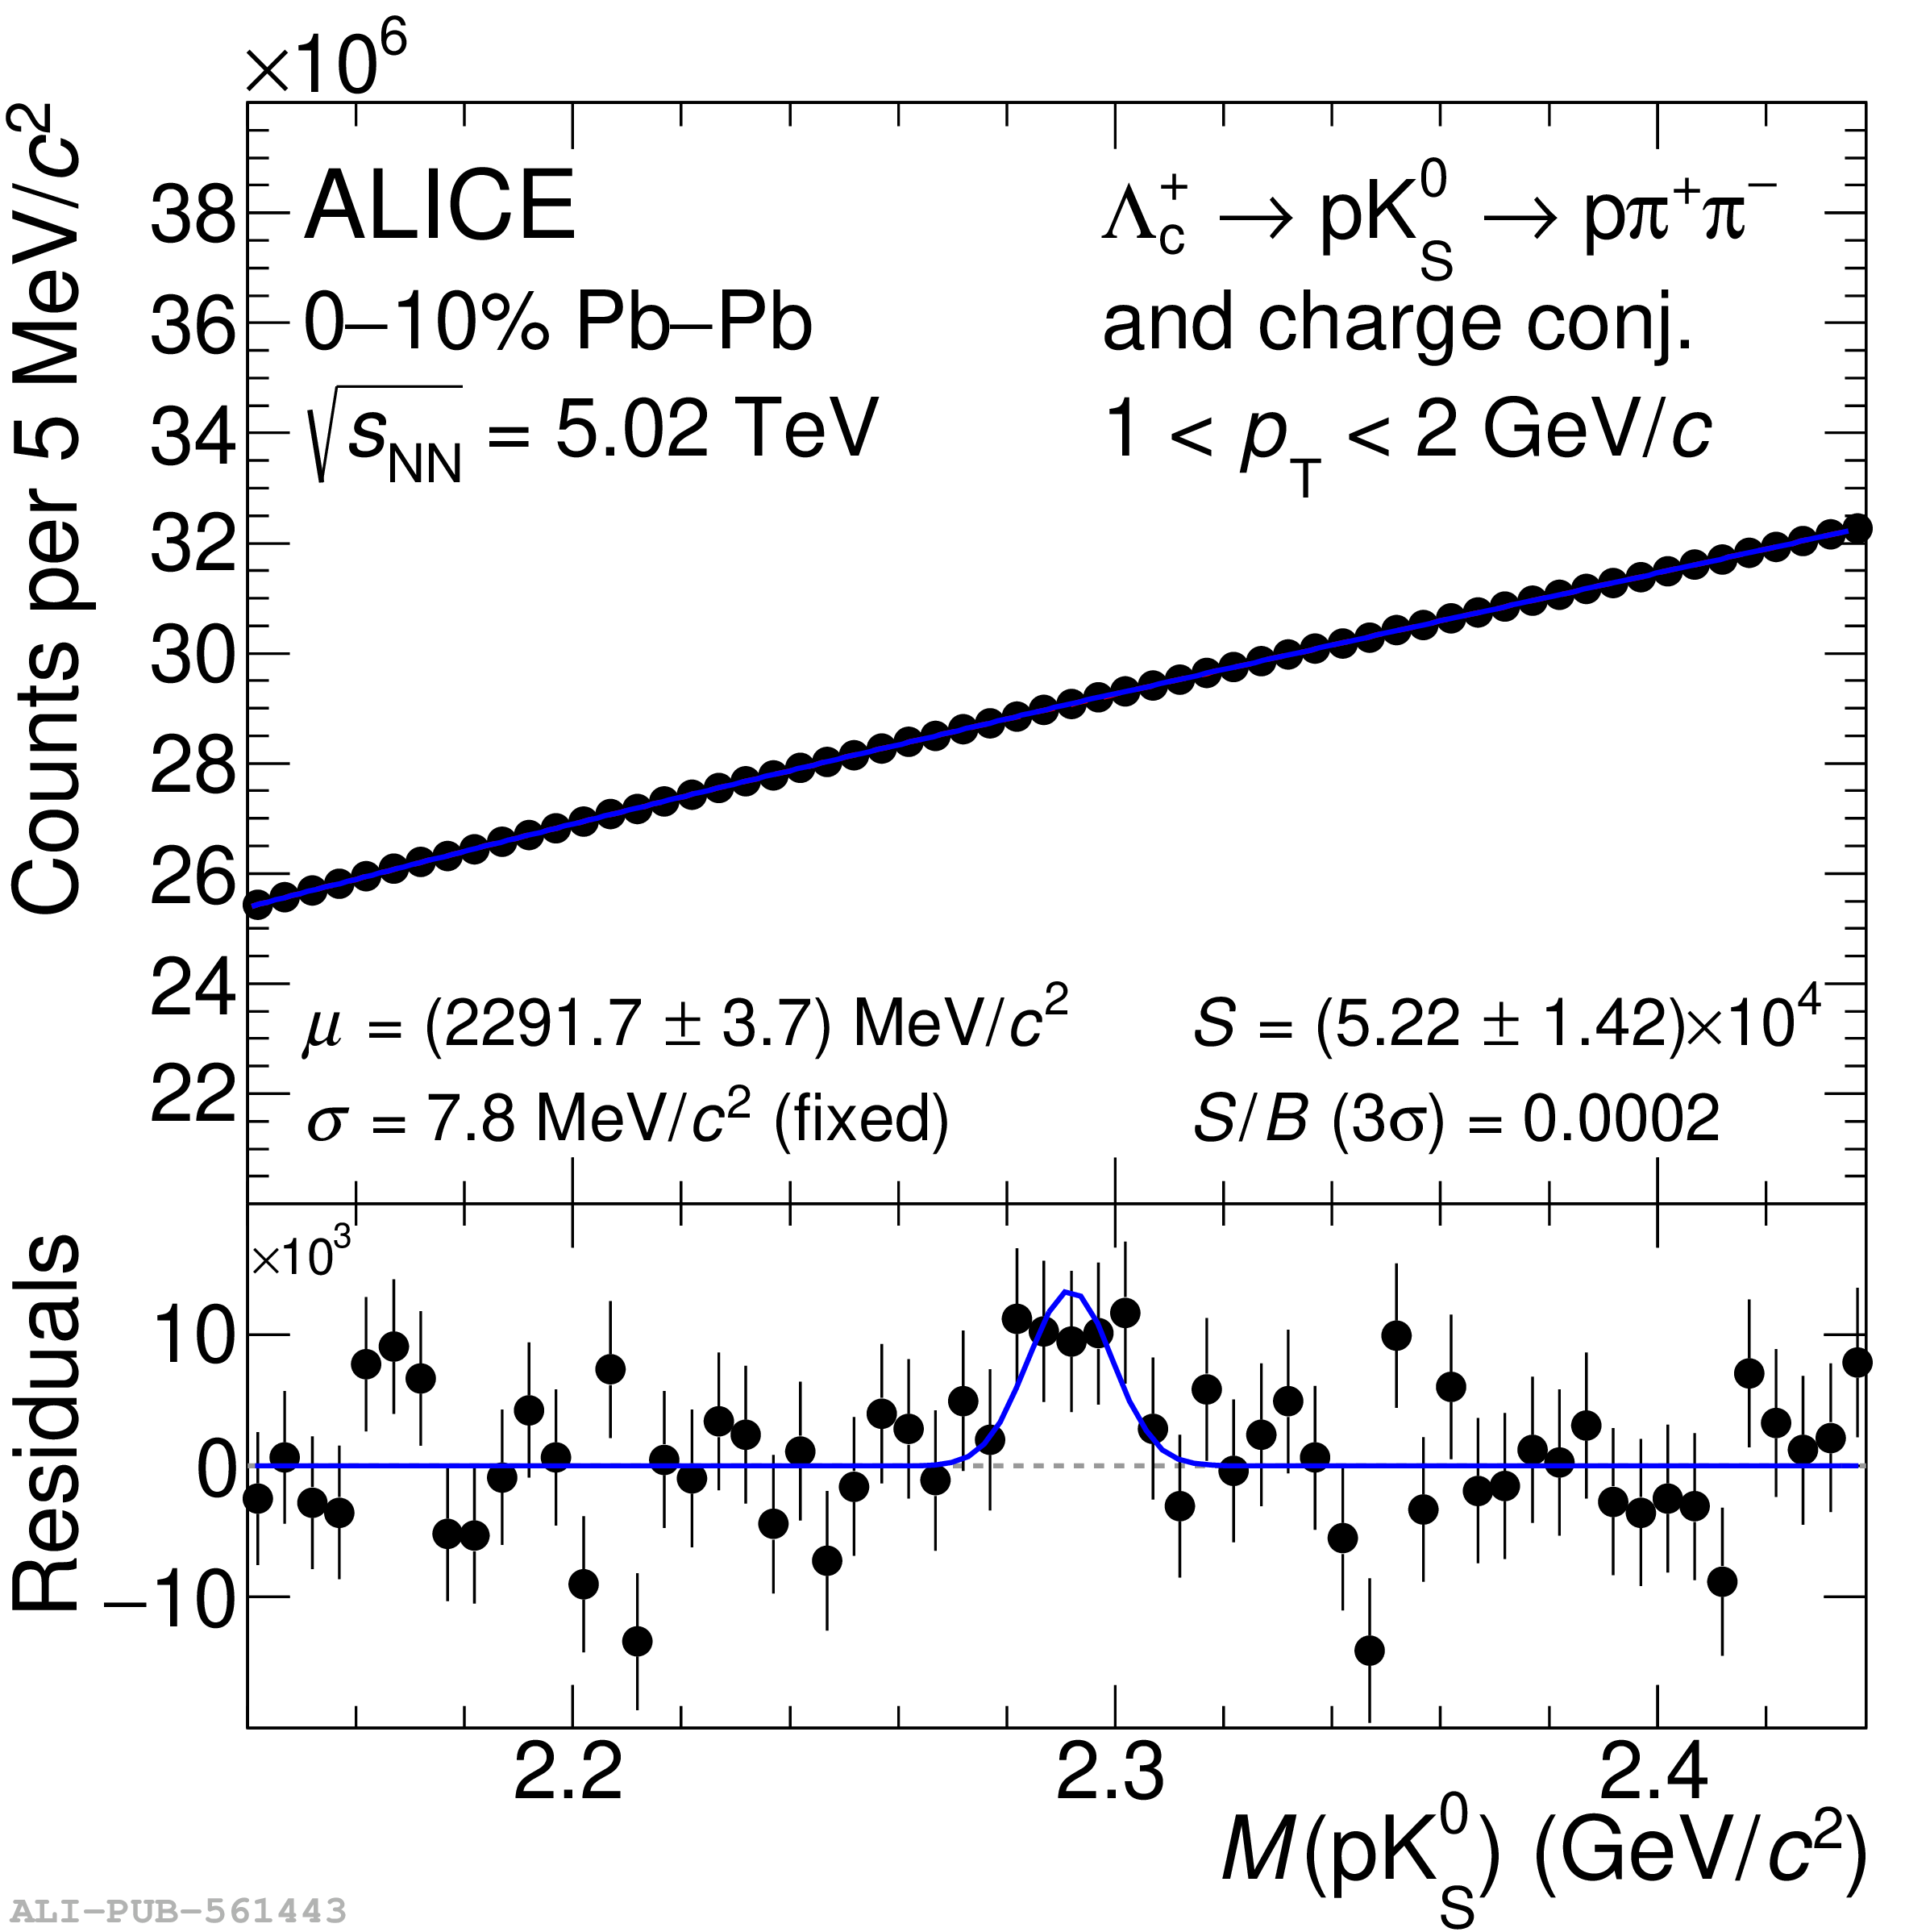 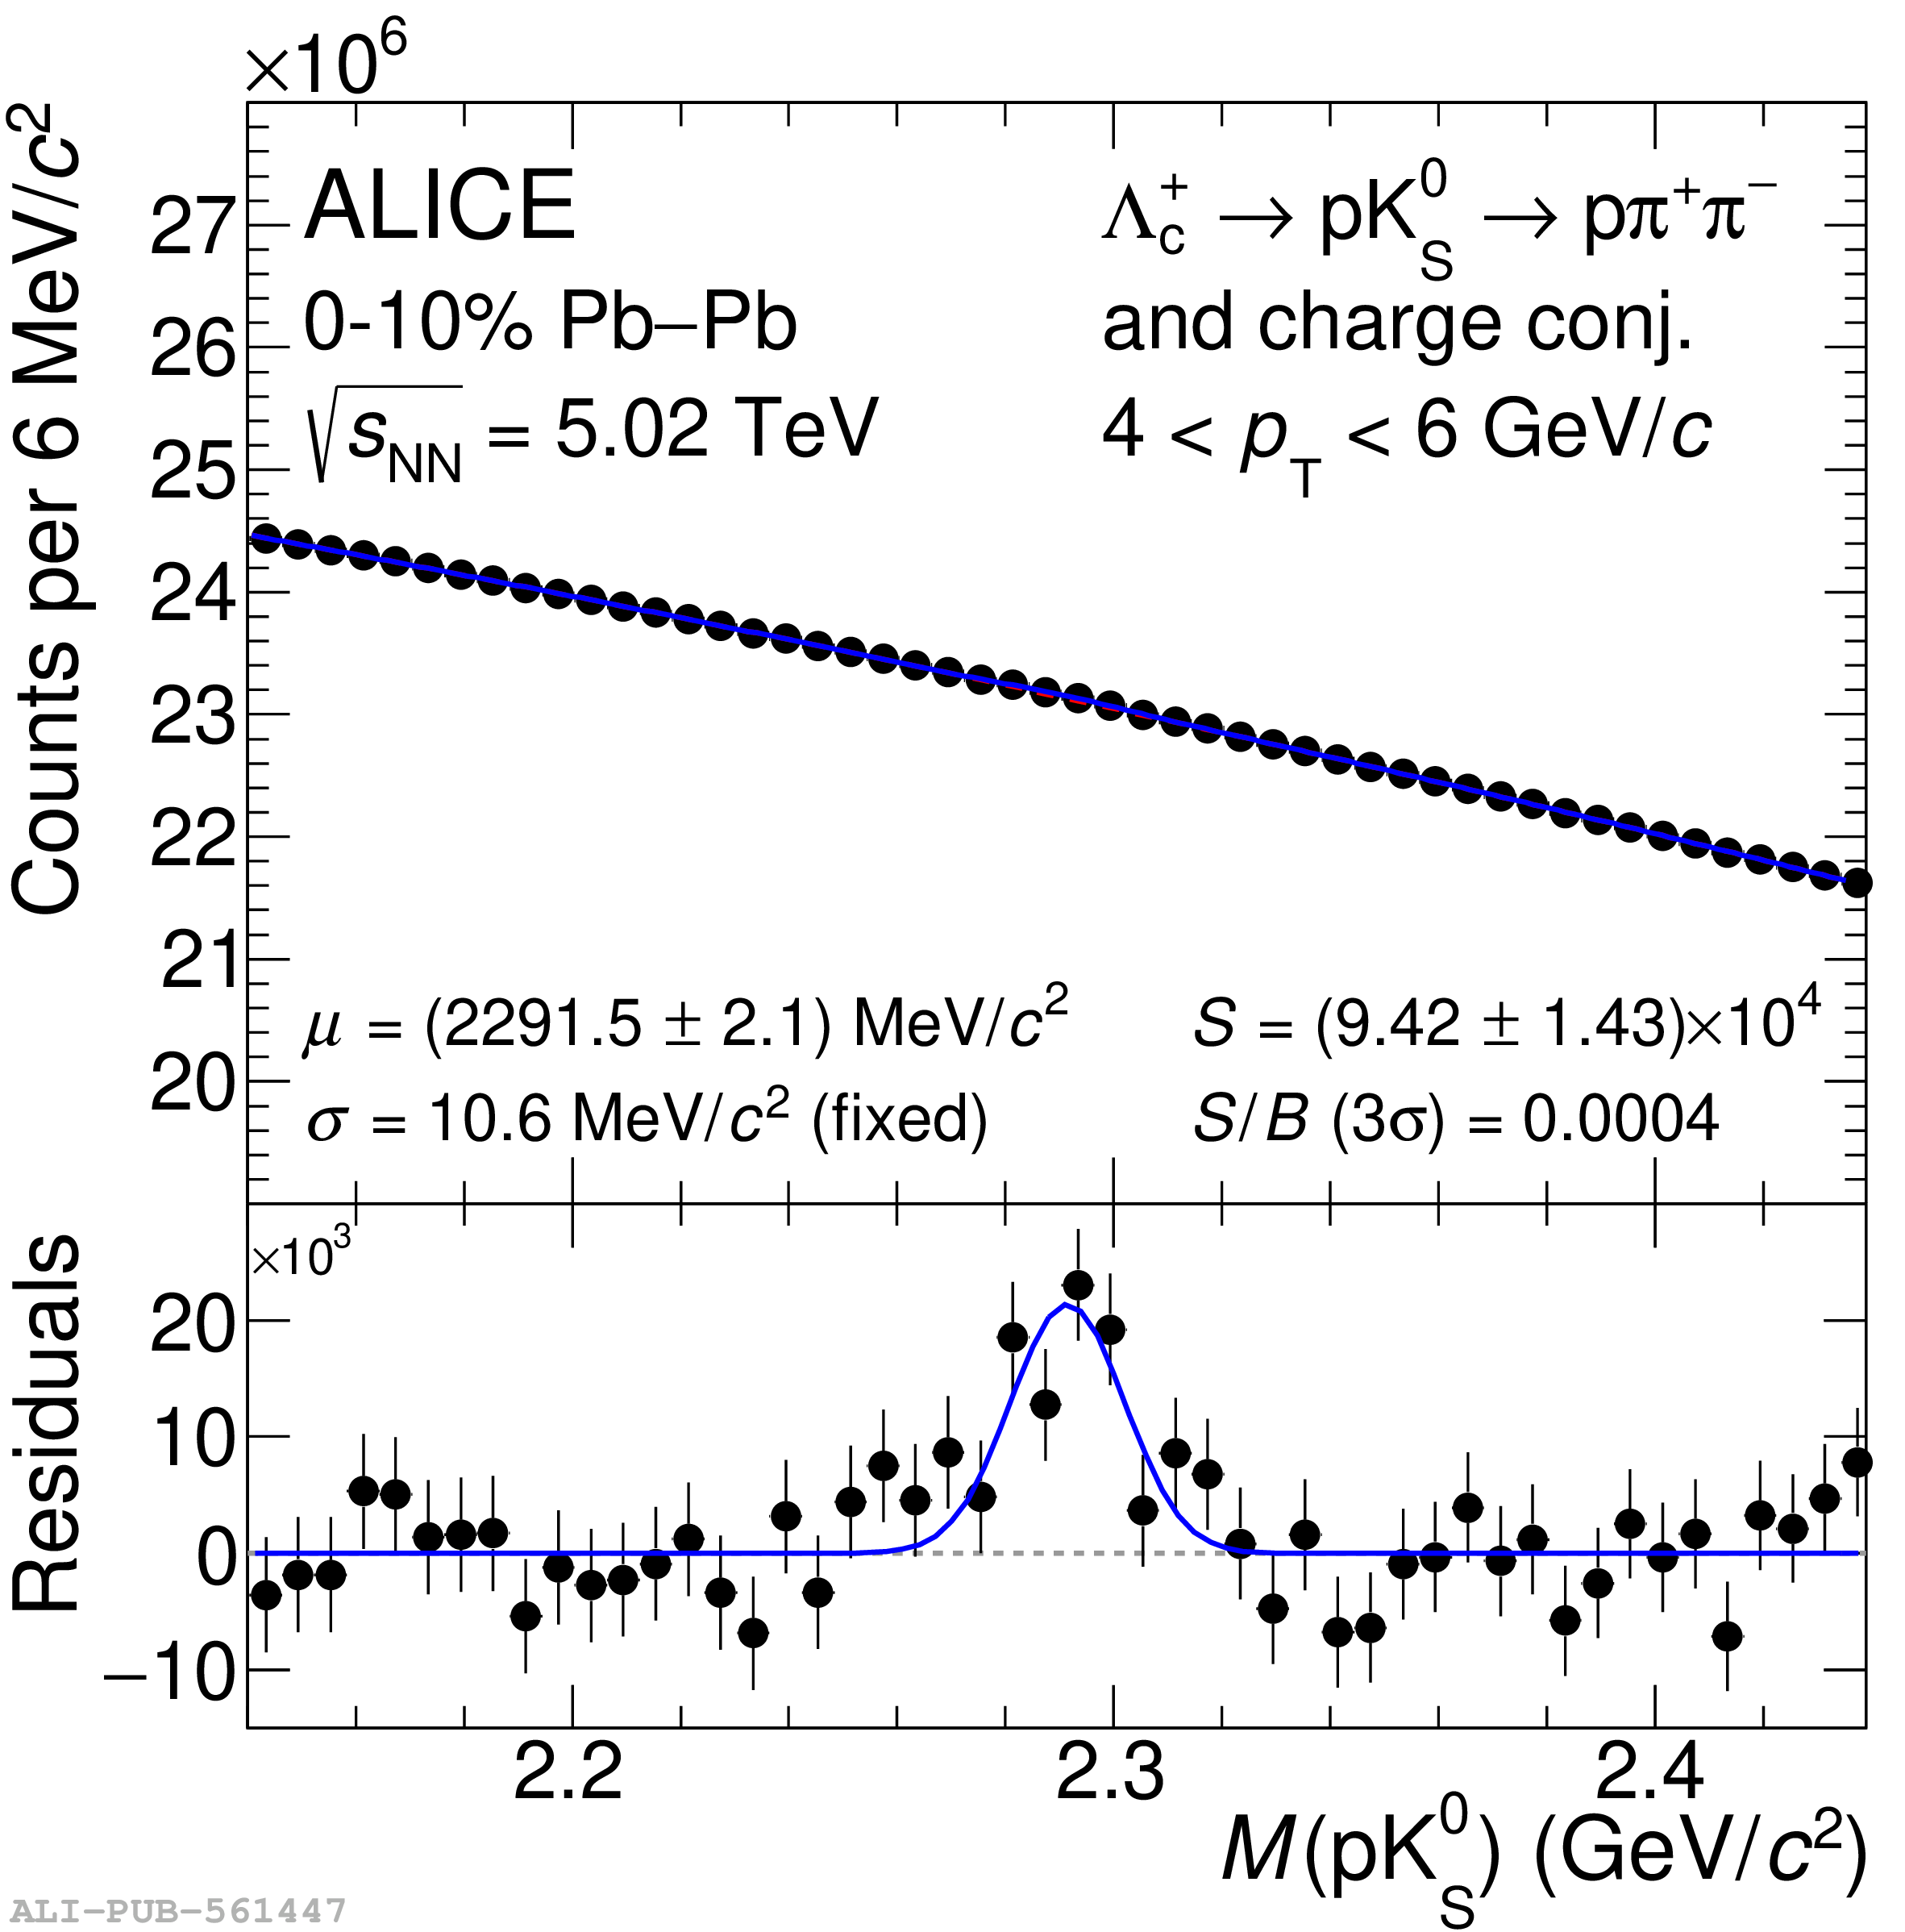 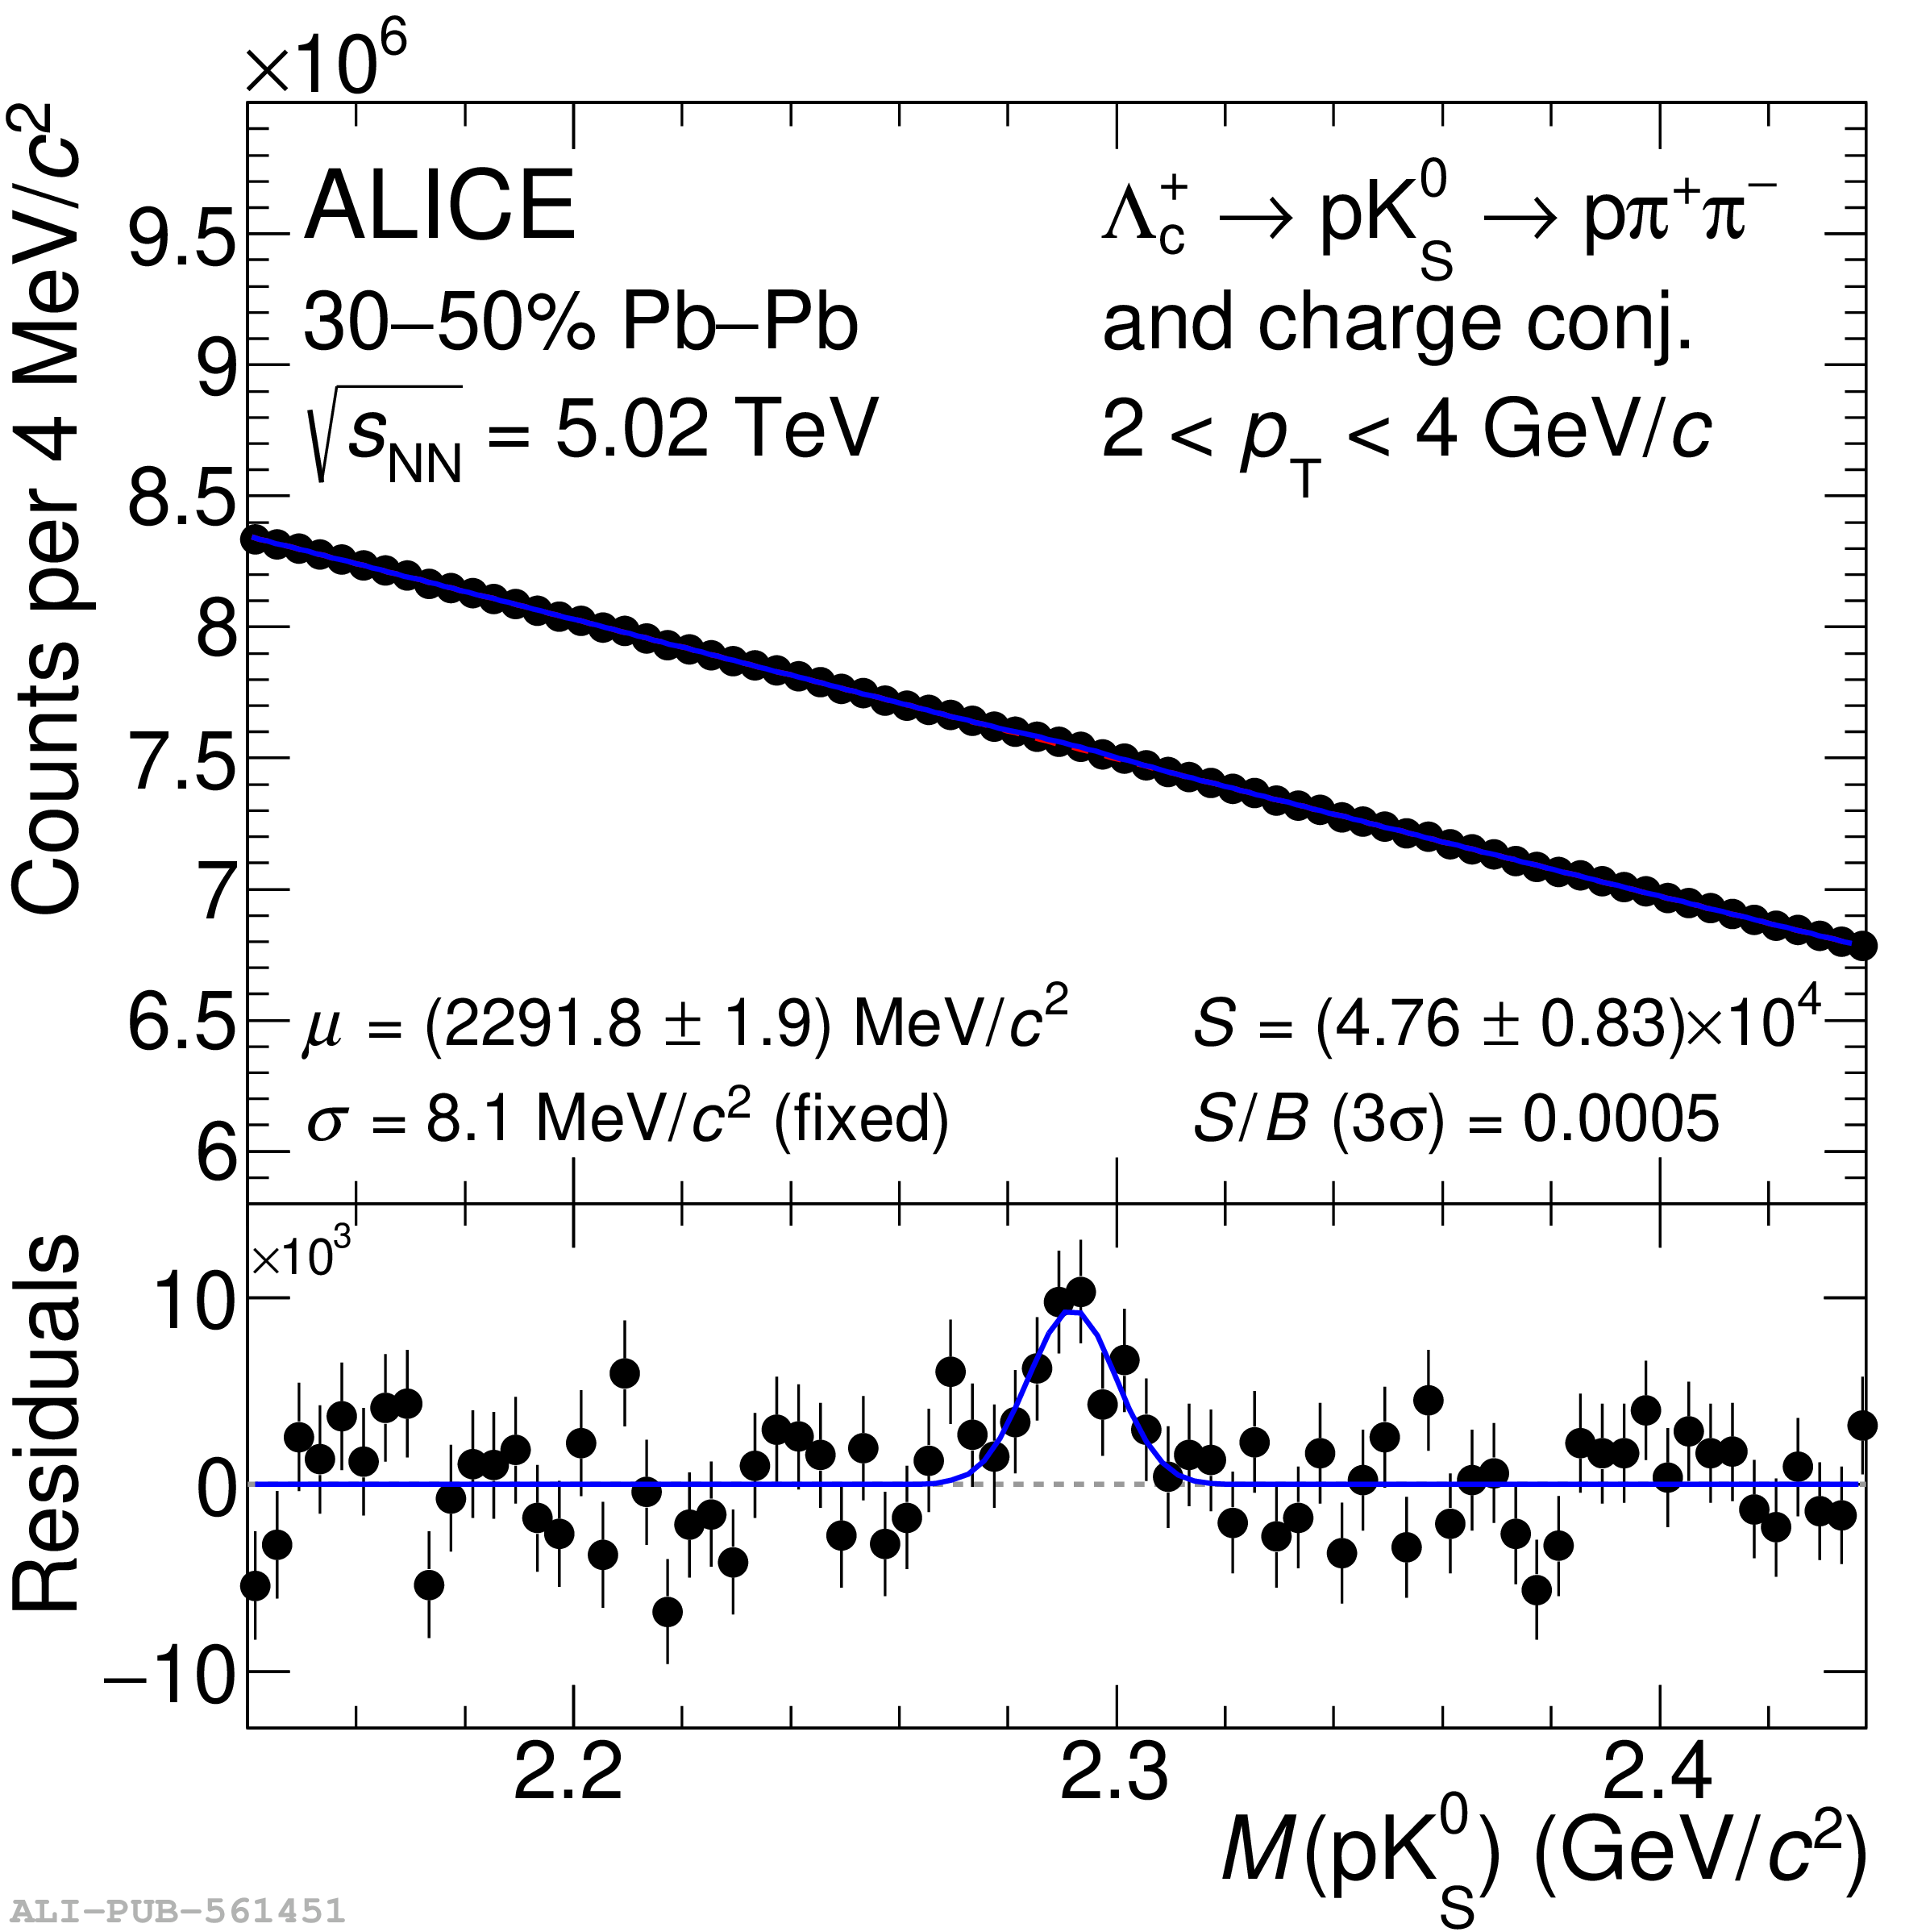 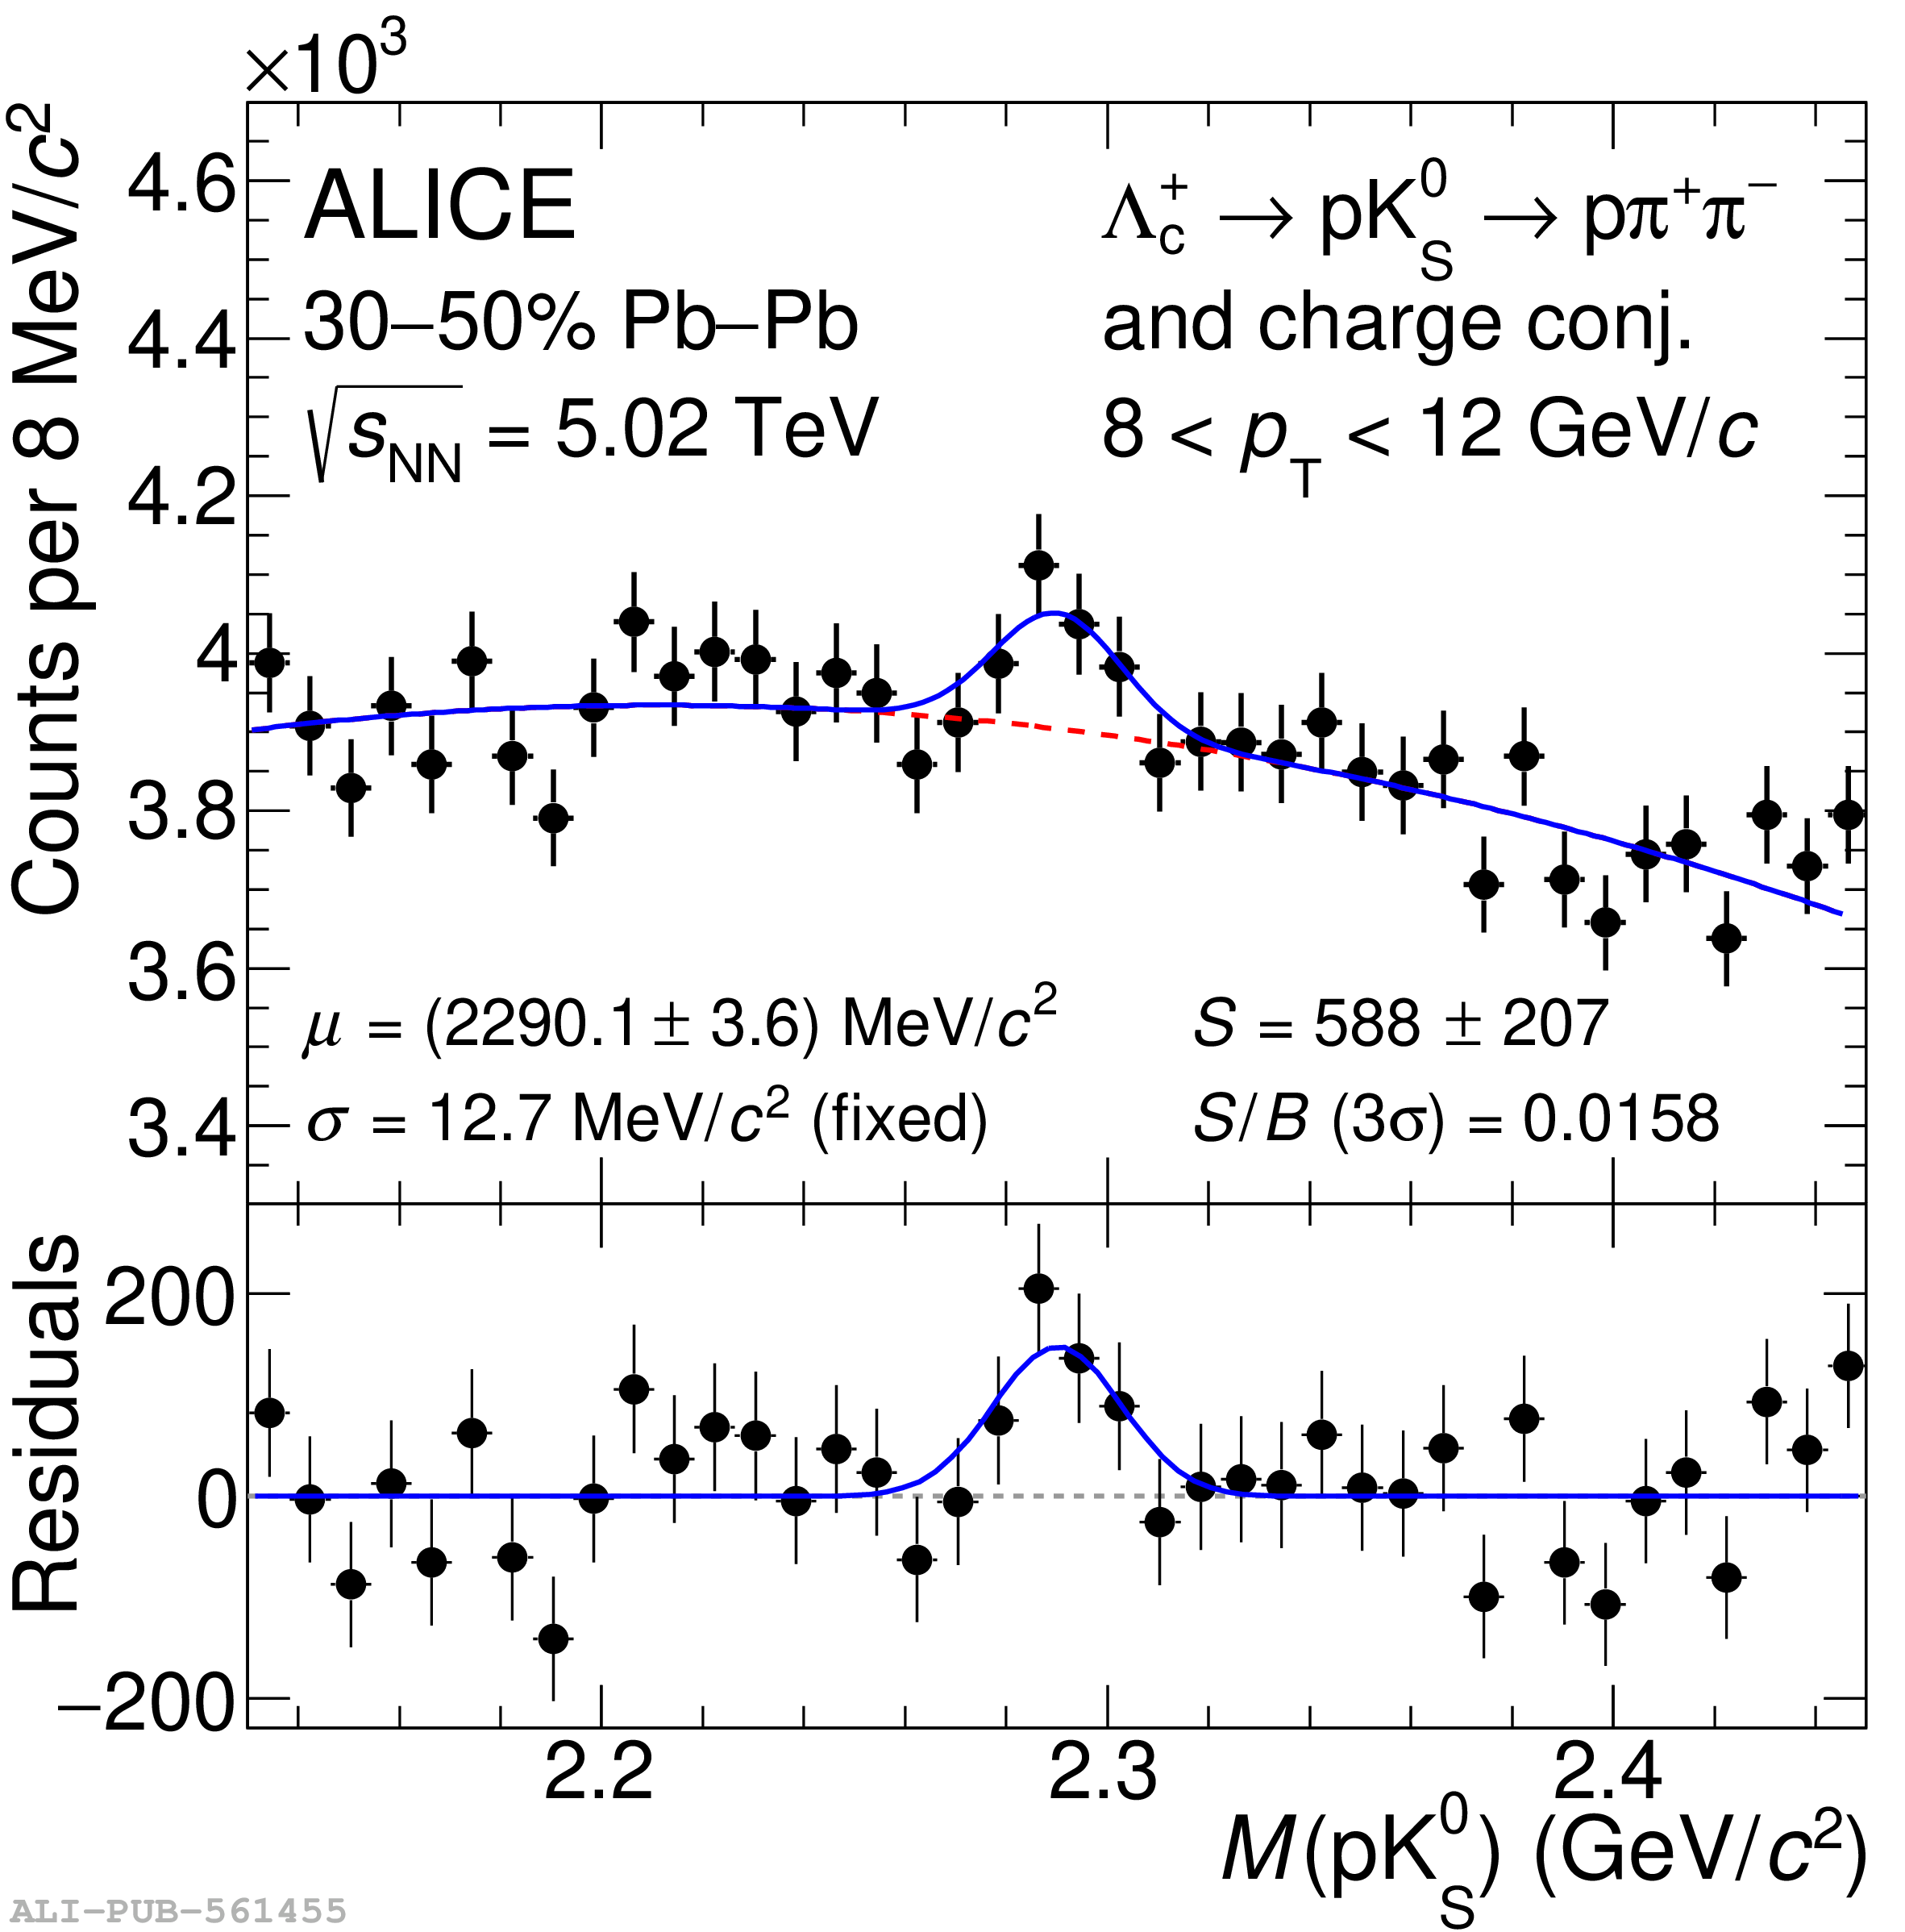 |