$\pT$-differential density distributions for inclusive (left) and within jets (right) ${\rm K_S^0}$ (black closed circles), $\Lambda$ (red open circles), $\Xi$ (blue squares), and $\Omega$ (green inverted triangles) in pp collisions at $\sqrt{s}$ = 13 TeV. The spectra in data are compared with PYTHIA 8 CR-BLC simulations Three modes, labeled as mode $0$ (solid line), $2$ (dashed line), and $3$ (dash-dotted line) are adopted in the simulations The PYTHIA-to-data ratios are shown in the four bottom panels where the spread of the three PYTHIA 8 CR-BLC implementation modes are presented as bands For clarity, some of the spectra were scaled with the factors indicated in the legends The statistical uncertainties are represented by the vertical error bars and the systematic uncertainties by the boxes. | 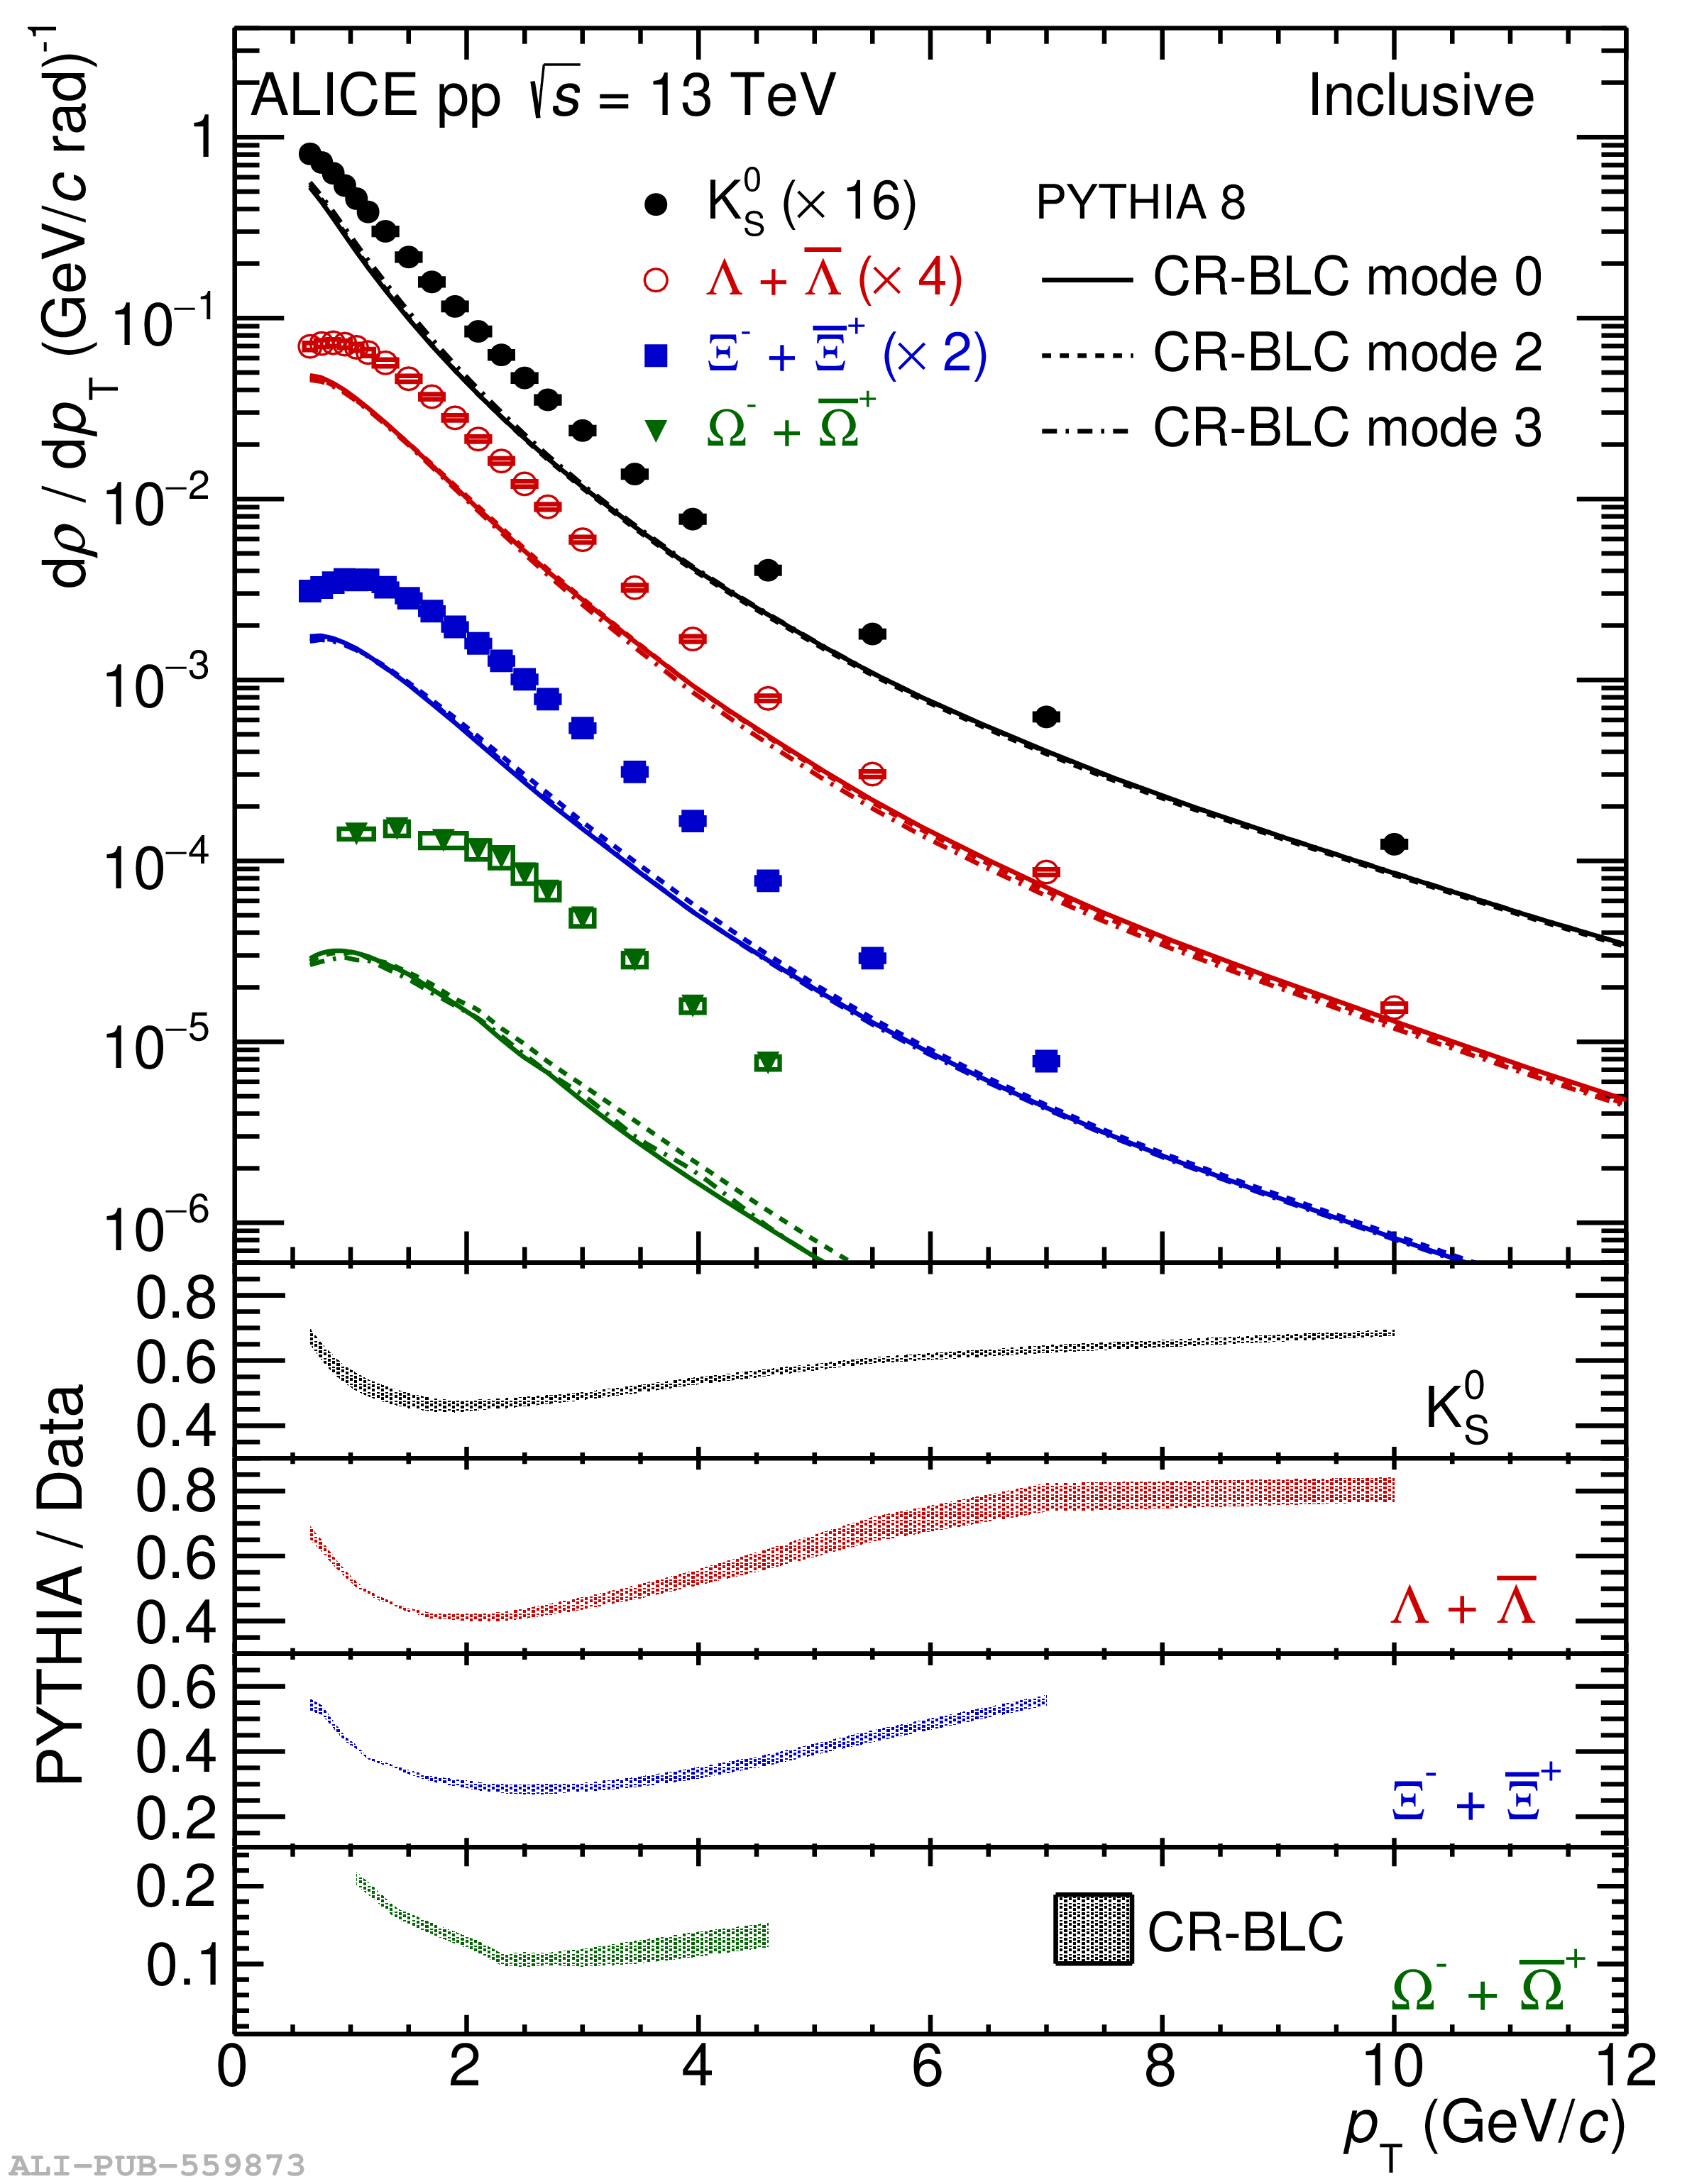 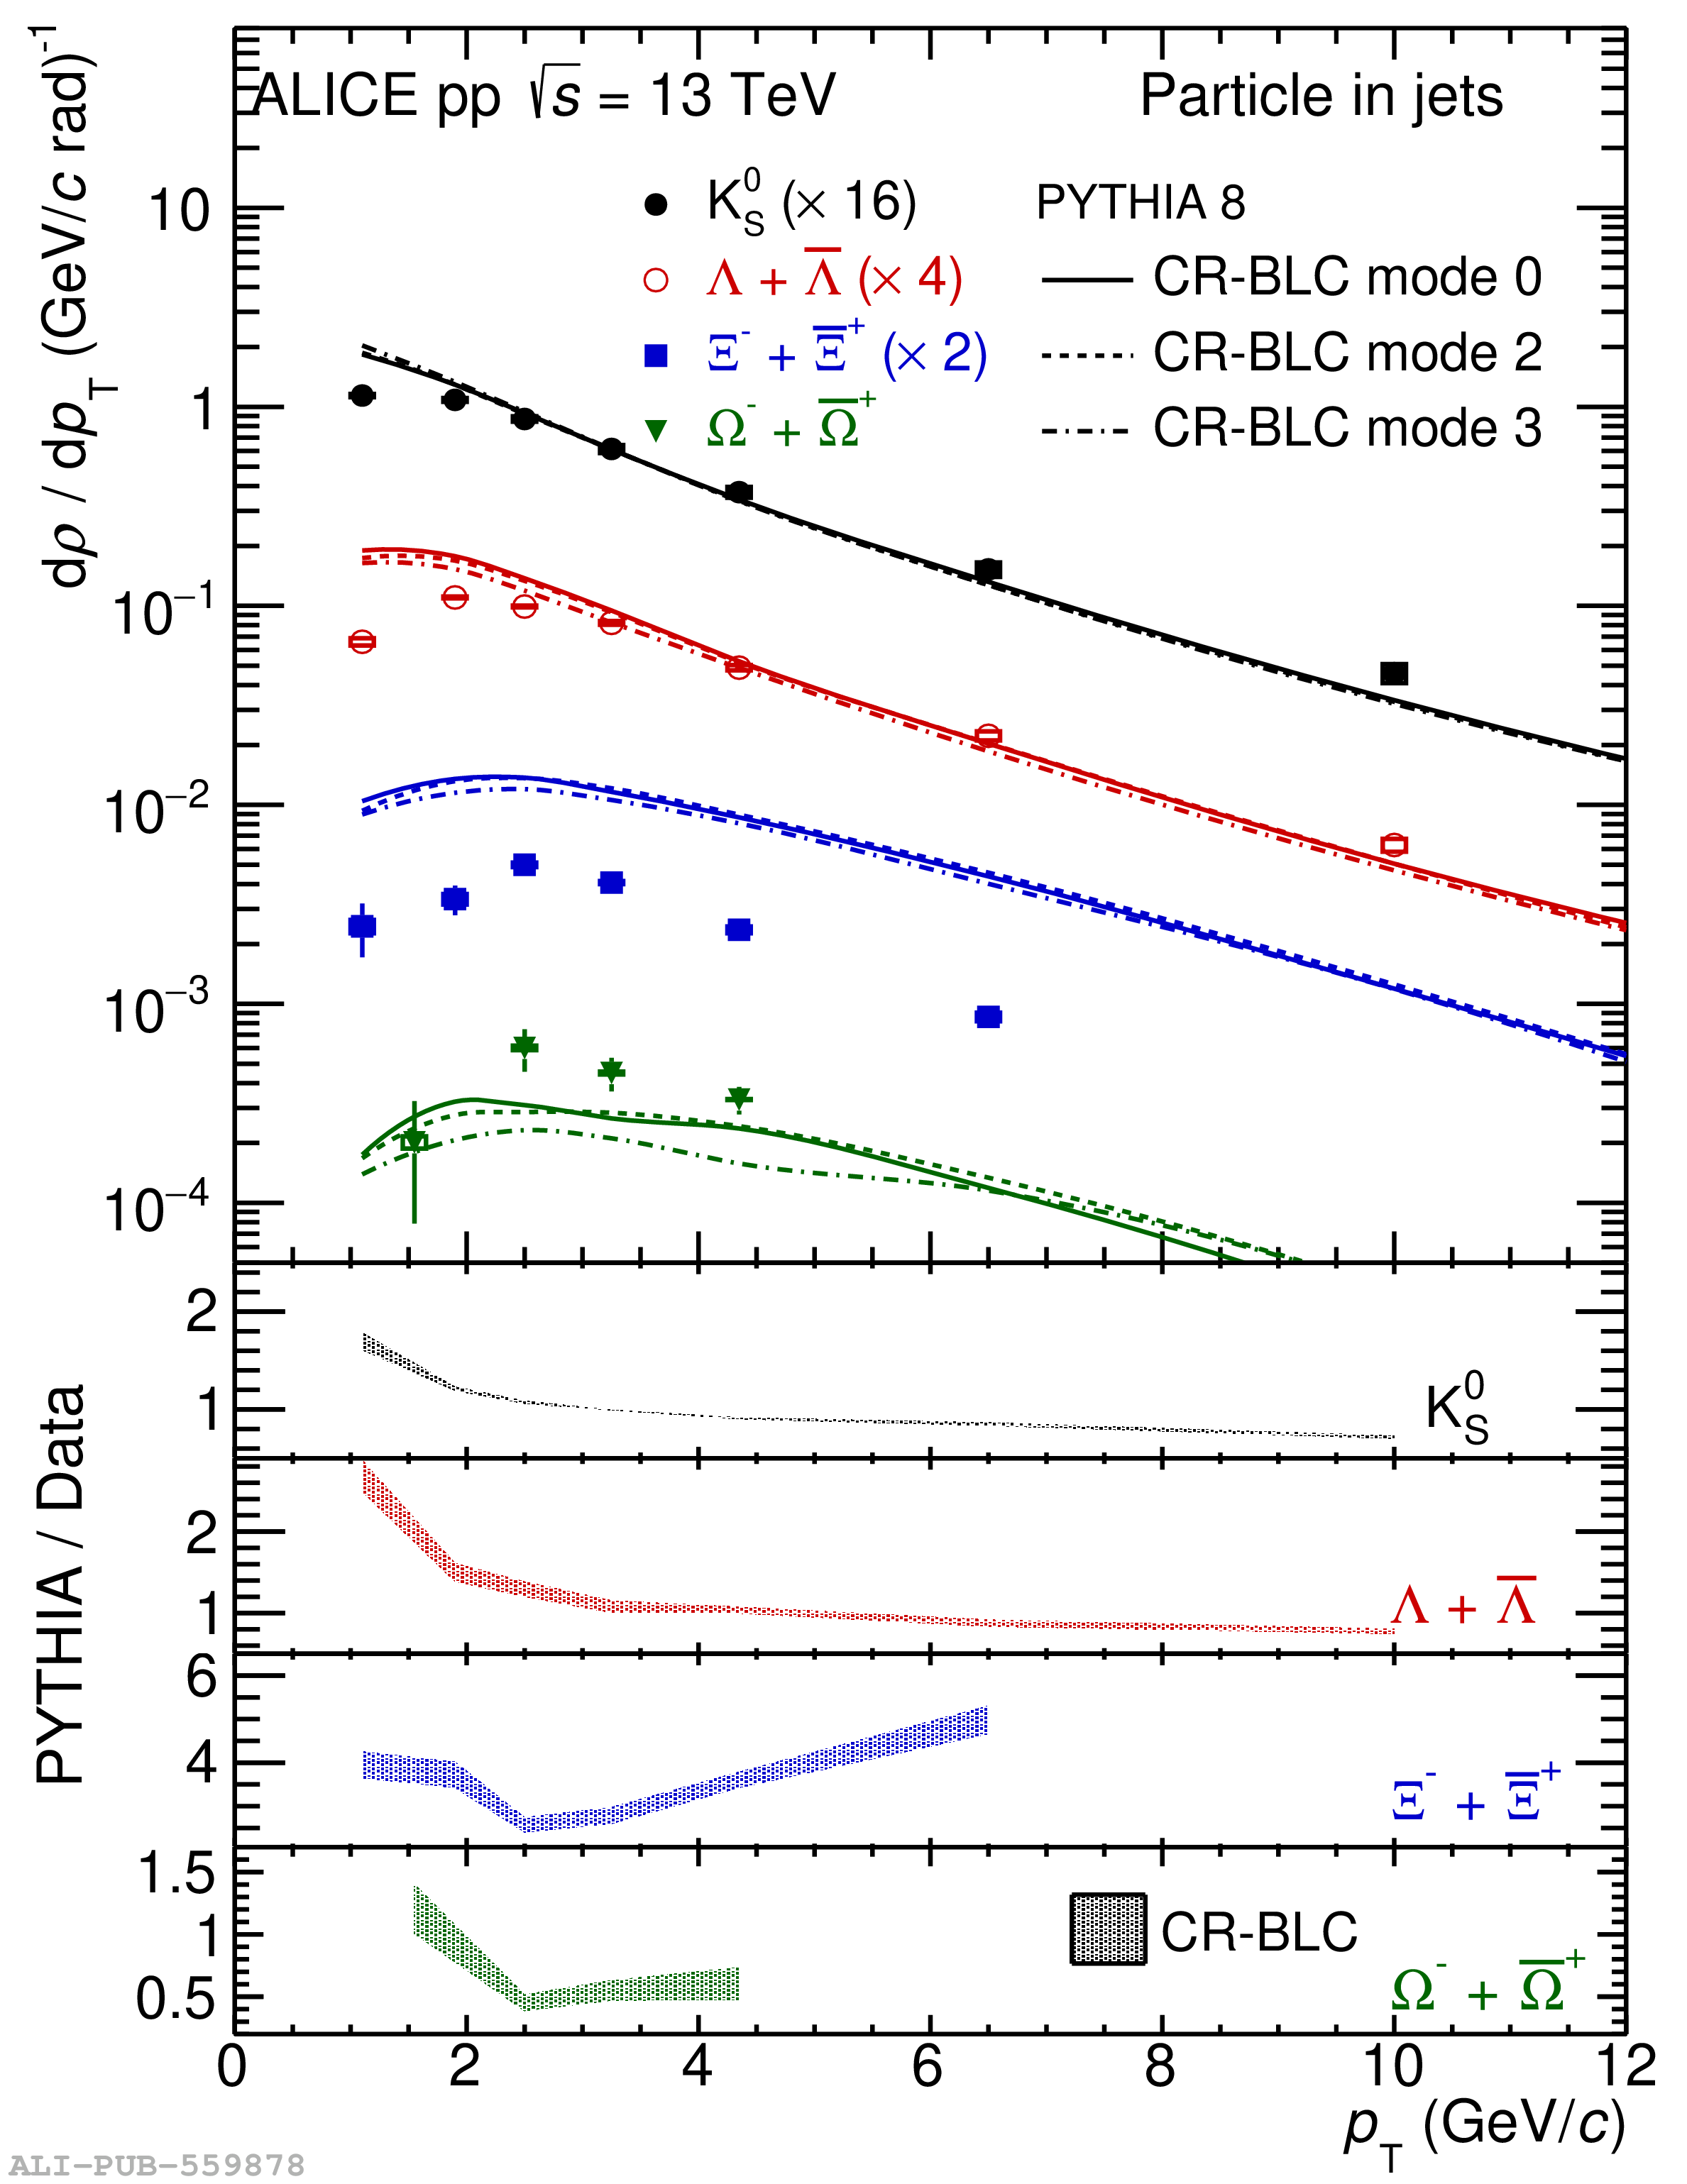 |