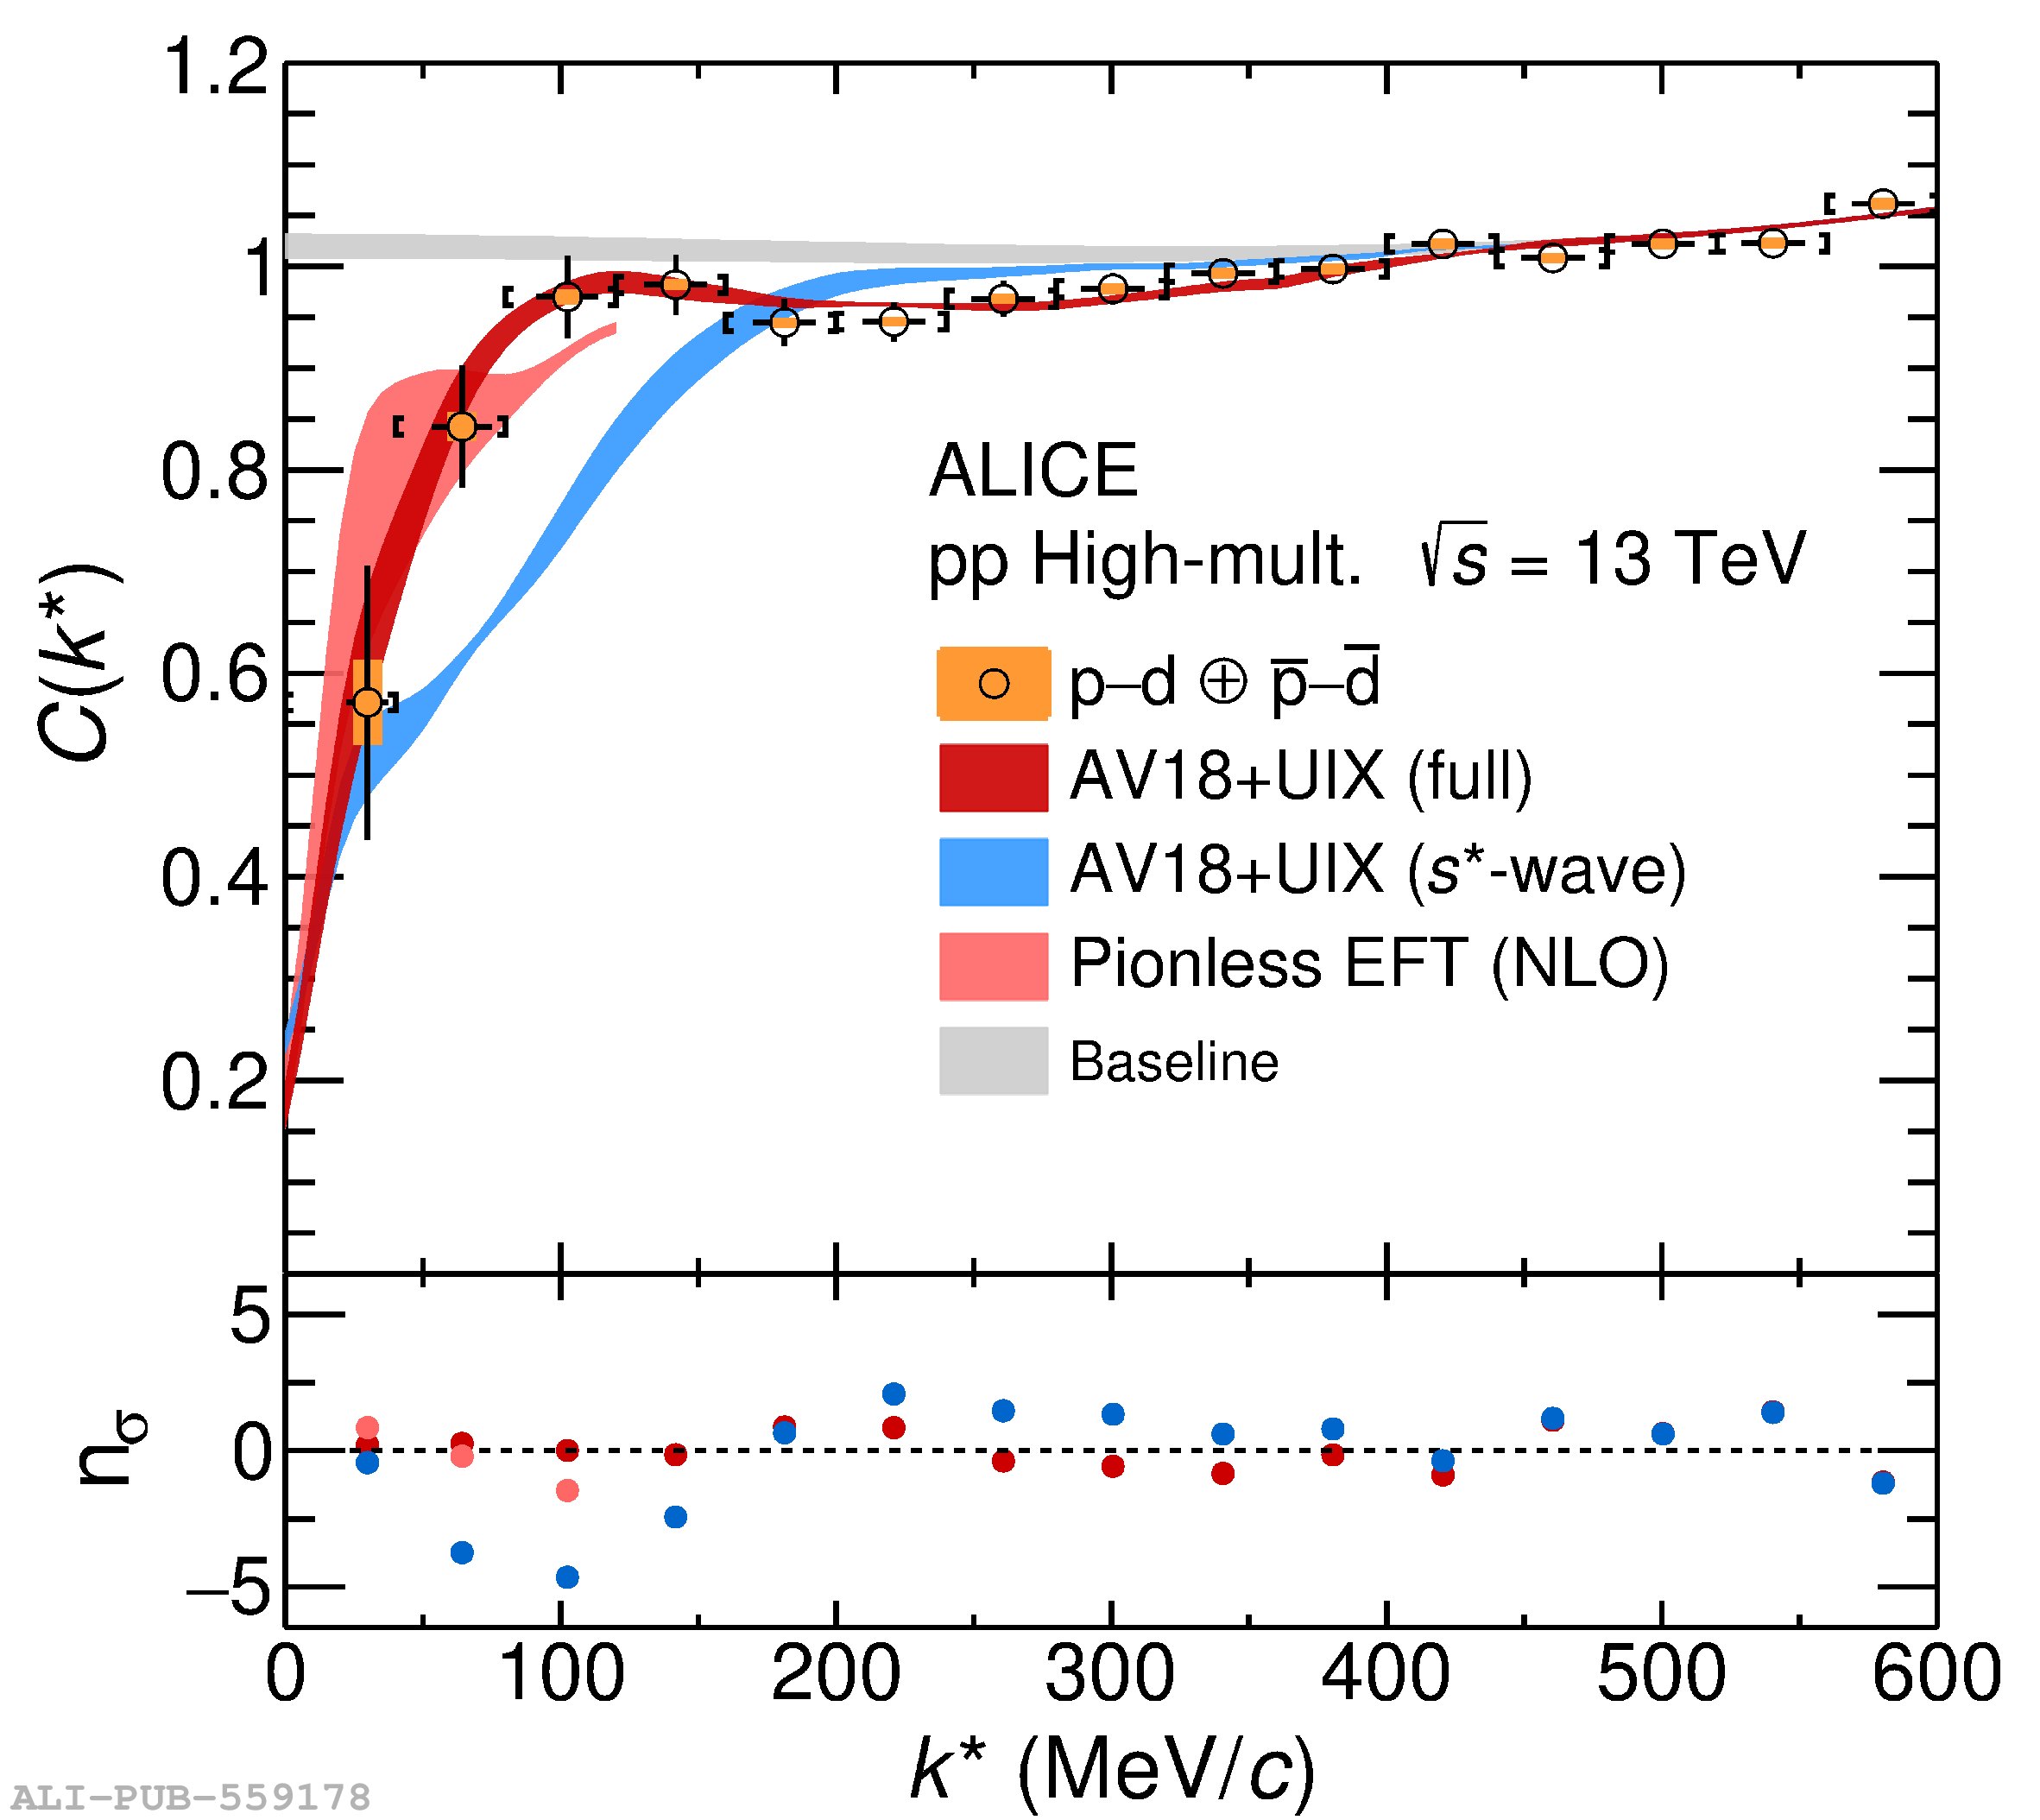
Measured \pd correlation function plotted as a function of the \pd relative momentum $k^*$ alongside theoretical calculations. The experimental data are represented by circular symbols. The black vertical bars and orange boxes correspond to the statistical and systematic uncertainties, respectively. The square brackets indicate the measurement bin width and the horizontal black lines represent the statistical uncertainty in the determination of the mean $\ks$ for each bin.. The non-femtoscopic background contributions are represented by the gray band of the cubic baseline. Left panel: the orange and turquoise bands depict calculations obtained using an optimized Born approximation and Coulomb + antisymmetrization of the three-particle wave function, respectively. Right panel: the dark red band represents a fit of the modeled correlation calculated considering \pd as a three-body system with all relevant partial waves. The blue-colored band corresponds to a calculation that includes only the $s$-wave contribution. The light red band represents a calculation of the correlation function using Pionless EFT at NLO (see text). All calculations are multiplied by the cubic baseline, and the bandwidths of all calculations account for uncertainties in the determination of the radius and residual contributions. The lower panels present the difference between the measured and calculated correlation function, expressed as the number of standard deviations, $\text{n}_\sigma$, taking into account the statistical uncertainties of the data and the model uncertainties. | 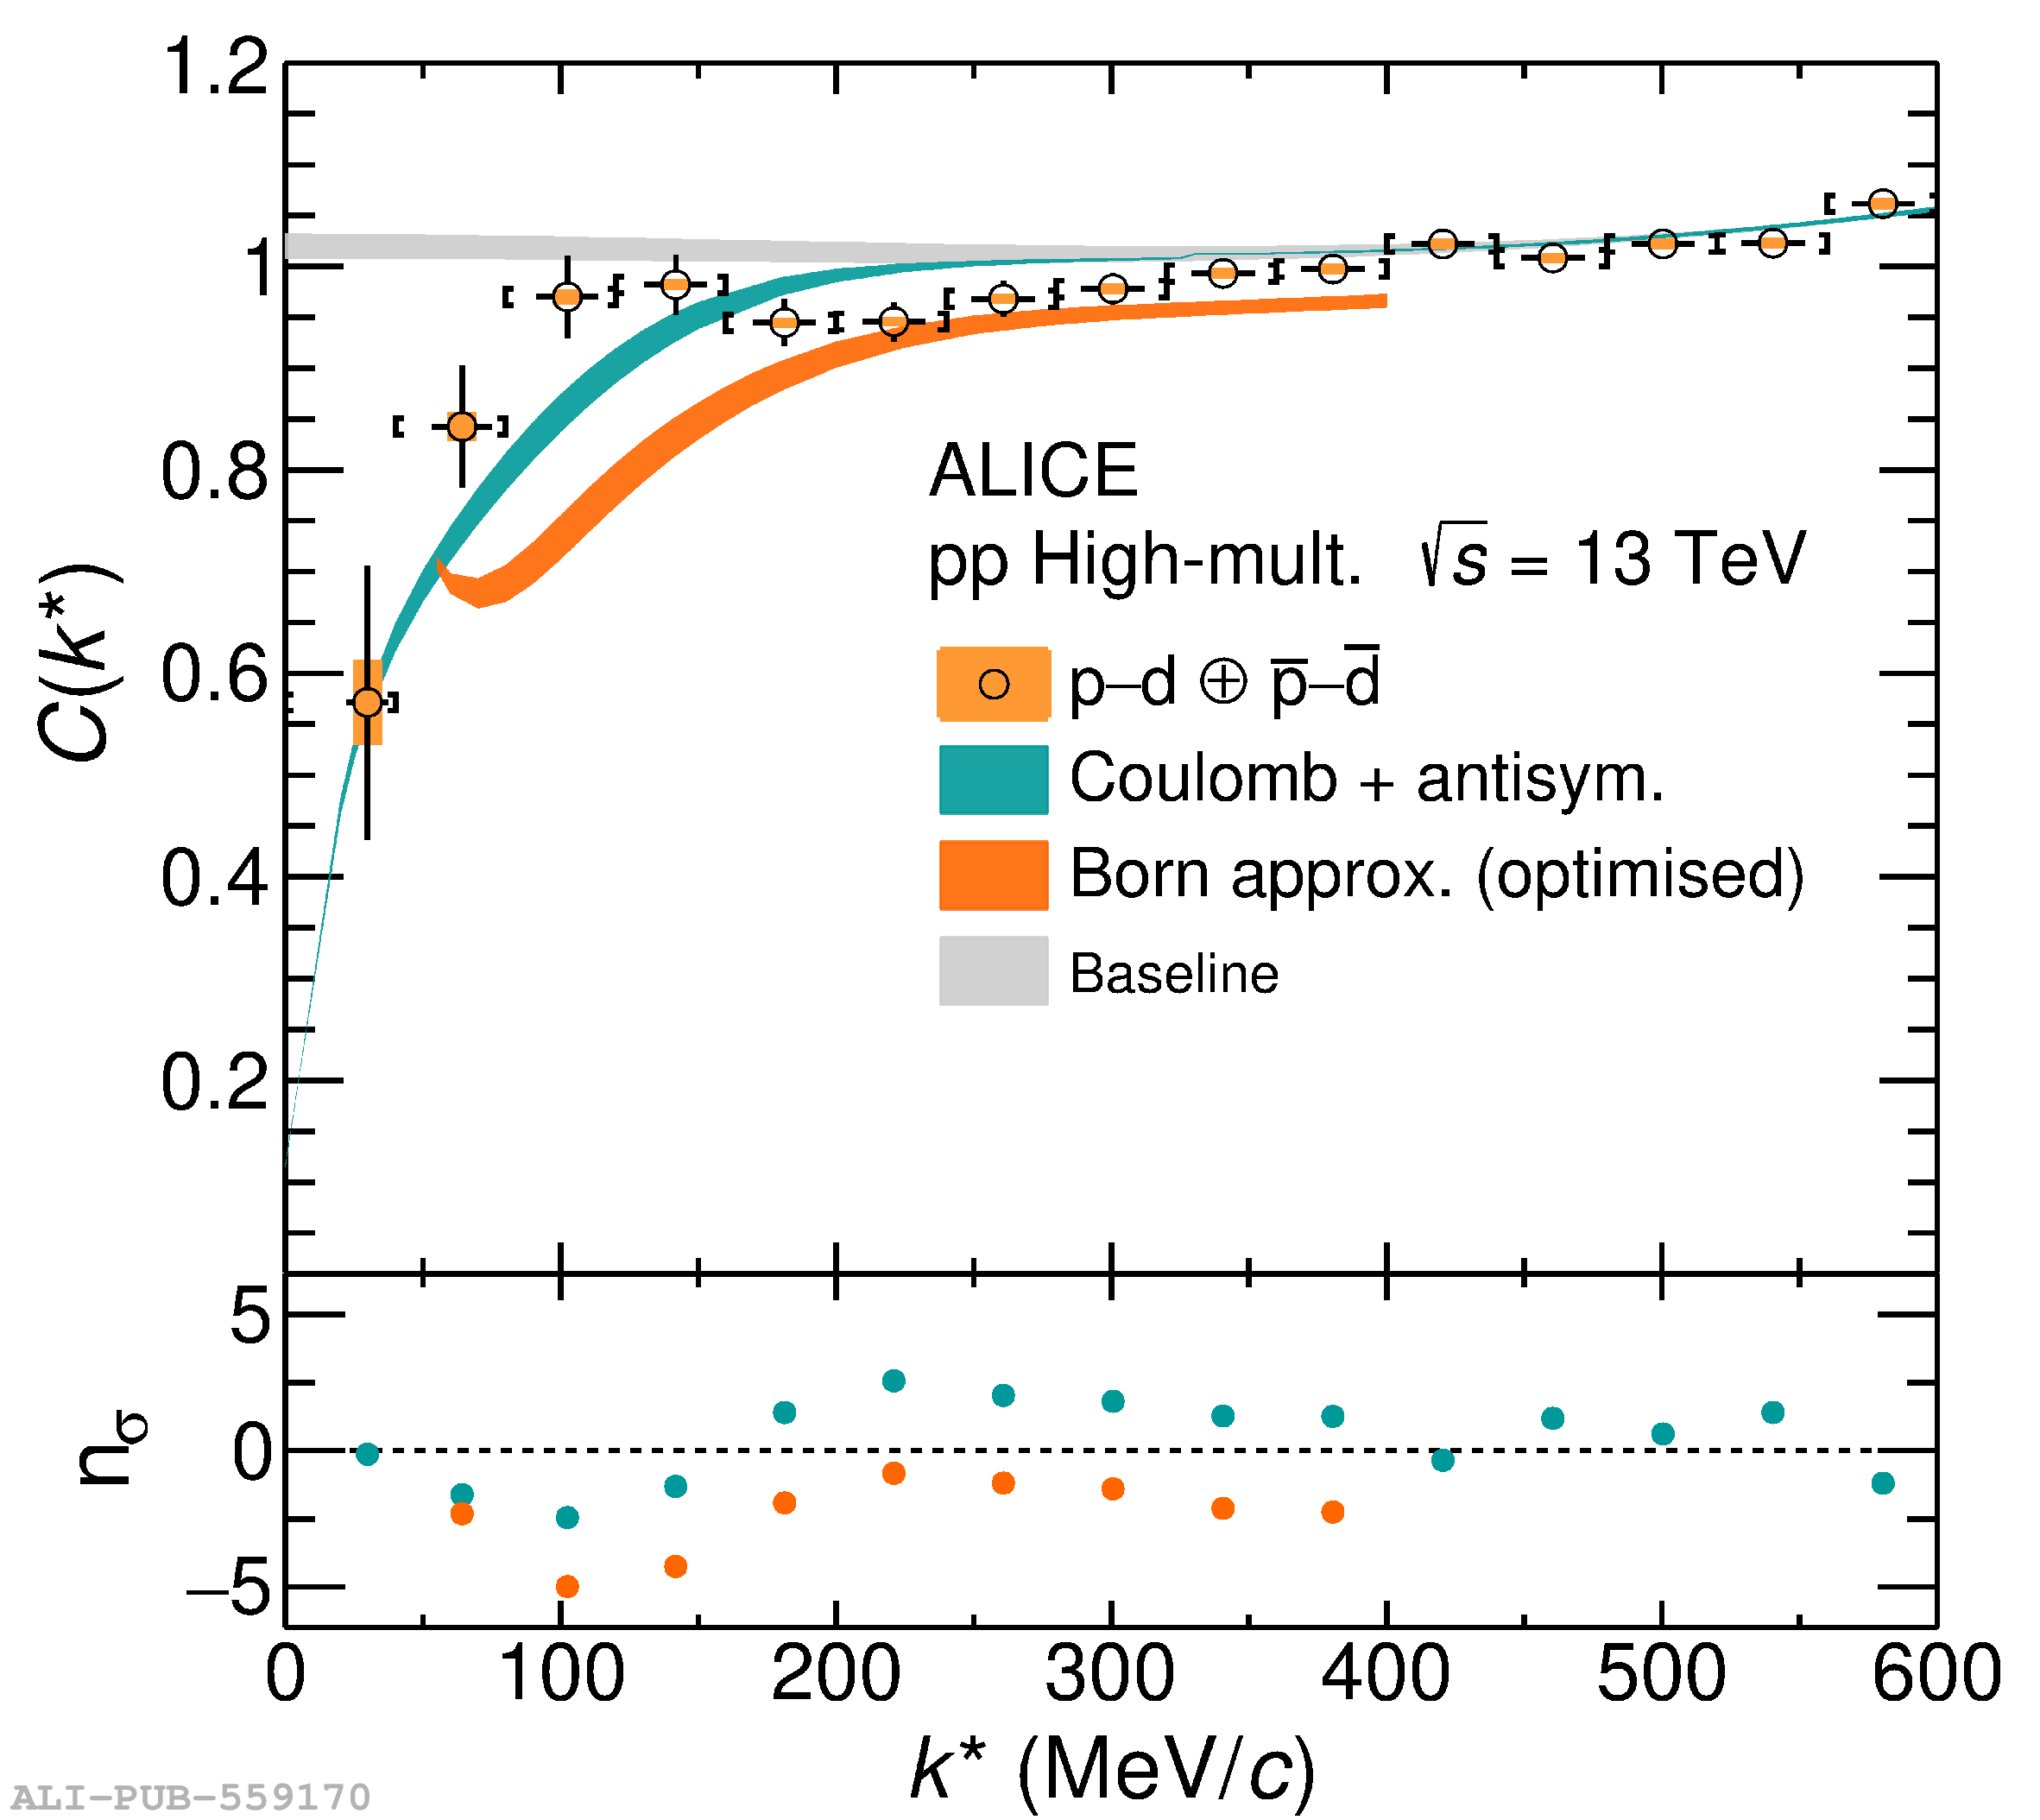  |